

-
Stock Investment Update - The Anatomy of the Young Stock Market Bull
June 1, 2020, 5:34 AMWelcome to this week's Stock Investment Update.
After Thursday's late-day setback, stocks stabilized only to dip again in the runup to Trump's press conference - but what is the subsequent rebound made of? In today's flagship Stock Trading Alert, I'll examine the prospects of the bull run, and assess the bulls' strength. Can they power higher still?
S&P 500 in the Medium- and Short-Run
The month of May is over, so let's start with the monthly chart perspective (charts courtesy of http://stockcharts.com ):
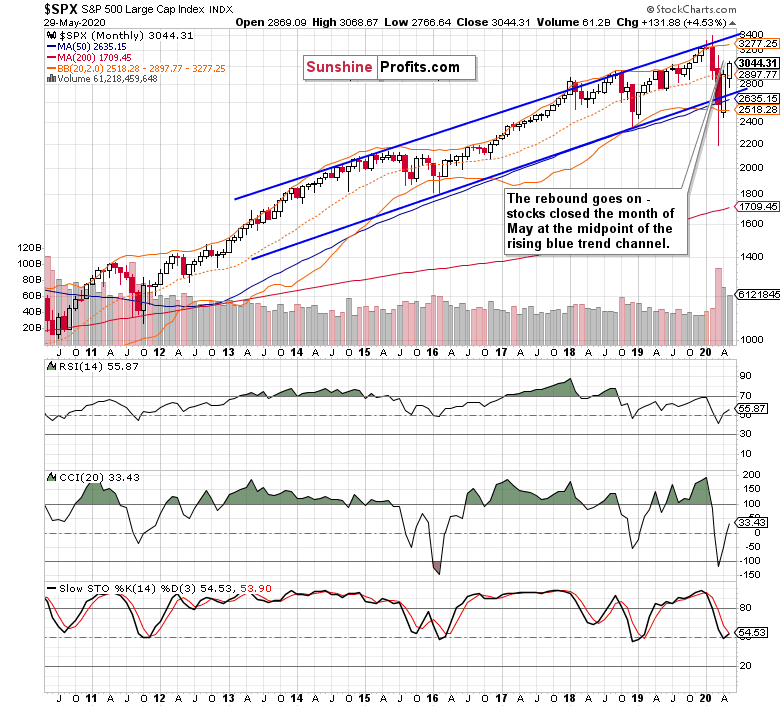
Quite a sharp rebound from an even sharper plunge - that would be a fitting first impression. After breaking below the lower border of the rising blue trend channel, stocks reverted to trade solidly back inside. Having reached the midpoint of the channel amid improving monthly indicators, can we look forward for more gains ahead?
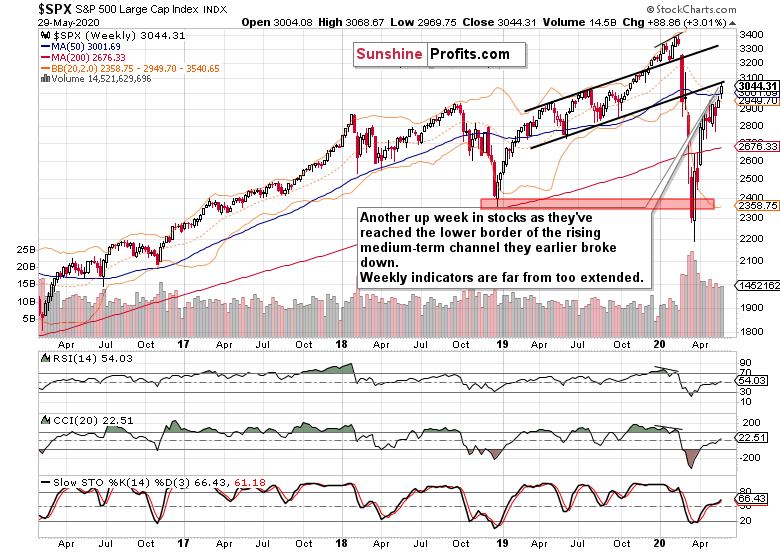
The weekly chart shows bullish price action that overcame another key resistance - the early March gap (shown in detail on the below daily chart). Breaching also the 50-week moving average, stocks have tested the lower border of the rising medium-term channel that they broke down from earlier.
While the weekly indicators are extended, they're not overly extended. Neither the volume reveals increasing involvement of the sellers. When will they show up to wage a decisive battle for lower prices?
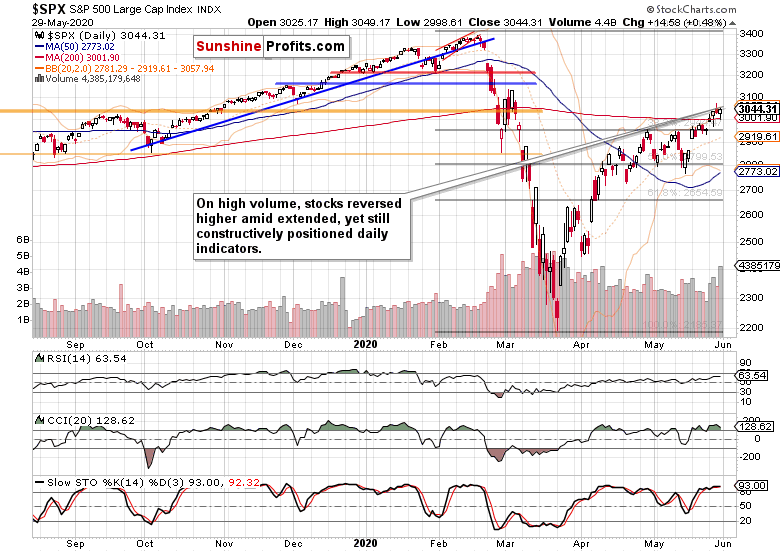
The daily chart shows that we've seen the first shot on Friday. On sizable volume, the bulls regained the initiative. Has there been a particular driver of the intraday downswing?
Let's recall Friday's Stock Trading Alert:
(...) Trump will focus on China. When the latter has been announced, it marked the start of the heavy S&P 500 selling 45 minutes before the closing bell (on Thursday). As tensions have been rising, the short-term direction in stocks very much depends on the overall balance of President's announcement as regards Hong Kong, the Uyghur bill, coronavirus, the China-India border and foremost the trade deal.
Little wonder that stocks have been jittery. How did the drama end?
Let's quote the late-Friday's intraday Stock Trading Alert:
(...) stocks have weakened in the runup to the Trump press conference. Right after the first preliminary soundbites (notably the one that the Phase 1 China trade deal is on), stocks reversed intraday losses, and the HYG ETF moved close to its recent highs.
In other words, the prospects for the stock market upswing to reassert itself are intact.
Such were the key fundamental events late last week. But before moving over to the credit markets' perspective, let's dig some more into the daily chart's technicals.
Last week, stocks overcame both the early March gap and the 200-day moving average. The next objective for the bulls would be the early March highs at 3137. Can they make it there before the extended daily indicators call for a breather? While that's possible and appears to be a question of time, I wouldn't necessarily bet the farm on that.
After all, we've seen two intraday reversals (on Wednesday and on Friday). The odds continue favoring the bulls but a quick, out of the blue test of their resolve before the next upleg isn't out of the question.
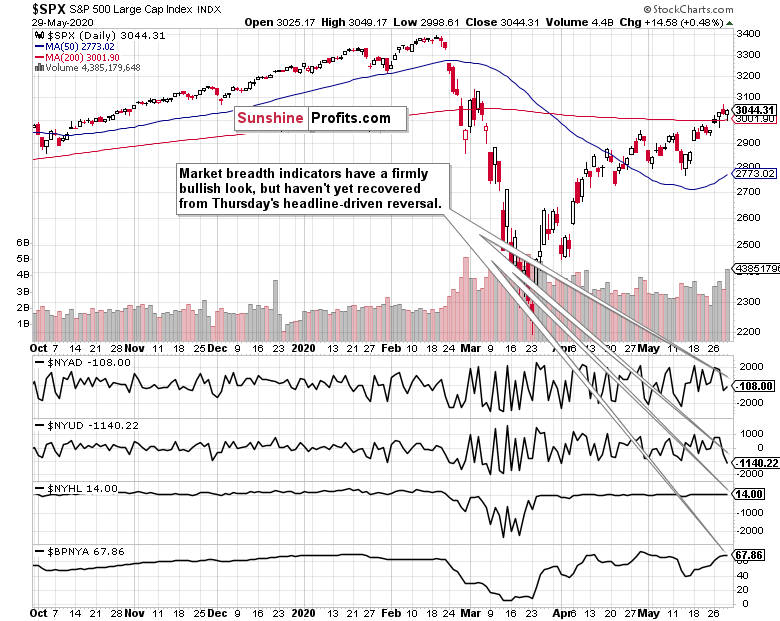
Market breadth indicators underscore the setback suffered late last week. Despite being solidly in a bull market environment as the bullish percent index shows, both the advance-decline line and advance-decline volume have retreated. On one hand, that's to the territory where their next upturns started, on the other hand, should stocks struggle in the near term, these two indicators could form negative divergencies over the coming sessions.
Now, would the credit markets support the softly cautious, yet still bullish tone?
The Credit Markets' Point of View
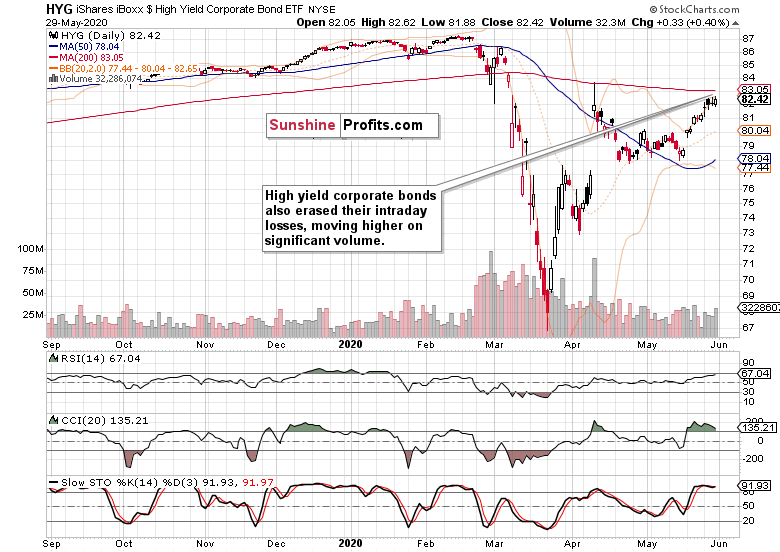
High yield corporate bonds (HYG ETF) still fully confirm the stock market upswing. Marching in lockstep higher, the bond ETF hasn't suffered any intraday losses to speak of, and closed near the daily highs. The strong uptrend remains intact, providing tailwind for stocks.
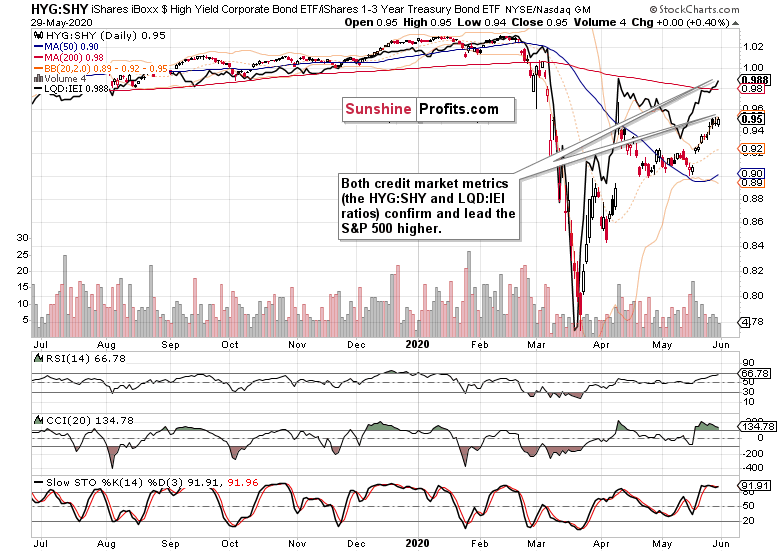
The chart of the high yield corporate bonds to short-term Treasuries ratio (HYG:SHY) with the overlaid S&P 500 prices (black line), also continues supporting the stock bull run.
Both the index itself, and the S&P 500 to Treasuries ratio have overcome their April highs. As they're moving in sync, that's conducive for the stock bull run to go on.
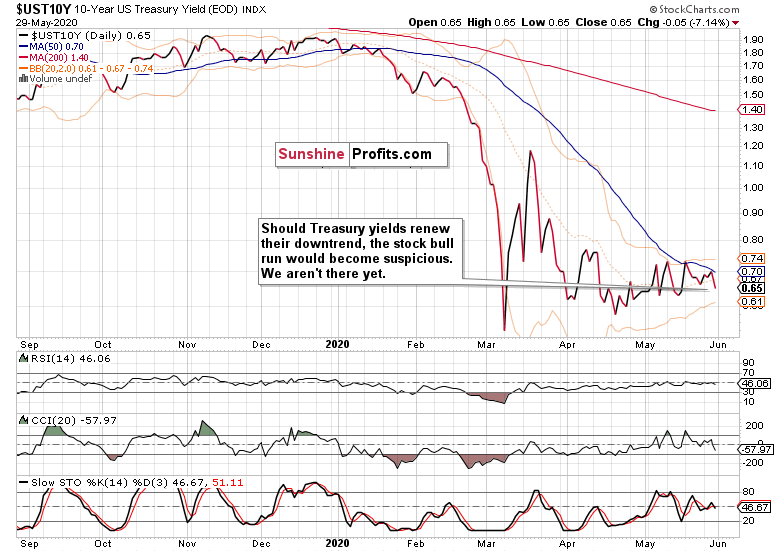
Examination of the 10-year Treasury yields confirms this conclusion. Should the yields spike to the downside, that would be a huge warning sign for stocks. But we're not in a flight to safety that would send yields plunging, bidding Treasuries higher as investors seek refuge.
The sideways trend doesn't really stand in the way of further stock gains. Conversely, should we see yields rise, that would send a clear signal that it's becoming broadly acknowledged the recovery (in stock prices too) is well underway.
But with all the Fed interventions, yields will have a really hard time rising - and keeping yields low is a key monetary policy tool employed that lits the TINA (there is no alternative) fuse, which this works to support stocks.
Key S&P 500 Sectors and Ratios in Focus
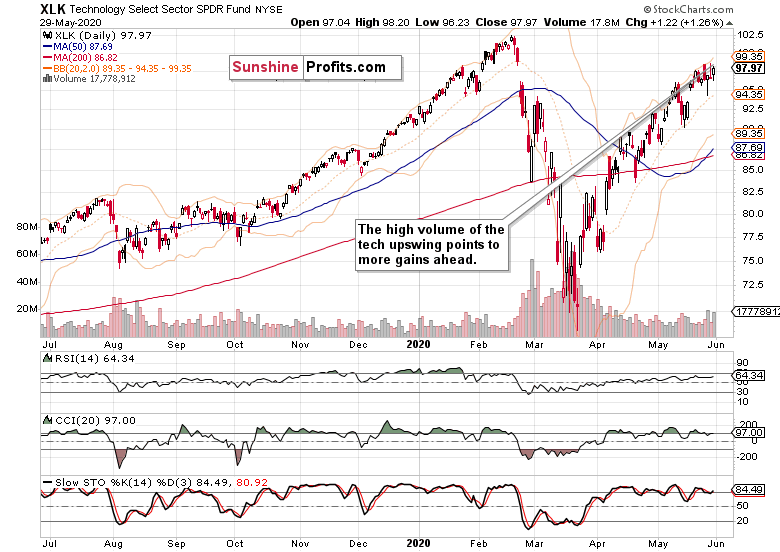
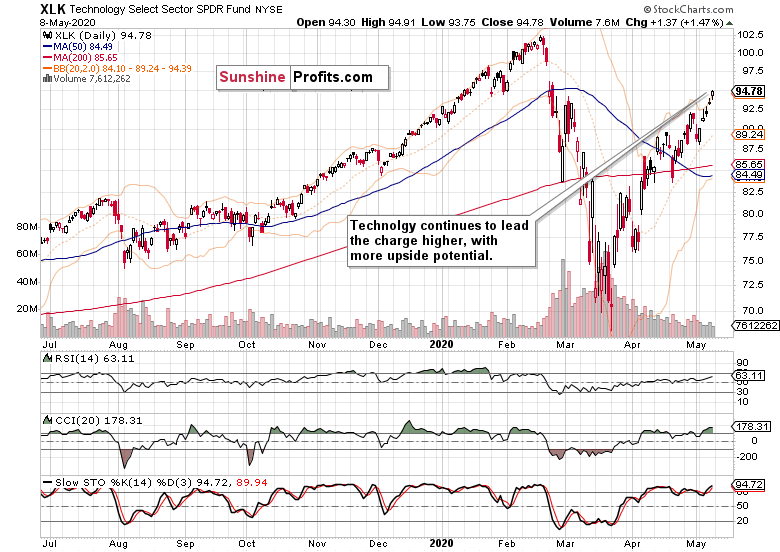
Technology (XLK ETF) continues leading higher, and both the shallow intraday losses on Friday and the subsequent rebound are giving strong hints that this run is very far from over. The sizable volume attests to that.
Within technology, semiconductors (XSD ETF) are performing strongly - they've already closed their late February bearish gap, while tech in merely on the verge of doing so. Semiconductors outperforming the behemoths is a risk-on sign, and works to lead stocks higher.
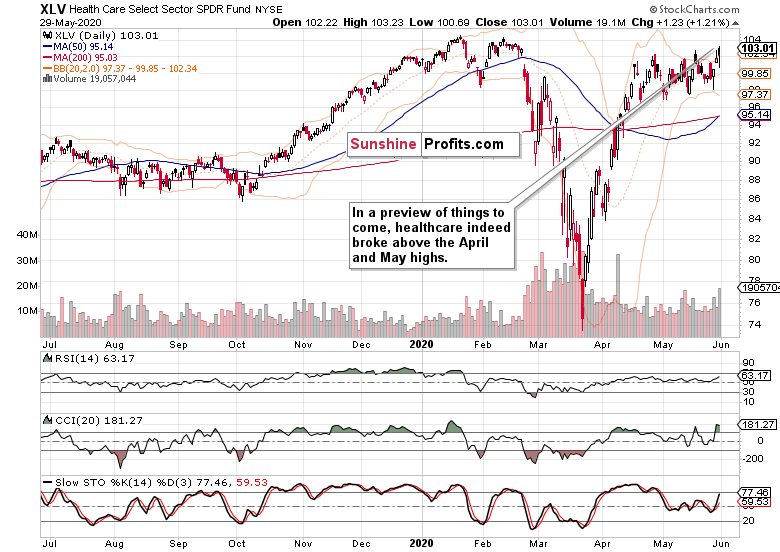
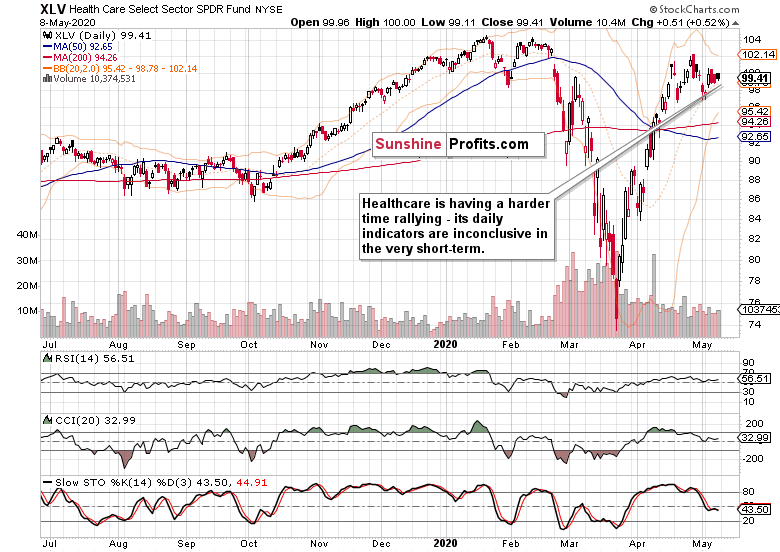
Healthcare (XLV ETF) is another star performer, and the upside breakout of the recent trading range that I have called for early on Friday, is underway now. The daily indicators are supportive of the unfolding upswing, and definitely have plenty of room to grow.
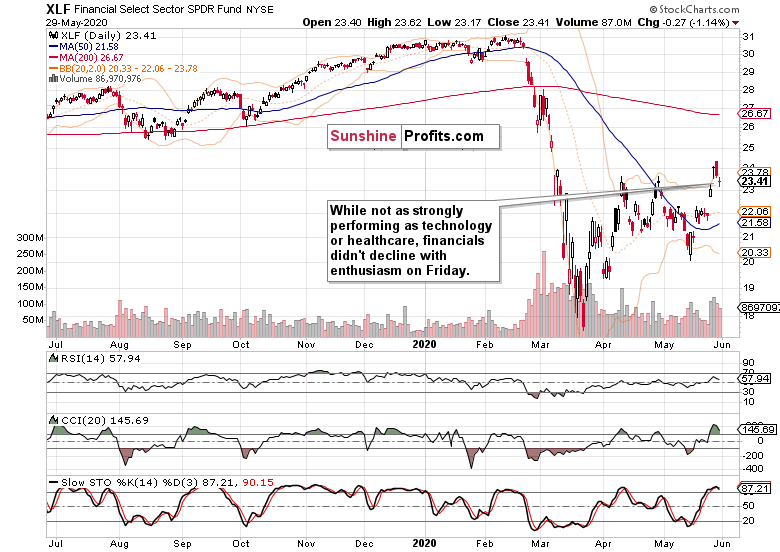
The price action in the financials (XLF ETF) also follows a bullish path. While their rebound off the March lows hasn't been as strong, they've made a solid progress in the last two weeks. Friday's breather didn't take them much lower during the day, and the daily indicators don't favor a sharp move lower. Conversely, the financials are likely to muddle through with a bullish bias over the coming weeks.
Over the last three sessions, both telecommunications (XTL ETF) and consumer discretionaries (XLY ETF) performed similarly strongly as technology did. These key S&P 500 sectors agree that higher stock prices are in our future.
It's only the leading ratios that haven't yet recovered from last week's setback. Both financials to utilities (XLF:XLU) and consumer discretionaries to staples (XLY:XLP) are pointing in the short-term direction of the amber light.
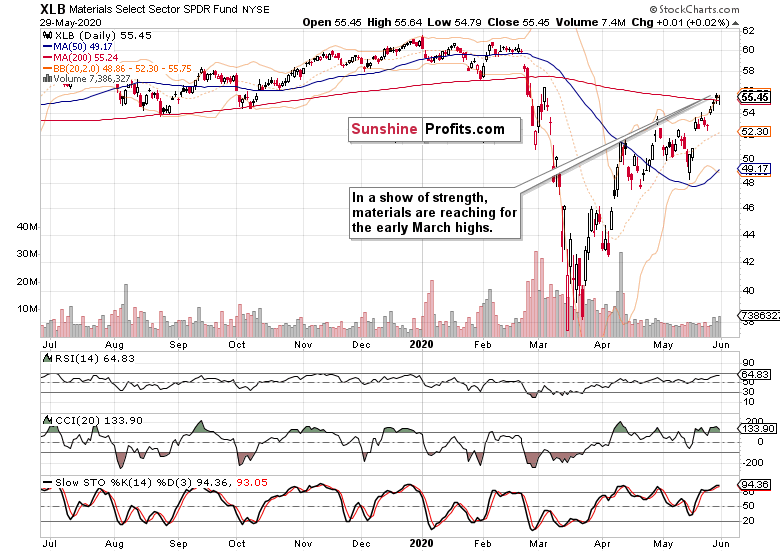
Positioned for more gains, materials (XLB ETF) have outperformed both energy (XLE ETF) and industrials (XLI ETF), leading the stealth stock bull market higher. One more argument for higher prices of materials, is the rangebound performance of the USD Index since late April.
Should the USDX really spike, that would be a meaningful fly in the ointment for many commodity prices. But after the March deflationary episode, the market is sensing inflation on the way, and that's already putting a floor below commodity prices. Remember, bonds peak first, then stocks, and finally commodities. And we haven't seen the peak in bonds yet, let alone in stocks.
Summary
Summing up, Thursday's late-day reversal was resolved with a no bombshell dropped by Trump during Friday's press conference. Stocks reversed higher after the first signs that the fears have been overblown. The week ended on a positive note, and the stock bull market remains intact. After closing the early March gap and overcoming the 200-day moving average, the next target for the buyers are the early March highs. While the credit market and sectoral analysis favor the stock upswing to go on, the continuing weak performance of the Russell 2000 (IWM ETF) is a short-term watchout, as it hasn't caught up as vigorously as the S&P 500 did on Friday. The balance of risks in the medium-term remains skewed to the upside, but I'm striking a bit cautious tone in the very short-term.
I still expect stocks to slowly grind higher overall despite the high likelihood of sideways-to-slightly-down trading over the summer - but we're nowhere near the start thereof. Right now, the breakout above the three key resistances (the 61.8% Fibonacci retracement, the upper border of the early March gap, and the 200-day moving average) is still unfolding with the bears running for cover and FOMO (fear of missing out) back in vogue. In short, the ball remains in the bulls' court to show us what they're made of. The weekly and monthly charts are also leaning in the bulls' favor.
If you enjoyed the above analysis and would like to receive daily premium follow-ups, we encourage you to sign up for our Stock Trading Alerts to also benefit from the trading action we describe - the moment it happens. The full analysis includes more details about our current positions and levels to watch before deciding to open any new ones or where to close existing ones.
Thank you.
Monica Kingsley
Stock Trading StrategistSunshine Profits: Analysis. Care. Profits. -
Stock Investment Update - The Bulls Took Over the Reins, Again
May 25, 2020, 8:30 AMWelcome to this week's Stock Investment Update. Its purpose is to lay out what has happened in the S&P 500 over the previous week, and examine the prospects of upcoming moves.
Stocks versus key resistances - that' how much of last week's trading could be characterized. Yet the bullish bias has been easily noticeable as prices kept making higher highs and higher lows on a daily basis. As a cherry on Friday's trading cake, the S&P 500 predictably shook off the Hong Kong-driven rise in US-China tensions. Will stocks confirm our analysis and break above the upper border of March's gap and the 61.8% Fibonacci retracement shortly?
Judging by the case we lay out next, it's probable.
S&P 500 in the Medium- and Short-Run
We'll start this week's flagship Stock Trading Alert with the weekly chart (charts courtesy of http://stockcharts.com ):
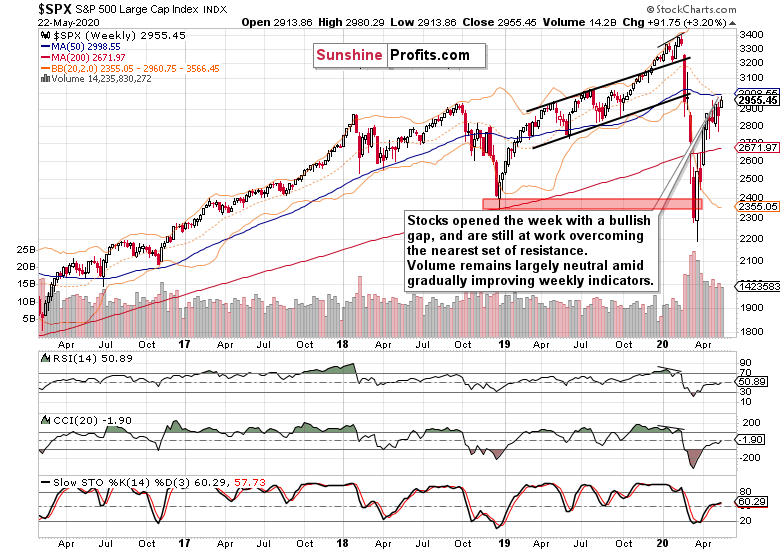
After last week's attempt to reverse to the downside, stocks continued to reject lower prices in Monday's premarket session, resulting in a bullish opening gap. And the S&P 500 hasn't really looked back since, moving two steps ahead, one step backwards throughout the week.
Knocking on the two key resistances reinforcing each other, it still managed to overcome the lower one, the 61.8% Fibonacci retracement. For how long will the upper one, the early March bearish gap stand?
While the weekly volume was largely neutral in its implications, the indicators don't stand in the way of further gains - but as they're not trending strongly either, we'll have to look for more clues on the daily chart.
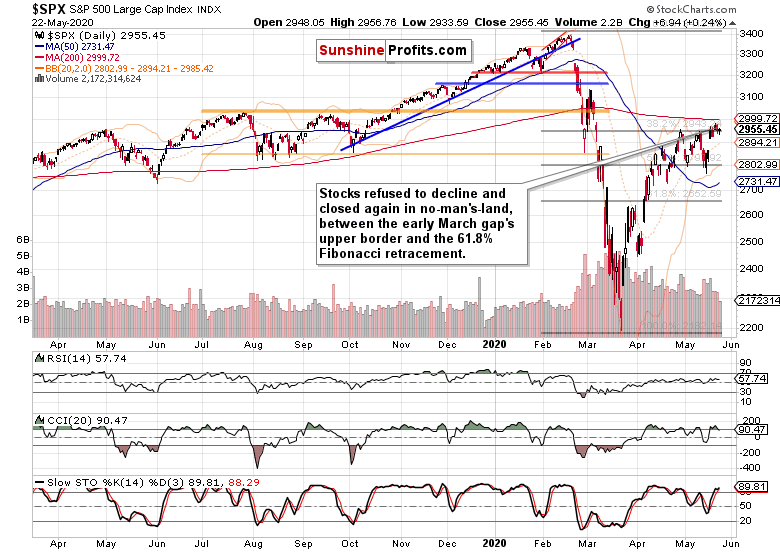
The daily chart clearly shows stocks cutting into the combined resistance posed by the early March gap and the 61.8% Fibonacci retracement. Friday's upswing means that the index finished the week back above the latter one.
This is what we've written in our Friday's Alert:
(...) this week's daily downswings were only able to achieve higher lows. It means that it's two steps forward, one step backwards for the stock bulls.
Apart from the Hong Kong jitters, there hasn't been any other catalyst or development that would prompt the markets to reassess the risks. While it's true that there needn't be a catalyst, the overnight move lower appears of limited shelf life. Flash in the pan, in other words. The chart posture remains bullish, and we see it likely that the buyers would take on the 200-day moving average (that's around 3000) before too long.
Yesterday's volume doesn't mark a reversal either, and the daily indicators keep supporting the unfolding upleg. When will more buyers jump onboard? Once they do, we expect FOMO (fear of missing out) to become dominant over the wait-and-see approach of this extended consolidation.
Yes, it proved to be a consolidation, because no matter how bearish or bullish the indications for a move either way, stocks kept frustrating both the buyers and sellers equally. As a rollover to the downside never came, the chart pressure to move higher keeps building with each passing day and week, in our opinion.
Friday's higher close happened on lower volume, and didn't affect the daily indicators greatly. Regardless, price risks continue being skewed to the upside.
Would the credit markets confirm our bullish take on stocks?
The Credit Markets' Point of View
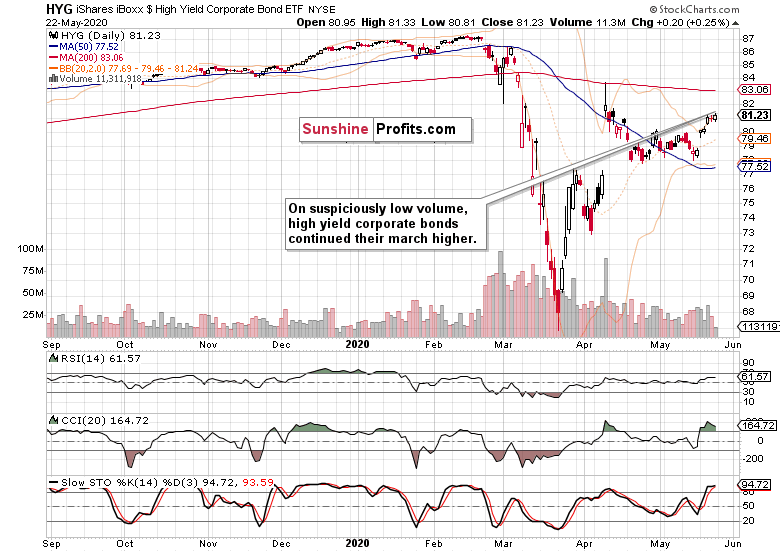
High yield corporate debt (HYG ETF) moved higher yesterday, but the daily volume is no reason to celebrate. Consolidation of recent sharp gains wouldn't come as a surprise, but this leading metric of credit market health is still primed to go higher and serve as a tailwind for stocks.
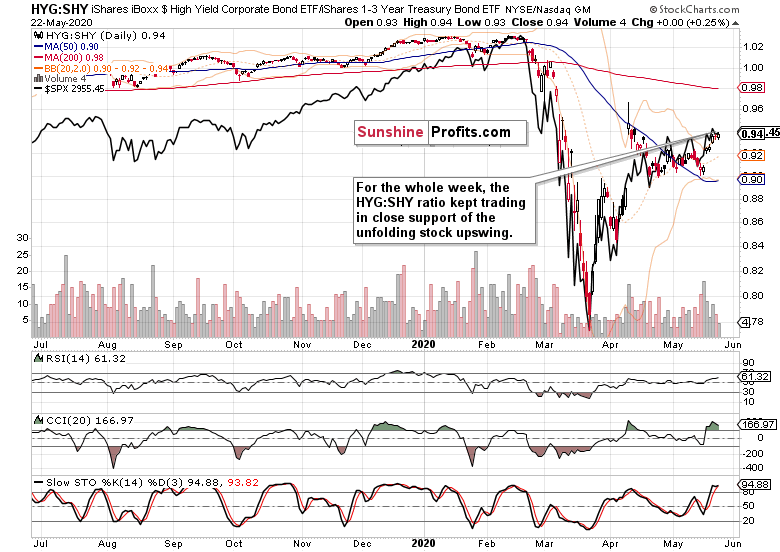
The moves in stocks and the high yield corporate bonds to short-term Treasuries ratio (HYG:SHY) continue to be moving in lockstep. Crucially for the stock bulls, this gauge of bullish spirits remains on their side.
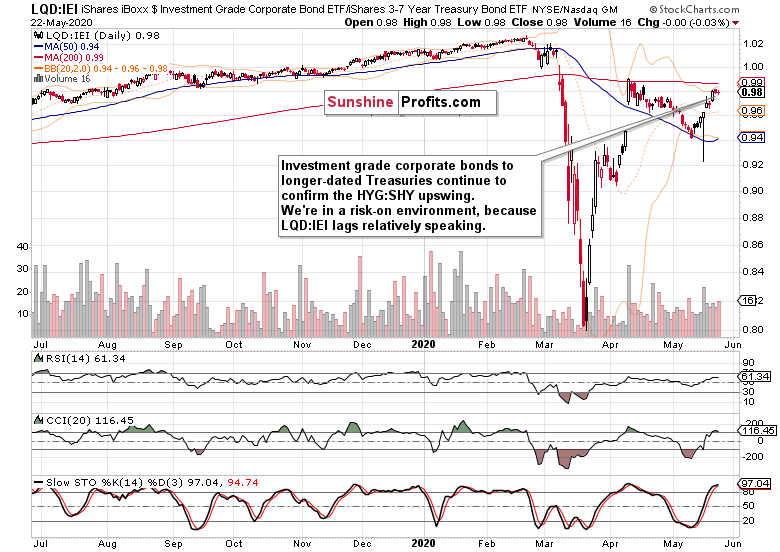
The same can be said about the ratio of investment grade corporate bonds to long-dated Treasuries (LQD:IEI). There is no divergence when compared to the previous HYG:SHY ratio.
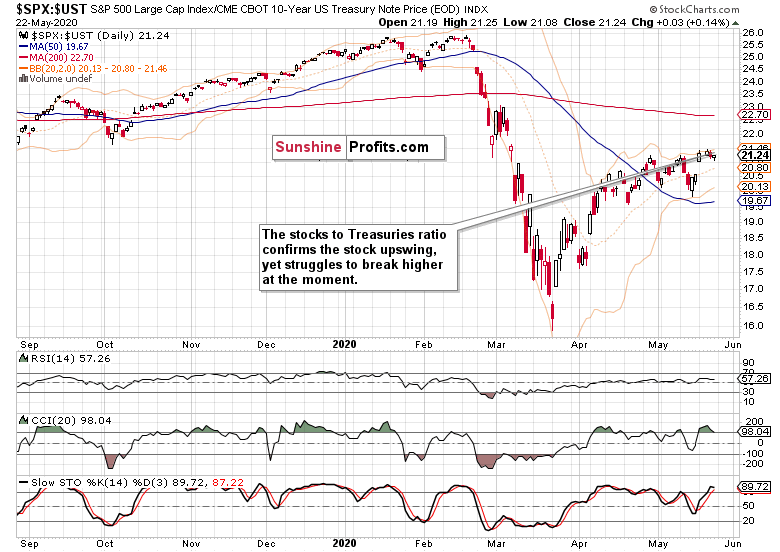
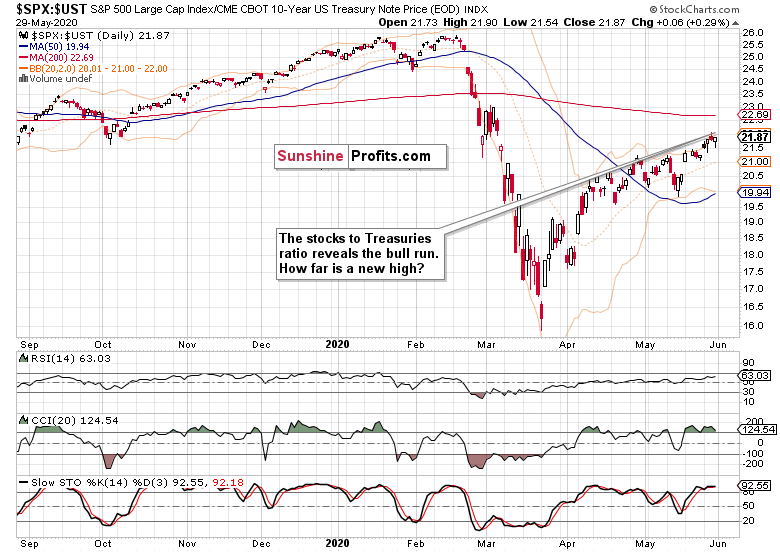
The ratio of stocks to Treasuries, the S&P 500 to 10-year Treasuries ratio (SPX:UST), paints the struggle of stocks to break higher. As it continues to trade within sight of recent highs amid still bullish indicators, it favors another S&P 500 upswing.
Key S&P 500 Sectors and Ratios in Focus
These were the thoughts we posted in the intraday Stock Trading Alert less than two hours before Friday's session close:
(...) While the S&P 500 didn't make much progress so far, it's the performance of high yield corporate bonds that supports more gains downs the road - and it doesn't all that much matter whether they come still today, or whether stocks catch up vigorously during Monday's premarket session / just thereafter.
The key development among the heavyweight sectors (tech, healthcare and financials) is that they're refusing to budge and decline today.
Let's examine their performance looking at the closing prices.
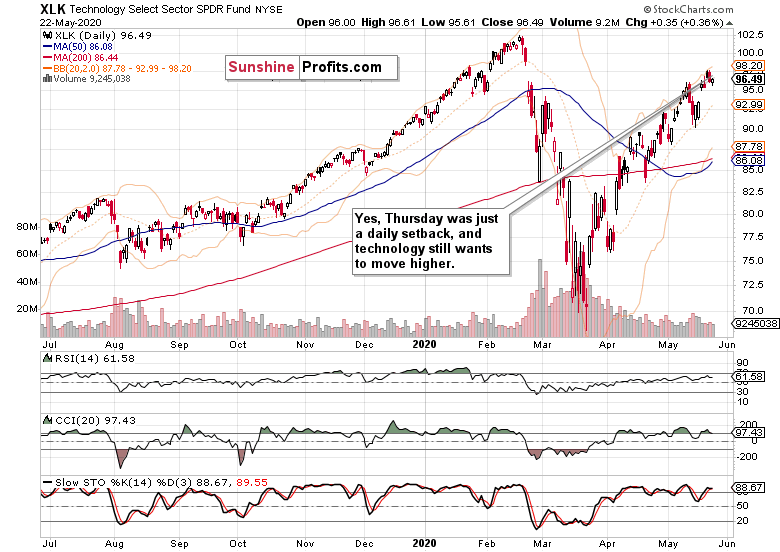
Indeed, technology (XLK ETF) refused to move lower, validating our earlier thoughts. It appears that a shallow correction is all there has been to it, and that the uptrend can go on and close the late February gap as it would challenge the February highs next.
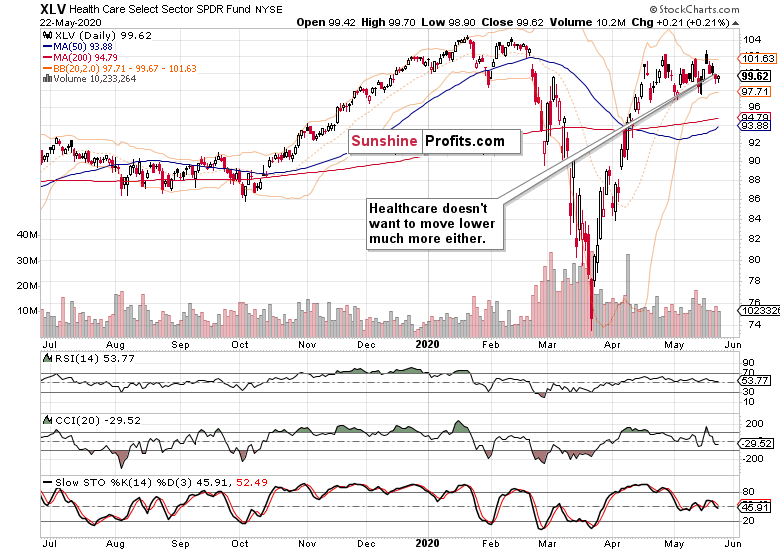
Healthcare (XLV ETF) also refused to sell off any deeper. Given the swing structure seen, we expect the sector to eventually break higher from its sideways trading range.
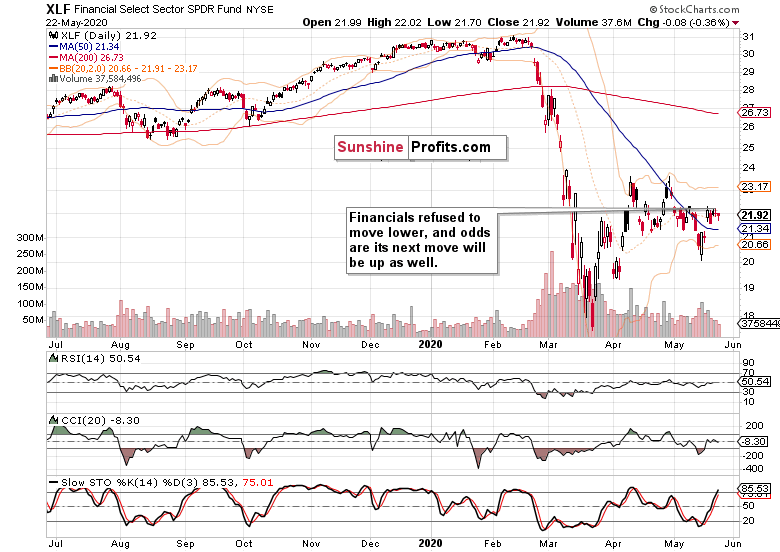
While the HYG ETF closed higher on Friday, financials (XLF ETF) merely refused to decline. Given the posture of the daily indicators and the low volume of Friday's trading, that's no cause for concern - while more sideways trading can go on in the short term, the sector remains likely to challenge its April highs and overcome them.
Once again, consumer discretionaries (XLY ETF) refused to move lower while the consumer staples (XLP ETF) slightly gained. However, the consumer discretionaries to staples ratio (XLY:XLP) continues to trade within spitting distance to its recent highs. These were our Thursday's thoughts about the move's importance as the ratio:
(...) is already trading well above its February highs. Given the degree of real economy destruction seen around, that's quite a signal this leading indicator is sending. The financials to utilities ratio (XLF:XLU) looks to have stabilized not too far from the declining resistance line connecting its mid-March and early-May intraday tops, and it's our opinion that it would go on to break higher.
The XLF:XLU ratio erased its intraday decline on Friday, and continues to trade sideways for now. While it didn't break above the declining resistance line yet, we expect it to overcome it eventually.
As for the stealth bull market trio, all three - energy (XLE ETF), materials (XLB ETF) and industrials (XLI ETF) - refused to decline any more intraday. And the sellers weren't really on the trading floor as it didn't take much buying power to rebuff the meek attempt. While that's a bullish sign in general, let's explore specifically sector-by-sector.
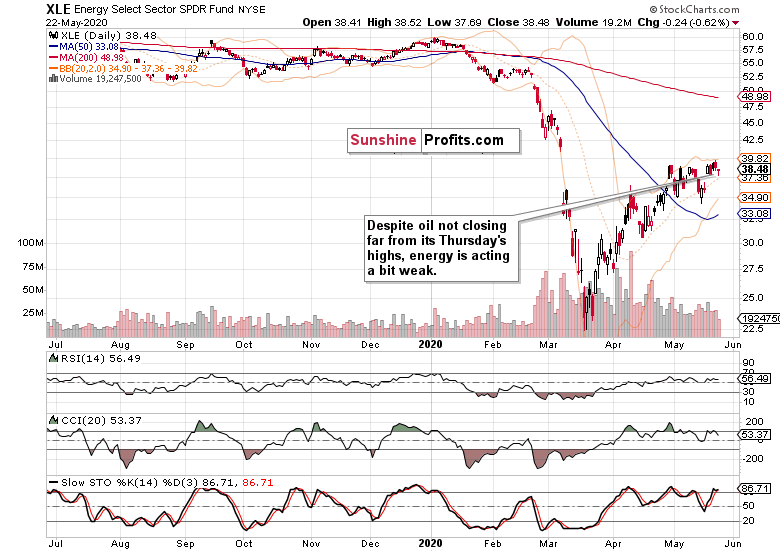
Looking at the closing prices only, energy suffered a daily setback. But it is far from rolling over to the downside, and we expect it to keep on consolidating with a bullish bias.
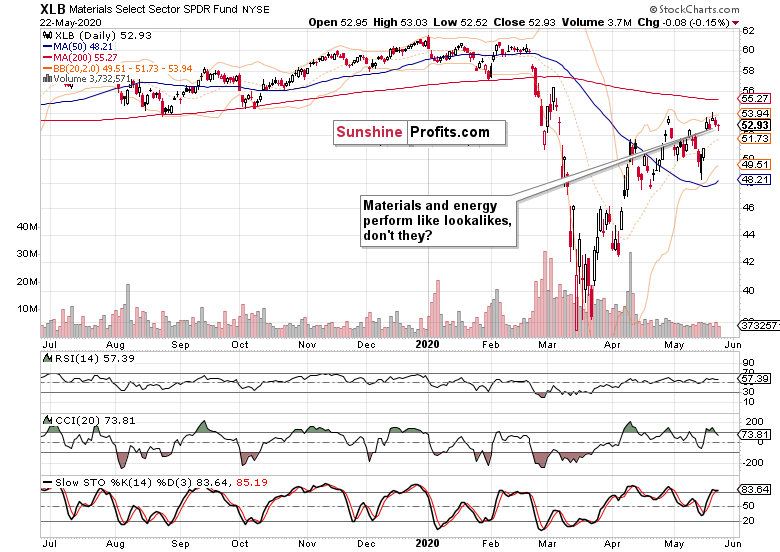
The materials' chart is in a stronger technical posture, having come closer to its all-time highs, and having closed the early March gap already. It certainly appears more gains are on the horizon - especially considering the low volume of Friday's downswing.
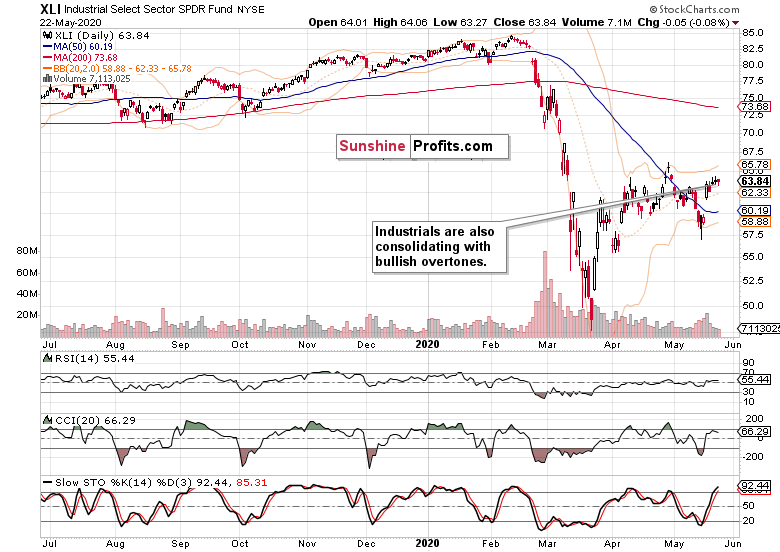
It's also among the industrials that we see base building for an eventual launch higher. Yes, that's keeps being true despite the lower low made recently in this sector, or retesting it in materials - an overshoot can come before the market moves in its true direction. And just as with the S&P 500 breaking below the 50% Fibonacci retracement not too long ago, we see that in the stealth bull trio too.
Summary
Summing up, Thursday's decline didn't land in good company of Friday as stocks refused to decline, and actually reverted back above the 61.8% Fibonacci retracement. Another attempt to close the early March gap is supported by the daily indicators, and we expect stocks to break above both formidable resistances on a lasting basis. Both the credit market and sectoral strength examination favor this conclusion. Thereafter, the bulls would target the 200-day moving average at around 3000. That's for starters, as we expect to slowly grind higher overall despite the high likelihood of sideways-to-slightly-down trading over the summer. But before that, the ball remains in the bulls' court.
If you enjoyed the above analysis and would like to receive daily premium follow-ups, we encourage you to sign up for our Stock Trading Alerts to also benefit from the trading action we describe - the moment it happens. The full analysis includes more details about our current positions and levels to watch before deciding to open any new ones or where to close existing ones.
Thank you.
Monica Kingsley
Stock Trading Strategist
Sunshine Profits - Effective Investments through Diligence and Care -
Stock Investment Update - It's the Credit Markets Vs. the S&P 500 Upswing Now
May 18, 2020, 11:57 AMWelcome to this week's Stock Investment Update. Its purpose is to lay out what has happened in the S&P 500 over the previous week, and examine the prospects of upcoming moves.
Neither on Thursday, nor on Friday did the bears manage to break below the 50% Fibonacci retracement. Stocks rebounded, albeit less convincingly than on Thursday. Or was it convincing enough? Let's examine both sides of the story to assess whether it's the bulls or bears that are holding the upper hand now.
S&P 500 in the Medium- and Short-Run
We'll start this week's flagship Stock Trading Alert with the weekly chart (charts courtesy of http://stockcharts.com ):
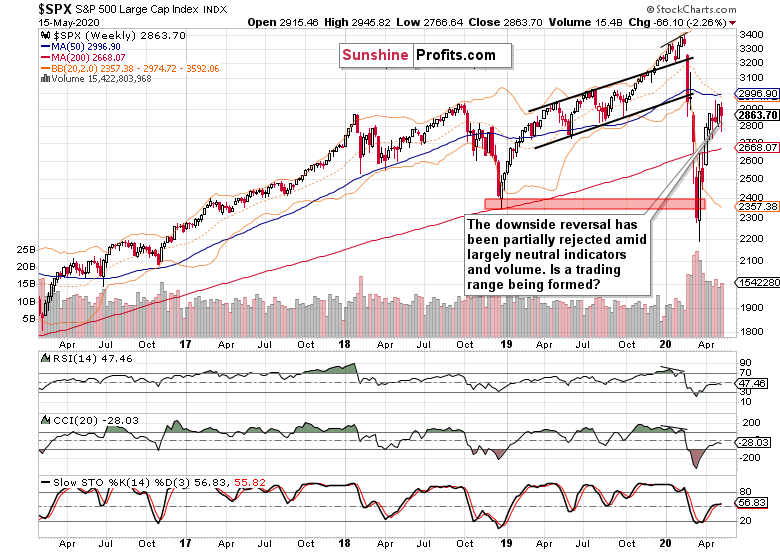
The bulls opened the week, making another run at the 61.8% Fibonacci retracement. Late on Tuesday, the Fed made several pronouncement that were not really surprising, but they still served to take the wind off the bulls' sails. Namely, it was stated that more fiscal stimulus might be necessary, and that the virus needs to get under control so as to fix the economy. On Wednesday, Powell echoed these kind-of-obvious positions, and stocks sold off to the 50% Fibonacci retracement. On Thursday, they declined on another 3,000K unemployment claims data, yet reversed later in the day. Friday brought us renewed US-China tensions and terrible retail sales figures, which took stocks lower again - yet they recovered in the latter half of the session.
As a result, the weekly candle bears a red body that marks the decline, and a sizable lower knot denoting last two days' recovery. Neither the weekly volume nor the weekly indicators stand out in any way. Are stocks likely to go on grinding slowly higher, or will the bears try luck again with another downswing attempt?
Let's see the daily charts for more details.
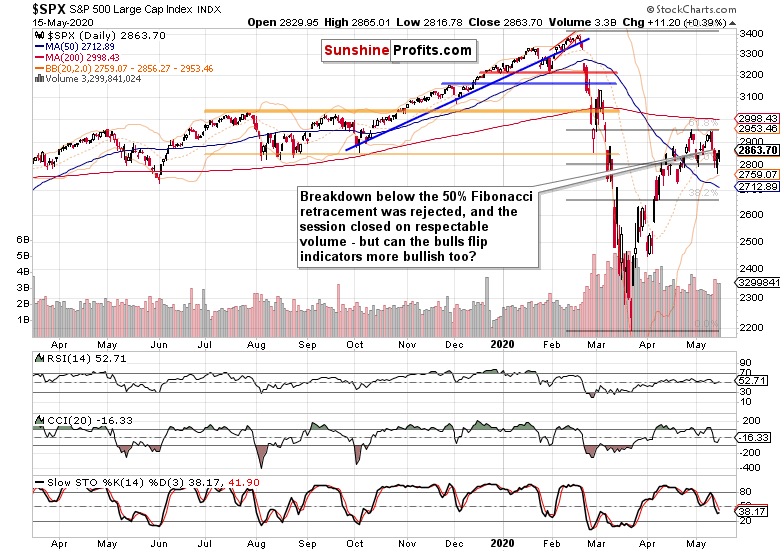
Trading around the 50% Fibonacci retracement attracted relatively more volume than the breakout attempt above the 61.8% one. As the buyers are certainly becoming more active around the 2800 area, is it likely to hold another selling wave should it come? And how likely will it come?
Well, the daily indicators aren't exactly on their buy signals just yet - Stochastics is still on a sell signal, while CCI has ticked higher before reaching the -100 area and RSI is fairly neutral.
Let's dig a bit deeper into Friday's events and paint a picture of what's to come early this week. While the Democrat-proposed $3T bill is dead on arrival, it's fairly obvious there would be a new fiscal stimulus - however, it hasn't materialized yet even as an outline. Then, after backlash against the implied cure-all coronavirus vaccine position, Trump flip-flopped to say that the virus would just go away at some point, all by itself - which seems to have helped with Friday's modest upswing.
On Tuesday, we'll hear Powell's testimony - and after last week's reaction to the cautious tone struck, the risks of another selloff are there. It can't be denied that the authorities have managed to paper over the problem, but is the consumer and small business sector coming back? We're of the opinion that the nearest months will show the veracity of the rebound, and we suspect that a very wide-stretched U-shaped real economy recovery would actually be the optimistic scenario here.
These weeks, the market will likely remain in a wait-and-see mode, reluctant to make a sizable move either way. But what if the risks were skewed rather to the downside in the very near-term? Coming back to the Fed, it's likely - after moving decisively in late March and early April, their Treasury/mortgage-backed securities purchases keep being low. That's one key buyers less. What would be a better excuse to ramp up the printing presses than another slide in the markets?
In other words, it's unlikely that Powell, after putting pressure on the executive branch to act, would bring the punch bowl to the Senate hearing. This makes it likely that the market would need to spook the Fed into action first.
Do we find support for the above theory in the credit markets?
The Credit Markets' Point of View
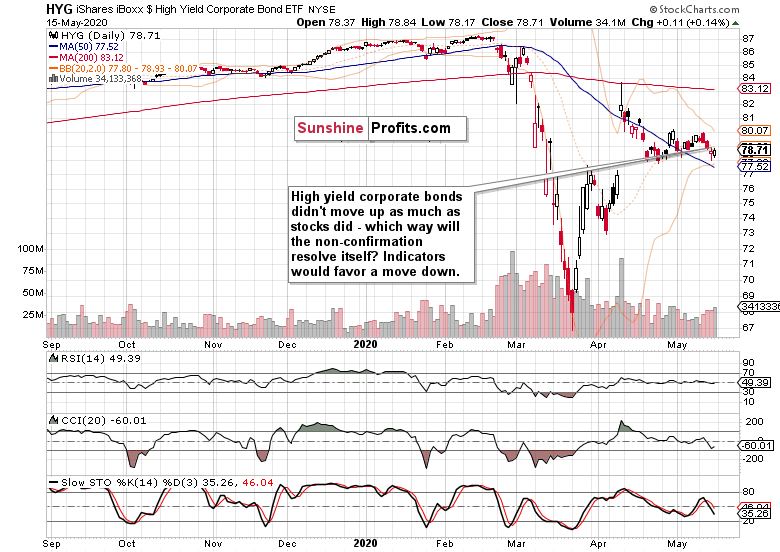
High yield corporate debt (HYG ETF) didn't really rebound either on Thursday or on Friday. That's a sign of non-confirmation of the stock upswing.
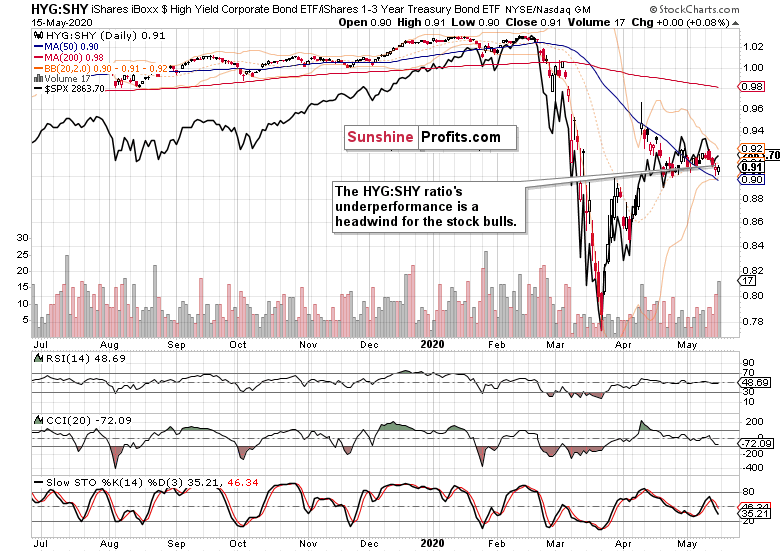
The high yield corporate bonds to short-term Treasuries ratio (HYG:SHY) also keeps underperforming. Just as we wrote on Thursday, this ratio is well positioned to exert downside pressure on the overlaid S&P 500 chart (the black line), even after Friday's modest move higher.
Fundamentally speaking, that's what one can expect when Fed's firepower isn't really there at the moment. This is why another attempt to move lower in stocks, is likely.
Key S&P 500 Sectors and Ratios in Focus
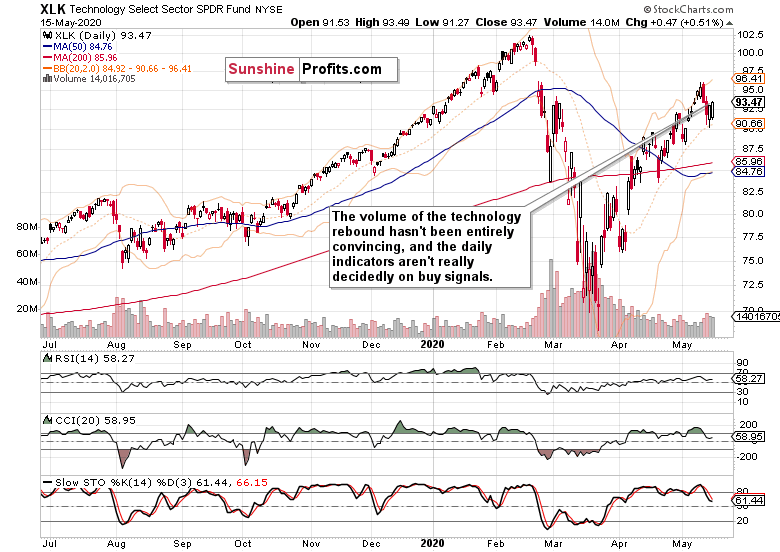
Sure, technology (XLK ETF) rebounded on encouraging volume, but the technical picture isn't fully convincing. The daily indicators still aren't on their buy signals, and while the sector keeps making higher highs and higher lows, last two days' rebound appears extended and consolidation with a downside bias isn't out of the question.
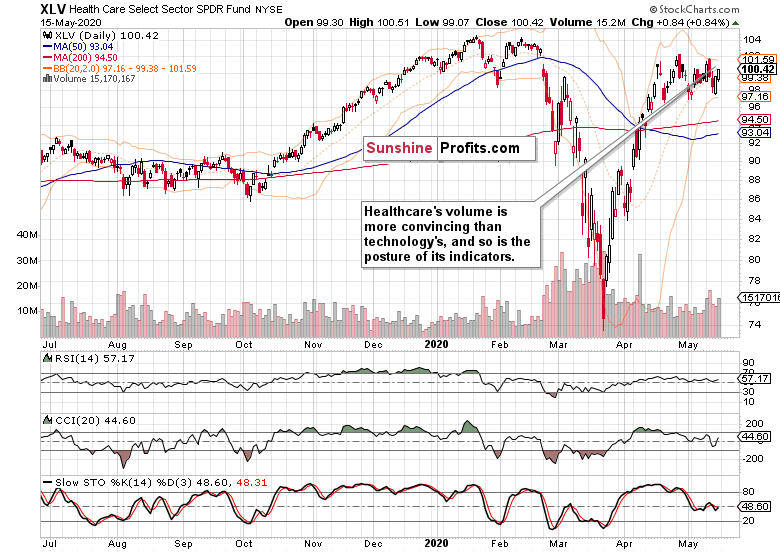
Healthcare's (XLV ETF) price action looks more favorable to the bulls, especially since Friday's volume overcame that of the Wednesday's downswing. Unlike tech, the sector didn't open near its Thursday's starting prices. But can it keep pulling the S&P 500 higher?
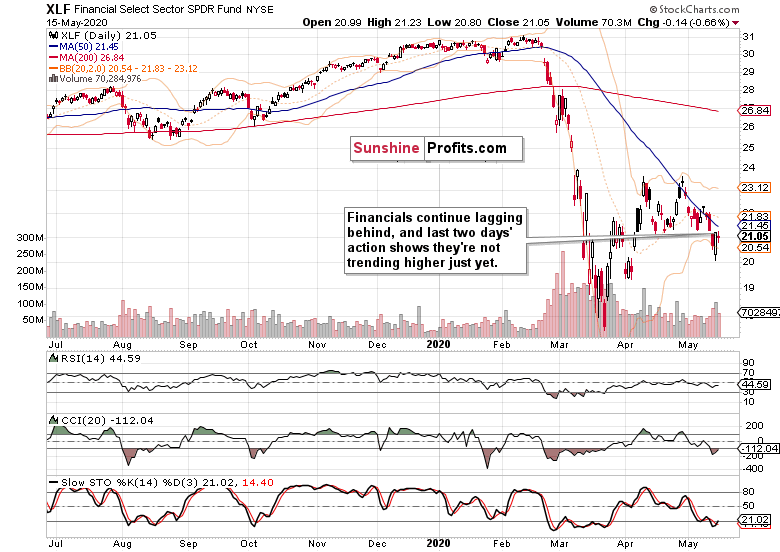
Financials (XLF ETF) continue underperforming, and despite erasing Wednesday's plunge, they're not trending higher. They reflect the weak performance of the credit markets, which doesn't bode well for the advancing index as such.
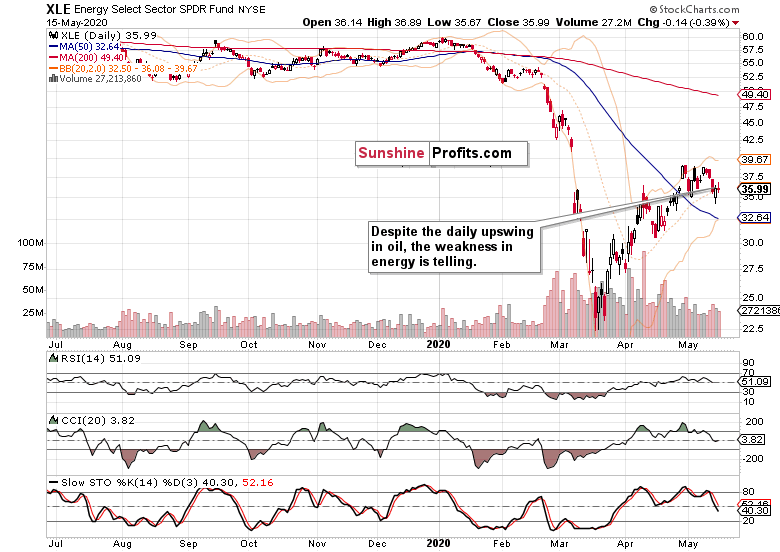
Energy (XLE ETF) is taking a breather, and has issues moving higher regardless of the oil price recovery. As the volume also leaves quite something to be desired, the short-term risks appear skewed to the downside.
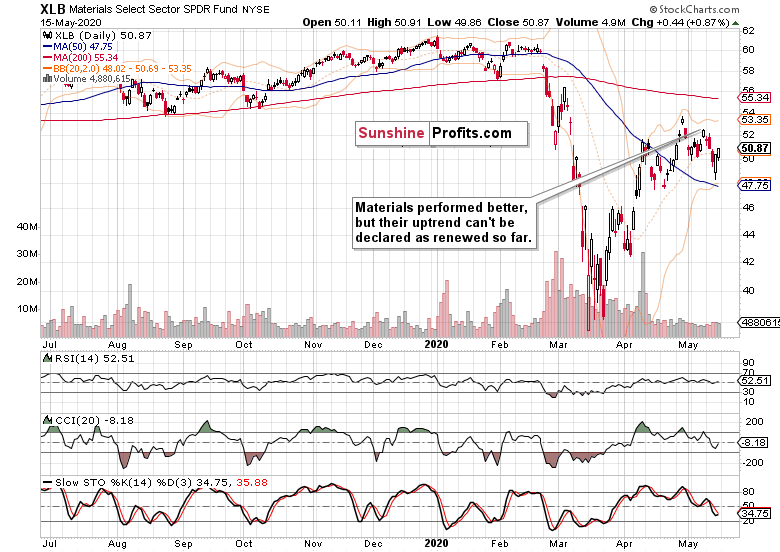
However, that's not true to such an extent in materials (XLB ETF). On one hand, they rejected the lower low and sprang higher, but the daily indicators and volume aren't yet on the side of the bulls. While that may change later this week, we're not there yet, and consolidation over the nearest sessions remains the most likely scenario.
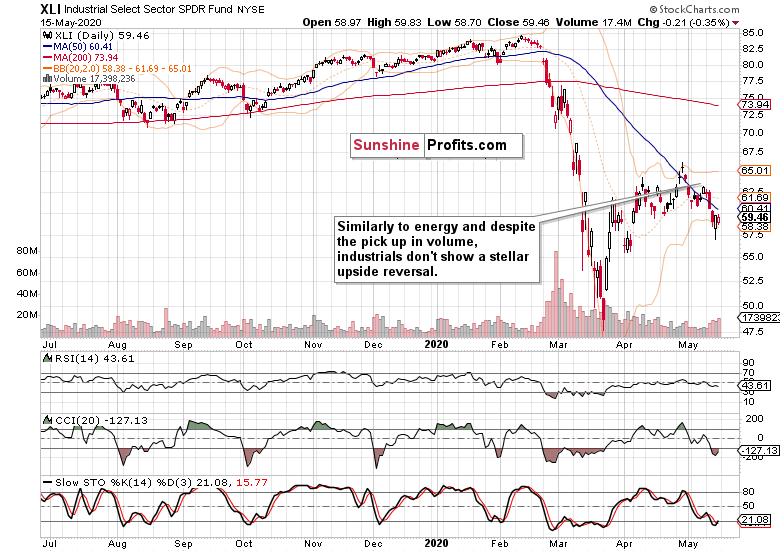
The last of the stealth bull market trio, the industrials (XLI ETF) performed as feebly as energy did. It's a safe bet to say that these three sectors haven't exactly assumed leadership in the S&P 500 rebound, making it more likely that the stock bulls will get again tested this week.
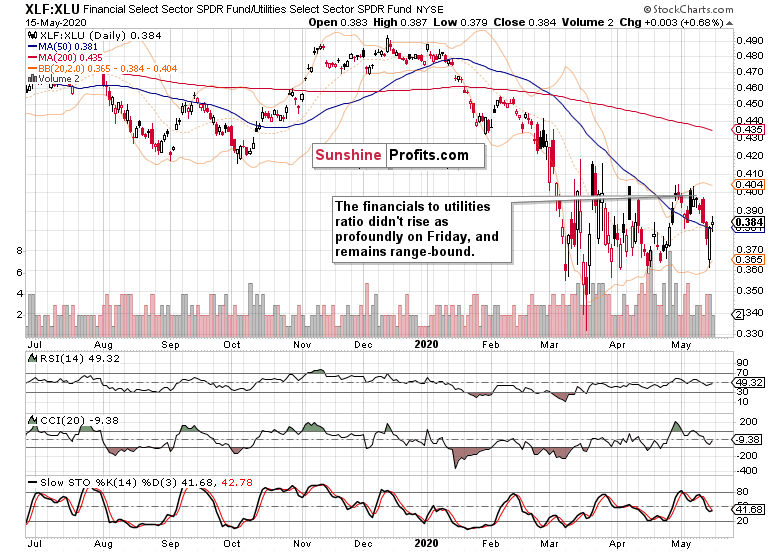
The financials to utilities ratio (XLF:XLU) still doesn't act bullish - the sideways action would favor consolidation in this relatively broad sideways trading range (2800 to 2940) in the S&P 500 - still within the lower half of that spectrum for now.
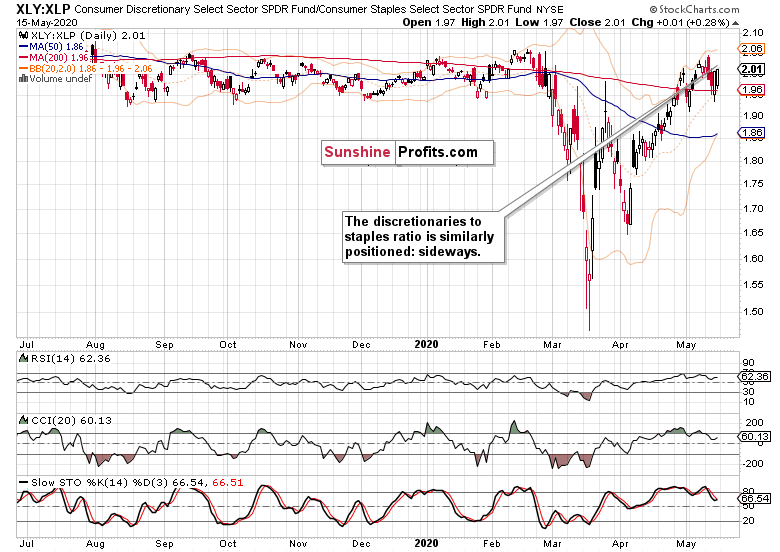
Similarly, the consumer discretionaries to consumer staples ratio (XLY:XLP) is consolidating. It means that it's not giving clear signs of the upcoming directional move in stocks.
The Fundamental S&P 500 Outlook
As the coronavirus infection charts appear to have relatively stabilized, and the Fed offered ample support at a critical juncture, the stock market hasn't sold off in a dramatic way since. Moving from the March 23 lows to the 50% Fibonacci retracement, it has overcome this resistance and taken twice on the 61.8% one. Last week, the 50% retracement held as support.
The above paragraph would speak in favor of a near-term trading range between the two retracements. But would that mean that no selloff below the lower one can happen? Absolutely not, the 2720 or even the low 2600s can get tested. And that needn't to happen on very adverse corona-related developments. Faced with incoming data, the market can start to doubt whether we're within sight / we've reached the bottom and the real economy is on the mend now. Continuing unemployment claims, retail data, manufacturing figures and similar would show. Or escalation in US-China trade tensions can drive the stock selloff similarly to the way it did early on Friday. Or the Fed playing the monetary interventions on-off game, can work to similar effect.
Still, having gone as high from the low 2200s, the risk of retest or breakdown below these lows, isn't there at the moment. Not with all the implicit and explicit Fed support, the many fiscal stimulus measures, and crucially, not unless corona goes from we-have-flattened-the-curve to oh-it's-exponential-again. Despite the relative complacency and the dangers it brings, we're still far from the market pressing the panic button.
Reaching 2800, 2720 or the low 2600s wouldn't count as panic. Considering this year's swings, a move to these levels (especially the first two, but there's potential for an overshoot to the 2600s) would constitute a relatively shallow correction, after which a slow grind higher could go on (barring catastrophic corona developments). After all, we're in an election year.
What to do about the current S&P 500 pricing, what actions to take? For all the above-mentioned reasons (namely the credit-related ones), we're expecting a push lower in stocks to happen most likely over this week, and in all likelihood still within May. With breakouts and breakdowns having failed recently (bringing about no directional move or momentum to trade), the choice of opportune entry and exit points is rising in importance.
Summary
Summing up, despite the bullish finish to Friday's trading, the buyers don't have yet the indicators on their side. Weekly ones including volume are mostly neutral, while the daily ones remain vulnerable to a downside move. As the credit markets portend, the stock upswing appears to have gotten a bit ahead of itself, and Tuesday's Powell testimony coupled with yet another reduction in Fed's purchases starting today, are likely to be the catalyst of renewed selling. Delivered with a sober assessment of the real economy prospects and uncertainties (yes, the Q2 Fed-projected GDP drop is now 35%), it could drive stocks back to the 2800s, and the HYG ETF breaking below the late April lows. This would strengthen the bearish case for stocks in the near term - just as the US-China trade tensions or anchoring the reopening rebound expectations do.
If you enjoyed the above analysis and would like to receive daily premium follow-ups, we encourage you to sign up for our Stock Trading Alerts to also benefit from the trading action we describe - the moment it happens. The full analysis includes more details about our current positions and levels to watch before deciding to open any new ones or where to close existing ones.
Thank you for reading today's free analysis that offers you a full peek under the hood of what subscribers enjoy (except for the outlook as concerns various investment horizons). If you'd like to supplement the above with details regarding the details of our current trading positions (and the upcoming ones), or the targets of the upcoming sizable moves in the S&P 500 for that matter, we encourage you to subscribe to our Stock Trading Alerts. You might also be interested in our new service - weekly Stock Investment Updates, which we have recently introduced, and which we provide at promotional terms. Try them out today.
Thank you.
Monica Kingsley
Stock Trading Strategist
Sunshine Profits - Effective Investments through Diligence and Care -
Stock Investment Update - S&P 500 Bulls Again At Resistance - Now What
May 11, 2020, 10:34 AMWelcome to this week's Stock Investment Update. Its purpose is to lay out what has happened in the S&P 500 over the previous week, and examine the prospects of upcoming moves.
Friday's key data point were the non-farm payrolls. Horrendous and coming in at minus 20,500K, they surprised on the upside. After their release, stocks continued adding to their overnight gains, closing at the 61.8% Fibonacci retracement. Our previous bullish points turned out correct, but the key question is how strong is this rally? Can it power through this key resistance that is reinforced by the early March bearish gap?
S&P 500 in the Medium- and Short-Run
We'll start this week's flagship Stock Trading Alert with the weekly chart (charts courtesy of http://stockcharts.com ):
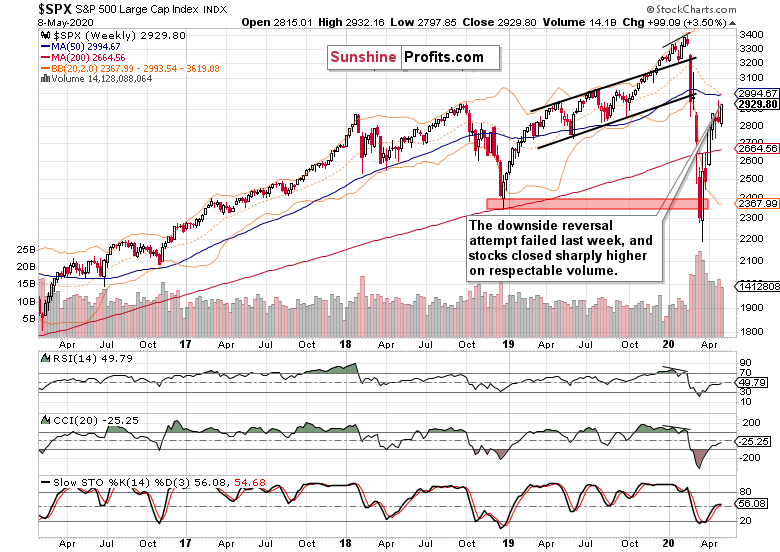
Stocks entered last week's trading on a weak note, extending previous Friday's losses in the overnight session to reach the 50% Fibonacci retracement. As Monday progressed however, the bulls cleared off the proximity of this support. The downswing attempt failed, and stocks closed sharply higher last week.
Yes, the weekly indicators are getting tired, but they are still far from flashing sell signals. Importantly, the weekly volume doesn't show increasing commitment of the sellers, and accounting for the upside momentum, it doesn't stand in the way of further gains. Apart from the below-mentioned resistances, the 50-week moving average is nearby - can the bulls make it there?
Let's finetune the perspective on the daily chart.
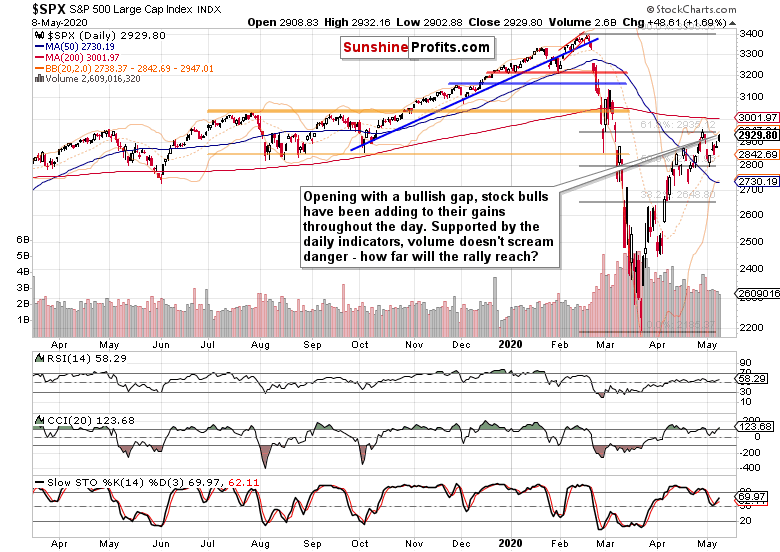
S&P 500 opened on Friday with another bullish gap, and the uptrend continued throughout the day. The daily indicators are still constructively positioned, and the volume is just about right for an upswing. As the stock bulls closed the day at the 61.8% Fibonacci retracement, how strongly positioned are they to overcome the resistance where they failed not too long ago?
These were our Friday's thoughts regarding the anticipated reaction to the non-farm payrolls:
(...) The point is that stocks have risen like phoenix from the ashes, and continue taking bad news in their stride. That's what bull markets do, by the way.
Knowing that this hypothesis will be put to test over the coming weeks, let's dive into the credit markets.
The Credit Markets' Point of View
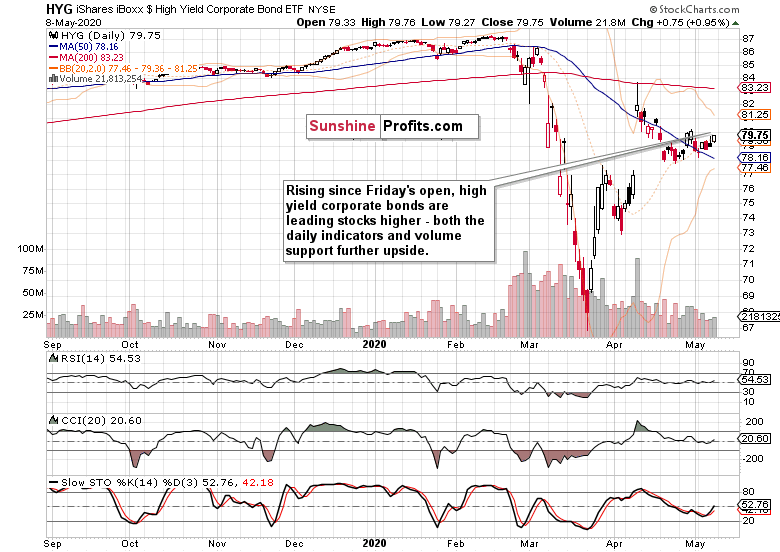
Opening with a bullish gap, high yield corporate debt (HYG ETF) continued leading stocks higher throughout the day. With its late April highs in sight, the daily indicators are in favor of the debt ETF's upswing to continue. The rising volume coupled with the daily upswing attests to the increasing involvement of the bulls. In short, more upside appears to be the path of least resistance.
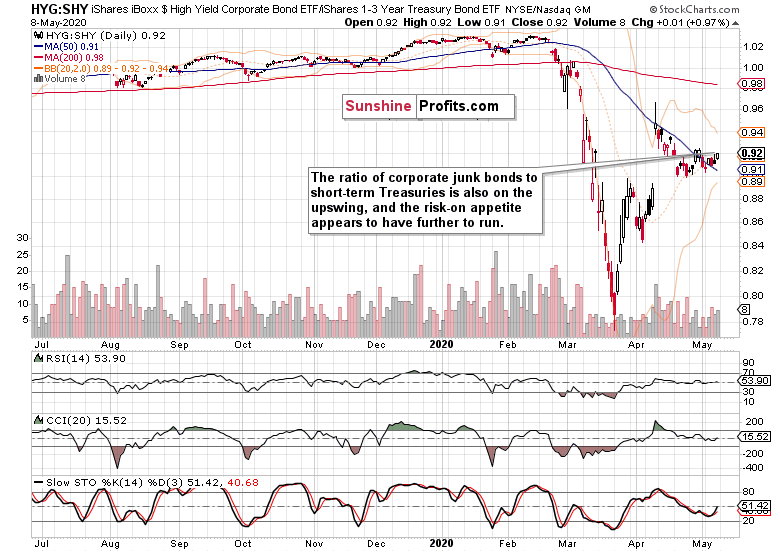
The ratio of junk corporate bonds to short-dated Treasuries (HYG:SHY) is also rising. Again, this shows that stocks are well-bid, and bullish spirits are just there at the moment. In other words, we're rather in the risk-on than the risk-off environment.
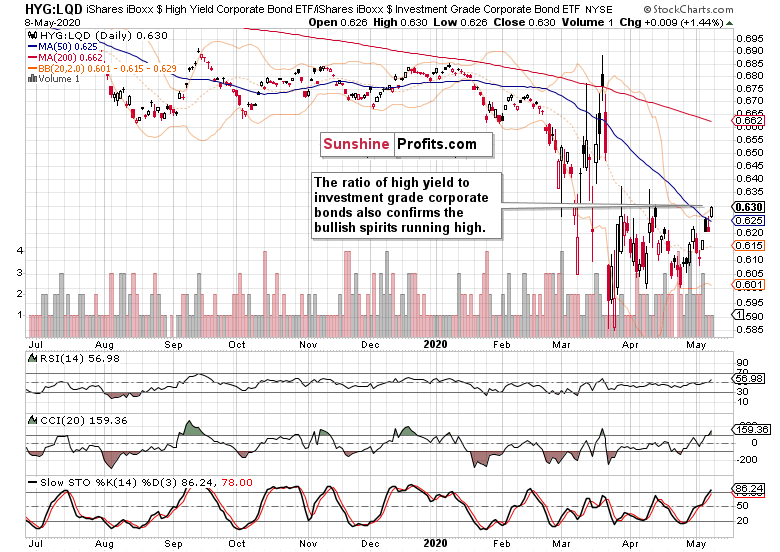
The ratio of high yield corporate bonds to investment grade corporate bonds (HYG:LQD) also supports the above assessment.
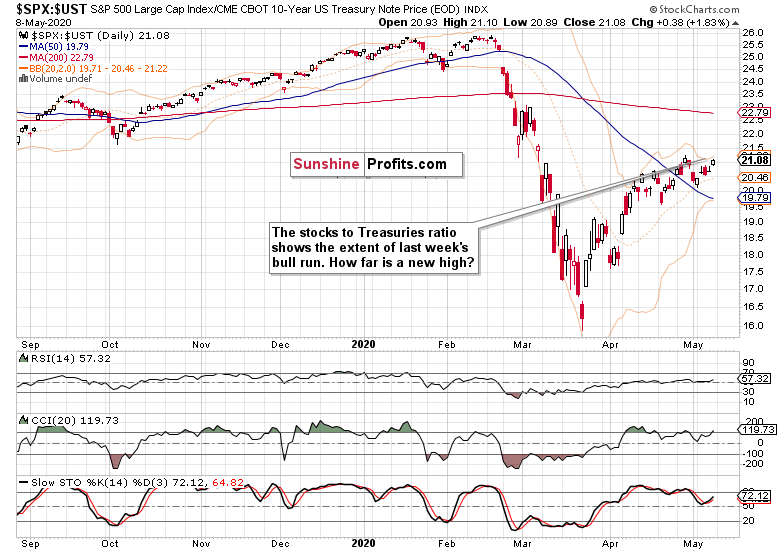
As for the stock market to Treasuries ratio, this metric also reflects the stock upswing. Will it be able to overcome the late April highs? Judged by the credit markets' performance, it's not out of the question.
Let's check the key S&P 500 sectors and their ratios - do they agree?
Key S&P 500 Sectors and Ratios in Focus
For the fourth consecutive day, the tech sector opened with a bullish gap on Friday. Adding to its opening gains, this leading sector closed solidly up. A word of caution though - while it's reaching a new highs, Friday's daily volume could have been higher. As a result, digesting recent gains wouldn't suprise us in the very short-term.
Despite the risks being still skewed to the upside, let's remember no market goes up or down in a straight line.
Let's quote our Friday's observations as they're still valid today:
(...) Healthcare (XLV ETF) isn't performing as strongly, but it isn't breaking down either. The sector appears just consolidating. Should we see higher volume with yesterday's candle, that would be bearish - but it wasn't there. Thus, consolidation appears to be the most probable scenario here.
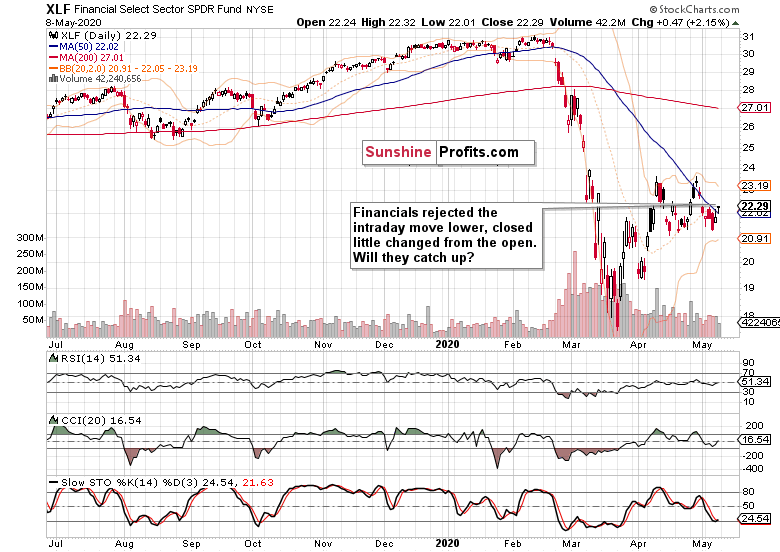
Helped by the rising HYG ETF, financials (XLF ETF) rose on Friday. First though, they had to repel the selling pressure - they did, and closed almost unchanged from their opening prices. It must be said that their performance could have been stronger, but they aren't moving in perfect daily synchro with the debt markets.
The question is whether they'll catch up over the coming sessions. Despite the lower daily volume, they can still do that - in late April, we've seen similarly low volume coupled with trading not too far from the swing lows, resolved with an upswing.
Let's move on to the stealth bull market trio of sectors (energy, materials and industrials). Can it be said they're leading higher?
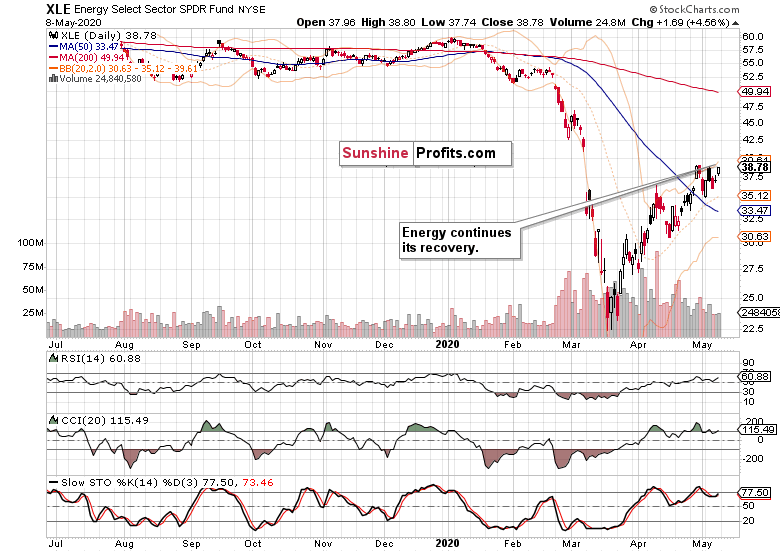
While oil didn't travel far since Wednesday, the energy sector (XLE ETF) recorded gains over the same period. That's encouraging, but it hasn't yet overcome its late April highs. As it's positioned favorably to take on them, will the upswing attempt be supported by the other two sectors?
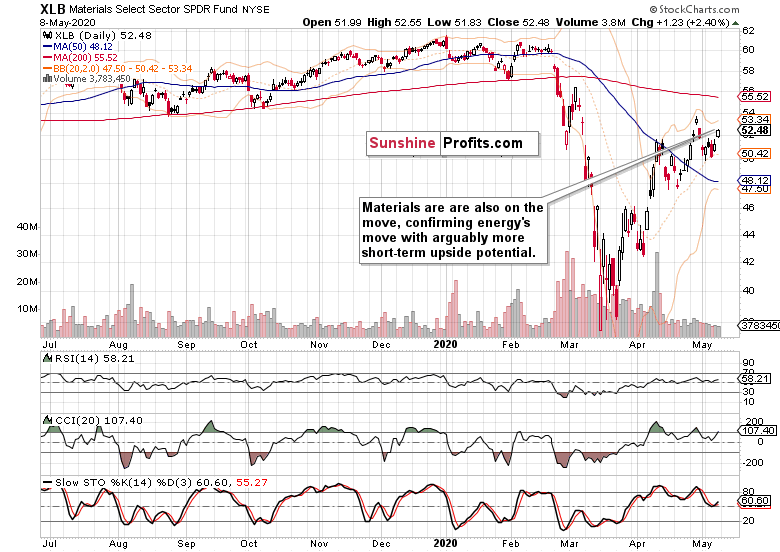
While materials (XLB ETF) also acted strongly on the day, they're trading below the late April highs. Similarly to financials, there is some catching up to do if the stock bulls aim to move higher still.
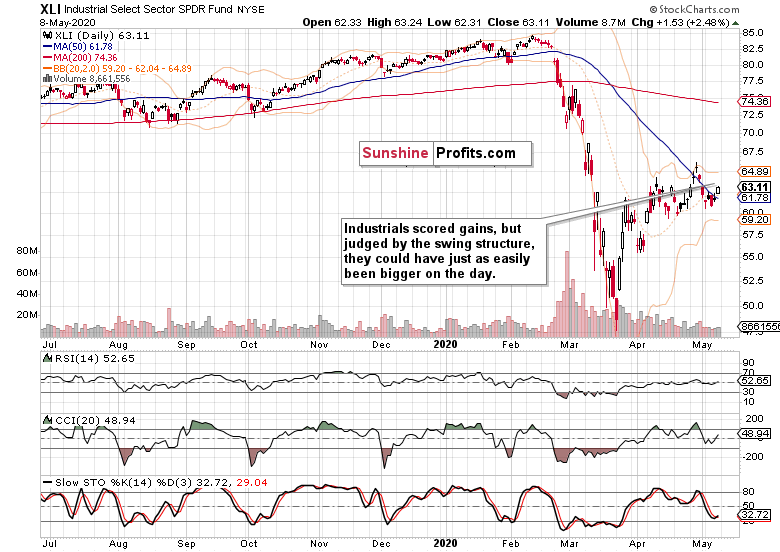
Virtually the same notes apply to industrials (XLI ETF) as well. As a result, unless these three early bull market sectors keep overcoming their Friday's highs, the S&P 500 is likely to consolidate its recent gains in the short term.
Do the leading ratios support the cautious tone?
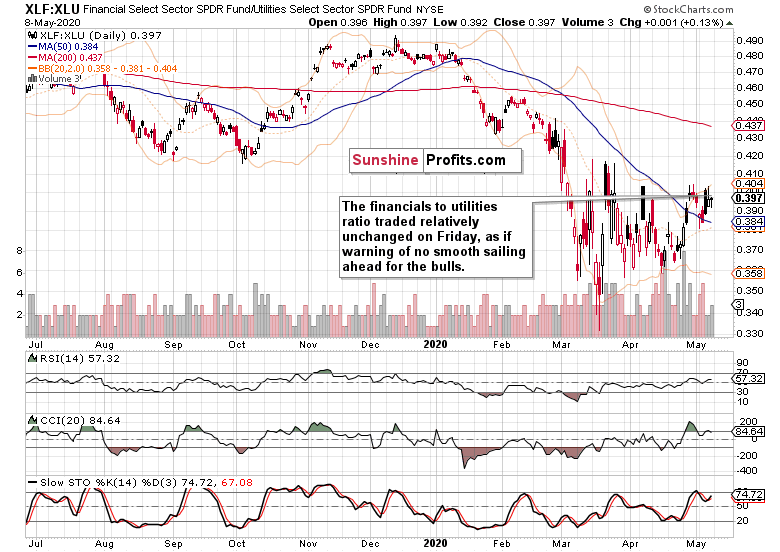
Considering Friday's strong gains in the index, the financials to utilities ratio (XLF:XLU) could have moved higher. Once it does, the stock advance would be driven more by the risk-on sectors.
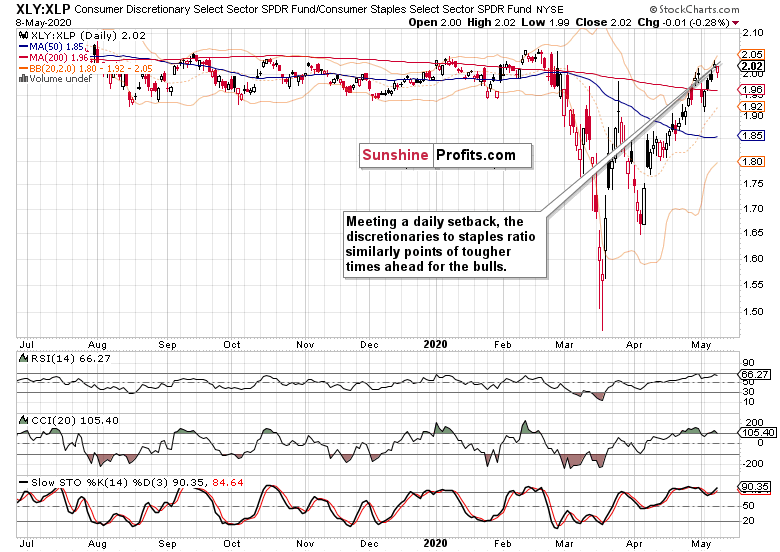
The consumer staples to discretionaries ratio (XLY:XLP) could have also performed stronger on Friday, given the stock upswing. Both of these charts reveal a certain rotation in the S&P 500 - just like the strong performance of defensive tech stocks such as Apple (AAPL) or Microsoft (MSFT) does. Considering that the XLY:XLP ratio has made it back to its February levels already, some back-and-forth moves aren't (and wouldn't be) too surprising.
Briefly said, a short-term consolidation of recent gains would be favored by both sectoral ratios. And what about other metrics?
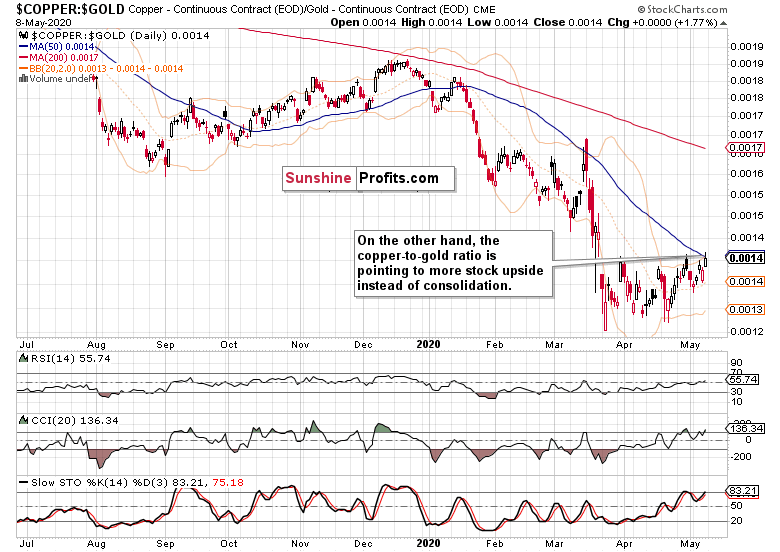
The copper to gold ratio would favor continued stock upside in place of consolidation or downswing. It carries no screaming sell implication just yet. Should it keep trading higher, it would actually help drive materials (and by extension also industrials and energy) up over the coming sessions.
That would be the key element if this S&P 500 rally is to go on. The broader the advance, the better for the prospects of further gains. When we see warning signs of more than a few sectors rolling over to the downside, we would know that the whole index would roll over eventually as well - and sooner rather than later.
With the above in mind, let's overlay the S&P 500 moves with the key smallcap index, the Russell 2000.
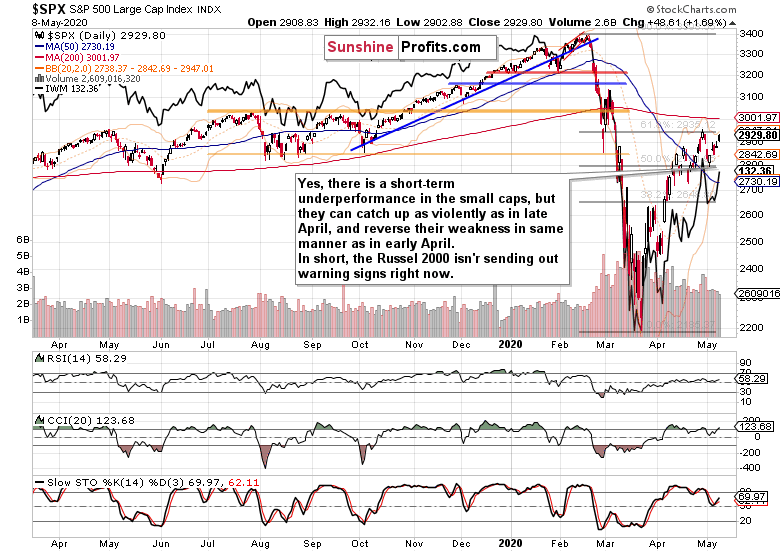
While the two don't move in perfect lockstep on a day-to-day basis, the Russell 2000 index (IWM ETF) sends valuable signals of either confirmation or non-confirmation of the S&P 500 move over the selected time period.
Having recovered just as steeply from the late March lows, the IWM ETF early April plunge turned out a bear trap. During the stock struggles with the 50% Fibonacci retracement, IWM went sideways, only to spurt higher as stocks raced to the 61.8% Fibonacci retracement. On the stock selloff early last week, IWM made a higher high - that's a bullish sign of buying pressure returning to the smallcaps.
Should IWM continue catching up relative to the S&P 500 (after all, they haven't retraced as much of the downside move), that would support the stock upswing to continue - regardless of whatever S&P 500 consolidation we might get over the very short-term.
This works just like the Dow theory or the credit market cues - it's a process of catching up that shows which way the non-confirmation will be resolved. And such times can take not only weeks, but months. Currently, the IWM signal gives a gentle nod to the bullish camp.
Summary
Summing up, stocks again proved resilient in the face of Friday's grim employment data. While the key metrics of the debt markets (high yield corporate bonds and its ratios) continue supporting the stock upswing to go on, the stocks to Treasuries ratio spells short-term caution. The message of key S&P 500 sectors is mixed but still with bullish overtones. While we might not see such a strong weekly close this Friday as we did the previous Friday, the risks at the moment continue being skewed to the upside. That would be especially true should the smallcaps continue catching up relatively to the S&P 500. Accounting for the premarket developments (bearish gap and upswing rejection, we've already closed the long position and taken respectable profits off the table).
If you enjoyed the above analysis and would like to receive daily premium follow-ups, we encourage you to sign up for our Stock Trading Alerts to also benefit from the trading action we describe - the moment it happens. The full analysis includes more details about our current positions and levels to watch before deciding to open any new ones or where to close existing ones.
Thank you for reading today's free analysis that offers you a full peek under the hood of what subscribers enjoy (except for the outlook as concerns various investment horizons). If you'd like to supplement the above with details regarding the details of our current trading positions (and the upcoming ones), or the targets of the upcoming sizable moves in the S&P 500 for that matter, we encourage you to subscribe to our Stock Trading Alerts. You might also be interested in our new service - weekly Stock Investment Updates, which we have recently introduced, and which we provide at promotional terms. Try them out today.
Thank you.
Monica Kingsley
Stock Trading Strategist
Sunshine Profits - Effective Investments through Diligence and Care -
The Opening Salvo in the S&P 500 Downswing
May 4, 2020, 9:00 AMWelcome to this week's Stock Investment Update. Its purpose is to lay out what has happened in the S&P 500 over the previous week, and examine the prospects of upcoming moves.
Thursday's bullish run into the closing bell evaporated faster than you could say Jack Robinson. On the heels of the Amazon (AMZN) earnings disappointment, stocks slid during the overnight session, opening subdued across the board. The glimmer of hope offered by stronger than expected ISM Manufacturing PMI data proved short-lived, and gave us an opportune entry point to exit the prior long position on better terms, and simultaneously open the new and immediately profitable short position.
S&P 500 in the Medium- and Short-Run
We'll start this week's flagship Stock Trading Alert with the weekly chart (charts courtesy of http://stockcharts.com ):
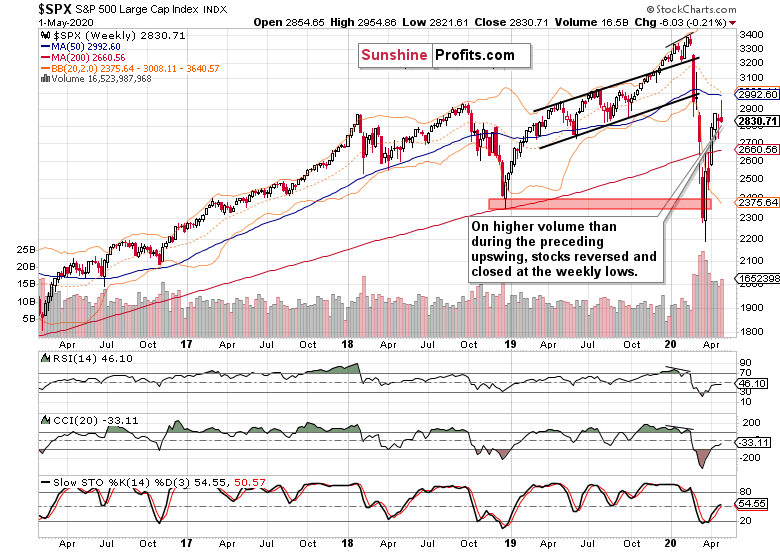
The long upper knot shows how far the rally has reached over the week, almost touching the 50-week moving average. However, prices reversed sharply lower, and did so on higher volume than was the case throughout the preceding upswing. That's a bearish omen.
Let's check the daily chart to see how the story of decelerating weekly indicators is most likely to proceed.
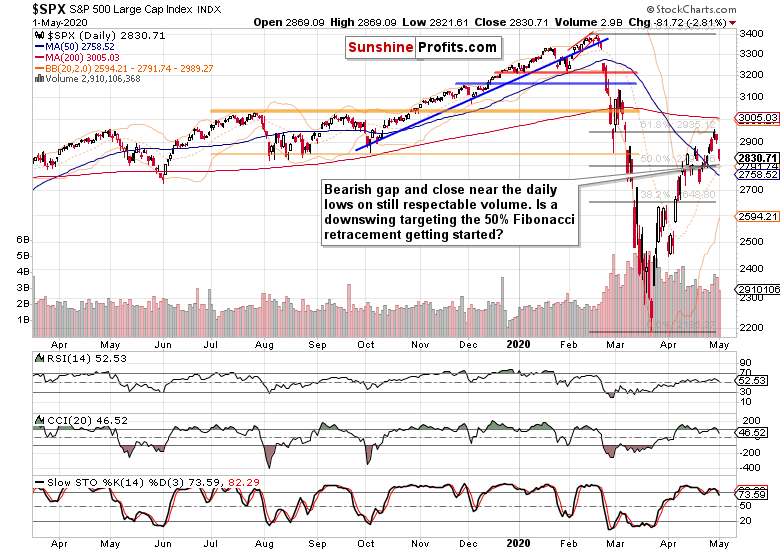
The sizable bearish gap at the open drove prices lower in the following hours regardless of the positive manufacturing surprise. It's true that Friday's volume has been lower than that of Thursday's reversal with the comeback attempt to the 61.8% Fibonacci retracement. Does that mean the downswing is running out of steam?
In all likelihood, the lower volume just shows that a larger move is underway, and that the bulls don't find the setup interesting enough to step in and buy with conviction. Similarly the bears don't find it a good time or place to get out of their positions just yet.
As the daily indicators are overwhelmingly in accord with the downtrend's chances to continue, which areas could prove an obstacle for the sellers?
The 50% Fibonacci retracement at around 2790 is the closest at hand, but we don't expect it to be overly strong at stopping the bears. Depending on the momentum and time it gets to reach, the 2750-2720 area might prove stronger. This is the area marked by the 50-day moving average on its upper end and previous local lows on the lower end.
Depending on the technical signals we get along the way, we'll be able to better assess how far the downswing could go, and make appropriate trading decisions.
With that in mind, let's check the debt markets.
The Credit Markets' Point of View
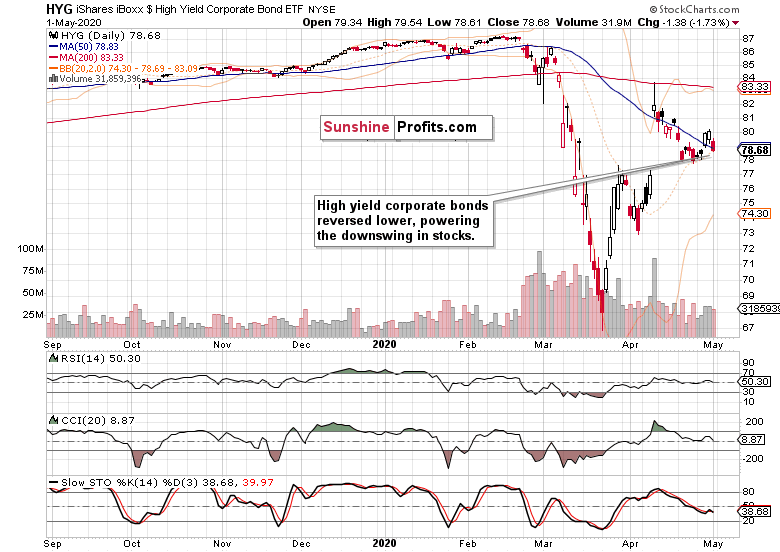
High yield corporate debt turned lower, in unison with the declining stocks. And so did its ratio to short-term Treasuries (HYG:SHY). Is the message from investment grade corporate bonds (LQD ETF) any better?
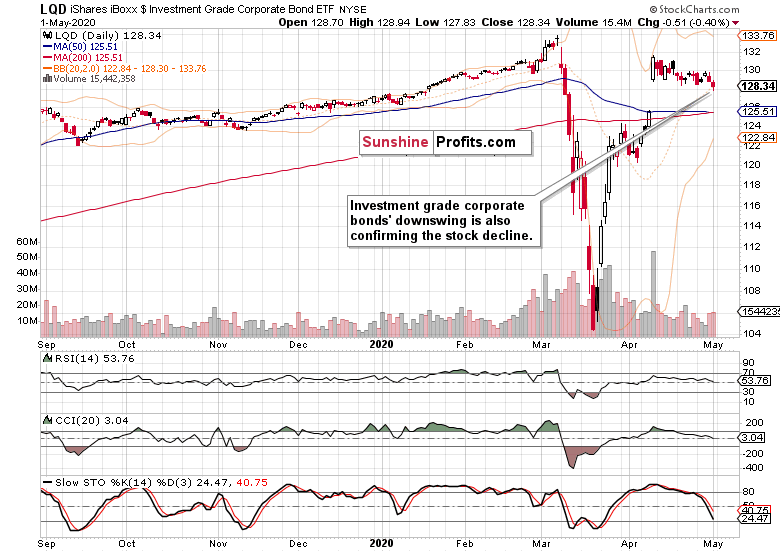
Not really, and this better-rated corner of the corporate debt world, is actually leading the downside move. And again, so is its ratio to the longer-dated Treasuries (LQD:IEI).
Unless both ETFs' moves lower are reversed, the credit markets aren't really on the bulls' side right now.
Key S&P 500 Sectors in Focus
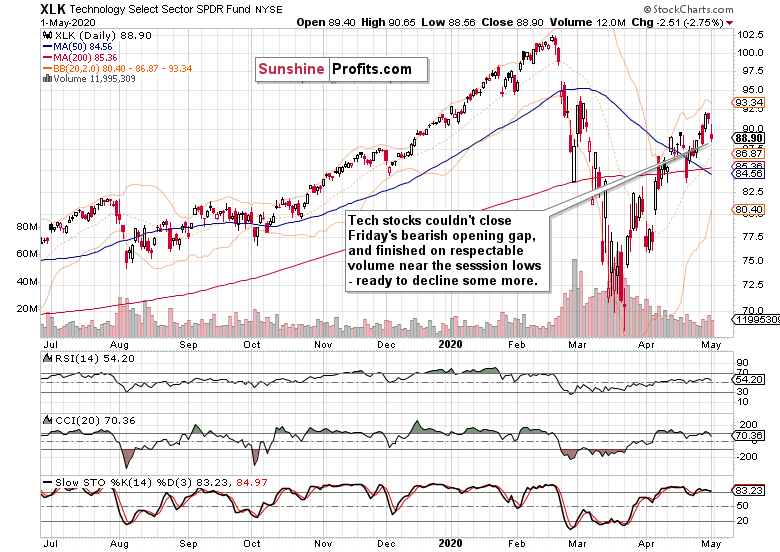
The tech sector tried hard to erase the opening losses, but just could close Friday's gap. Just as the S&P 500, it closed near its lows on respectable volume, giving the coming move lower a pretty good chance of continuing. The daily indicators are rolling over to the downside, supporting the downswing.
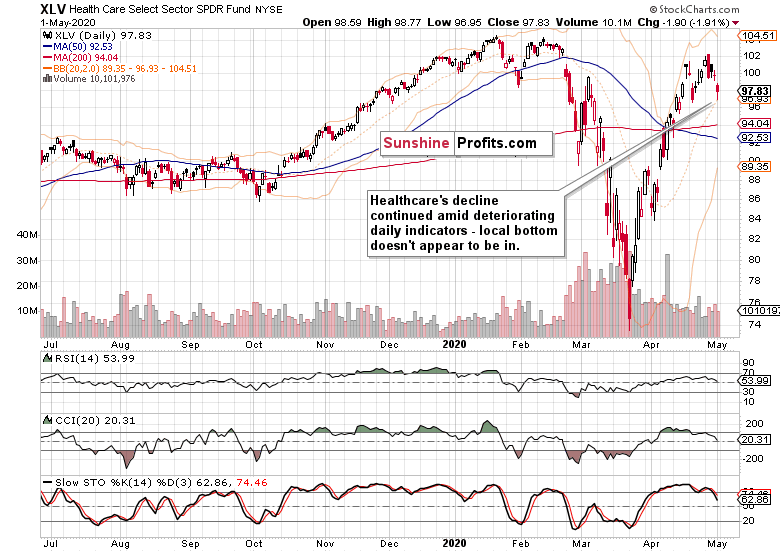
Healthcare mirrors the action in tech quite well, with the exception of an attempt to close Friday's bearish gap. As this was near to nonexistent in this sector, it subtly speaks in favor of more downside to come - just as the daily indicators' sell signals do.
As the credit markets' standing has deteriorated, how much was it reflected in the financials?
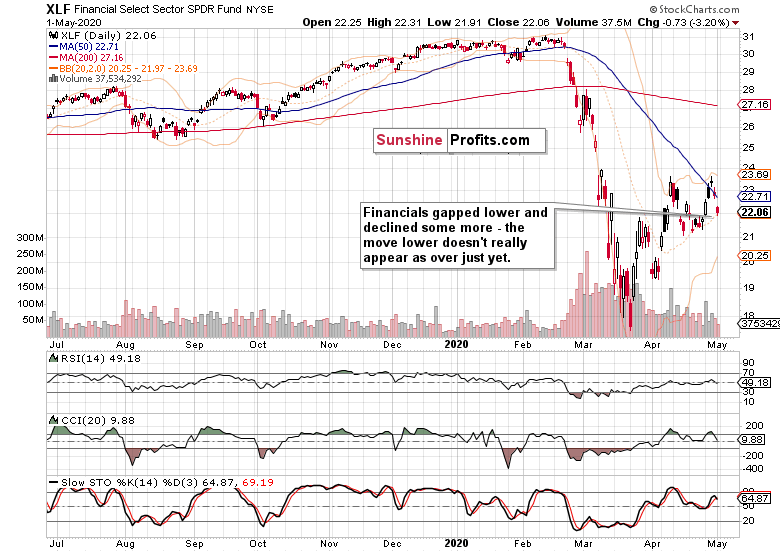
The financials' outperformance is over, and the sector has moved steeply lower. Thanks to the position of the daily indicators, the downswing has a good chance to continue as well.
Next, we'll examine the stealth bull market trio of sectors that are supposed to lead the index higher, if we are in a bull market, that is. So, let's check energy (XLE ETF), materials (XLB ETF) and industrials (XLI ETF).
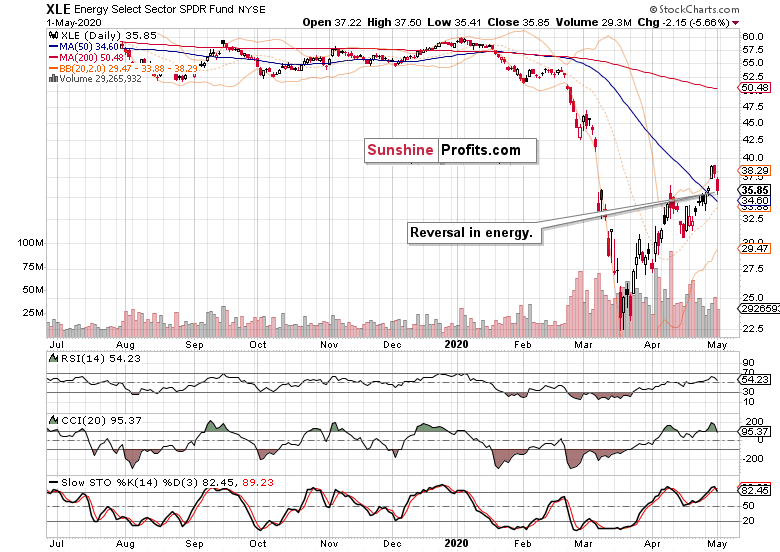
Energy clearly reversed, and its relative strength (or lack thereof) as we see the S&P 500 going lower, will be an important signal in assessing the health of the decline and prospects for upside reversal. For now, there's been no sign of strength on Friday.
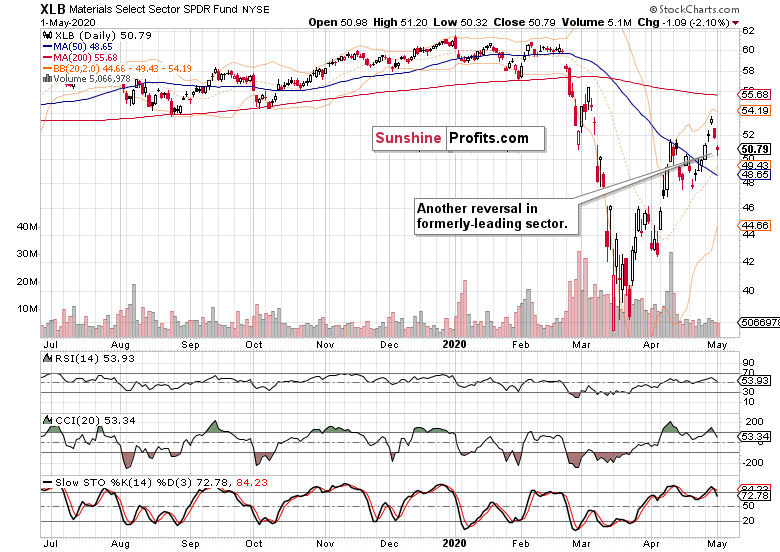
A similar conclusion can be reached from the materials examination. While they held up better throughout the day (just like consumer discretionaries, the XLY ETF, did), it'll likely prove to be of fleeting nature only (in both cases).
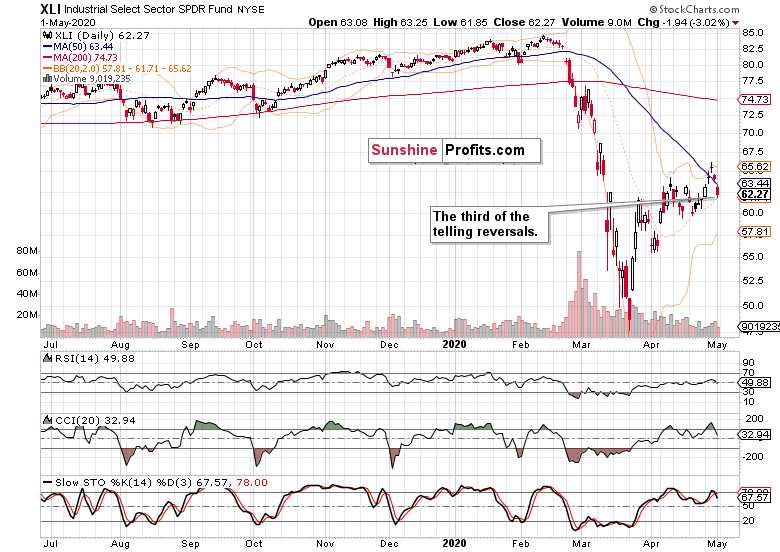
And that's also true with industrials, where the weakness was more along the lines of energy. Plain obvious, that is.
Overall, this mix shows that there can be no talk of a local bottom being reached. The S&P 500 downswing has its ducks ligned in a row right now.
The Fundamental S&P 500 Outlook
Early in the week, the bulls enjoyed earnings reports that beat expectations among the tech heavyweights. That however changed with Thursday's aftermarket Amazon (AMZN) release - it's notable, how easily could the whole of its Q2 projected profit get gobbled up by coronavirus-related expenses, as they foresee it would.
The reopening euphoria has run against the wall as about half the States have partially reopened their economies. The epidemiological situation is improving in some areas while deteriorating in others, underscoring that jumpstarting the economy would be a long process. As we noted in our April 12 Stock Trading Alert, while there is a legitimate desire to get the economic life going again, these factors are to be counted with:
(...) 1. the stress and damage to the supply chains
2. consumer confidence and lifestyle habits
3. small and medium business capacity to absorb the shocks
4. the ability to buy time and soften the blow via monetary and fiscal interventions
Going into Friday's trading, the Trump finger pointing on China for coronavirus raised fears about the trade war that took a backseat to the pandemic. Understandably, not even the high hopes placed in remdesivir getting the emergency use authorization, could turn the sentiment.
Fundamentally, we expect the stock market to reassess its overly optimistic prospects against the economic impact on the ground. Stock valuations are likely to be viewed as extended, and this supports the bearish bias over the coming sessions.
From the Readers' Mailbag
Q: What would you think would be the next level down on the SP 500? 2793 - the 50% FIB retracement from the lows? or 2652 - the 38,2% retracement?
A: The 50% Fibonacci retracement is within spitting distance, and in the course of the S&P 500 daily chart analysis, we've discussed an area in between these two retracements that we expect to give the bears a harder time than the 50% Fibonacci retracement. Throughout the move, we'll be monitoring the sectoral strength, their ratios, and the credit markets, for these will give us an idea how far the current downswing can actually reach. We think that we're in the opening stages thereof, and that our open profits will keep growing before it's justified to close the trade.
Q: Should I buy at around 2600?
A: It's too early to say that, as the above points about credit markets, sectoral strength, ratios and fundamental developments apply whatever numerical target we discuss. Together, they'll form the basis for our upcoming trading decision, and yes, stocks declining to the low 2600s is one of the preliminary scenarios or hypothesis if you will.
Summary
Summing up, stock rolled over almost all the way down to the 50% Fibonacci retracement, highlighting the significance of the reversal from the 61.8% Fibonacci retracement. The credit markets support the downswing, and so does the broad sectoral analysis. We're in the early stages of the S&P 500 downswing and our open and profitable short position currently featured in Stock Trading Alerts, is amply justified.
If you enjoyed the above analysis and would like to receive daily premium follow-ups, we encourage you to sign up for our Stock Trading Alerts to also benefit from the trading action we describe - the moment it happens. The full analysis includes more details about our current positions and levels to watch before deciding to open any new ones or where to close existing ones.
Thank you for reading today's free analysis that offers you a full peek under the hood of what subscribers enjoy (except for the outlook as concerns various investment horizons). If you'd like to supplement the above with details regarding the details of our current trading positions (and the upcoming ones), or the targets of the upcoming sizable moves in the S&P 500 for that matter, we encourage you to subscribe to our Stock Trading Alerts. You might also be interested in our new service - weekly Stock Investment Updates, which we have recently introduced, and which we provide at promotional terms. Try them out today.
Thank you.
Monica Kingsley
Stock Trading Strategist
Sunshine Profits - Effective Investments through Diligence and Care
Free Gold & Stock Newsletter
with details not available
to 99% investors
+ 7 days of Gold Alerts
+ Mining Stock Rankings
Gold Alerts
More-
Status
New 2024 Lows in Miners, New Highs in The USD Index
January 17, 2024, 12:19 PM -
Status
Soaring USD is SO Unsurprising – And SO Full of Implications
January 16, 2024, 8:40 AM -
Status
Rare Opportunity in Rare Earth Minerals?
January 15, 2024, 2:06 PM

