

-
Stock Investment Update - S&P 500 Bulls Are Likely to Get Tested Soon
August 10, 2020, 8:19 AMWelcome to this week's Stock Investment Update.
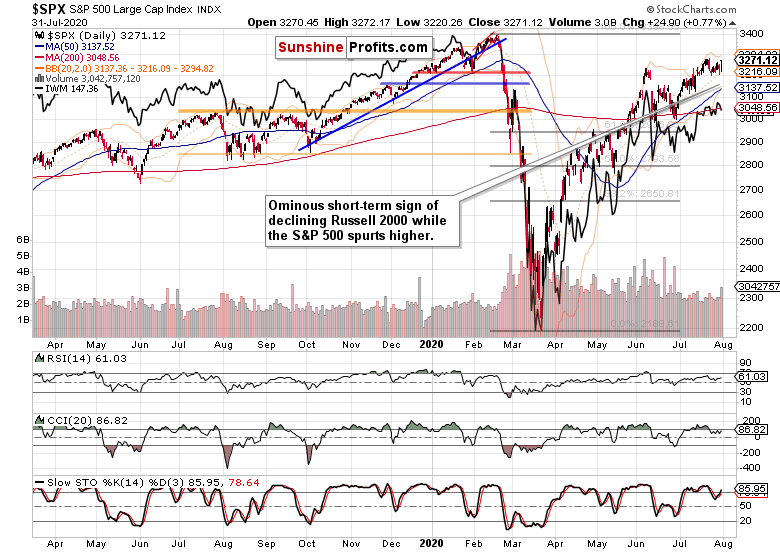
The S&P 500 closed again above the mid-Feb bearish gap, and the talk of taking on the all-time highs is intensifying. So does the greed that's growing more extreme with each passing day. With the put/call ratio approaching the early June lows, it's getting crowded on the buy side.
Stocks have been enjoying the Q2 earnings reports, brushing aside the stimulus wrangling and job market realities (yes, the federal continuing claims rose again, and combined with the state continuing claims, they're within spitting distance of their early July record total above 32 millions).
The longer the wait for a new package, the more will the reality's repercussions (this goes beyond consumer discretionaries) be reflected in stock prices. Hello second wave of unemployment, where the jobs that came back, are being lost again. Add elections uncertainty or a U.S. - China surprise, and a recipe for a pretty volatile autumn results.
But Trump signed on Saturday the executive orders so as to move past he stalling talks in Congress. Couple that with the Fed support, and the stock rally has more time to run.
Rising Treasuries though reveal a certain degree of distrust in the recovery story, and the precious metals bull front-runs inflation. These boil down to stagflation being baked in the cake.
All right, let's dive in to the charts.
S&P 500 in the Short-Run
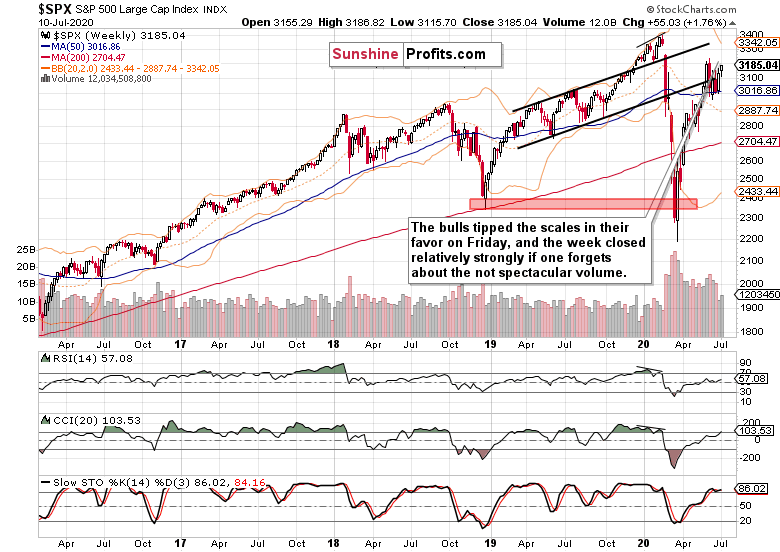
I'll start with the weekly chart perspective (charts courtesy of http://stockcharts.com ):
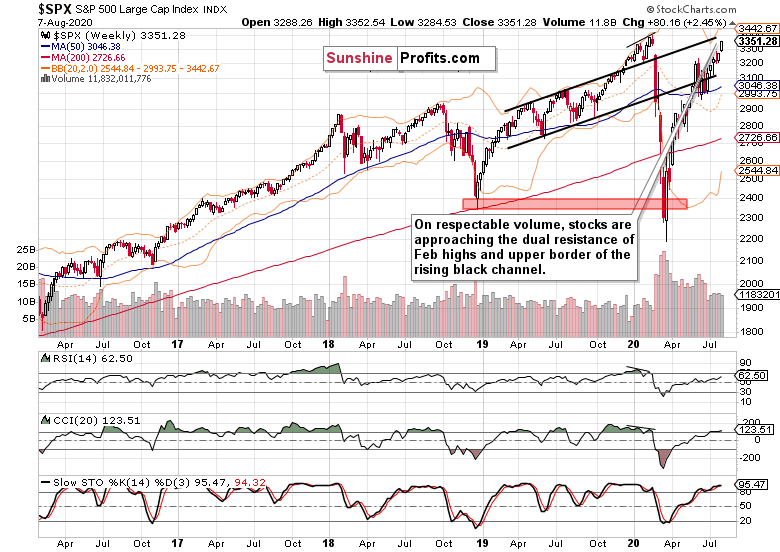
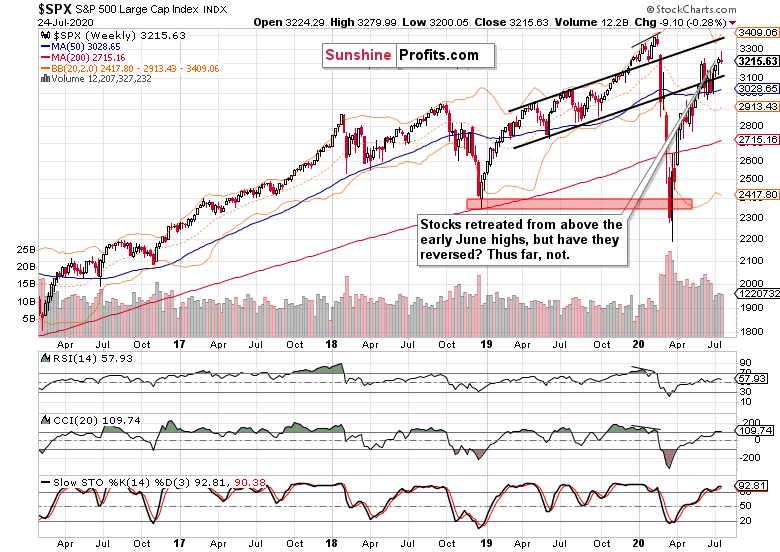
Bullish price action for many recent weeks on volume that isn't yet inviting increasing participation of the sellers. This fact alone bodes well for higher stock prices in the medium-term, but the buyers will meet a set of two key resistances shortly.
It's the Feb all-time highs that are drawing nearer day by day, and the upper border of the rising black trend channel. I look for more emphatically contested encounters there.
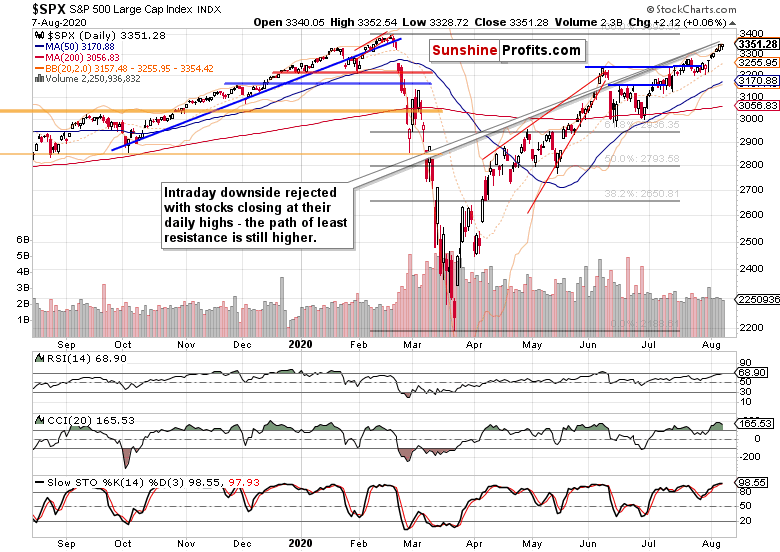
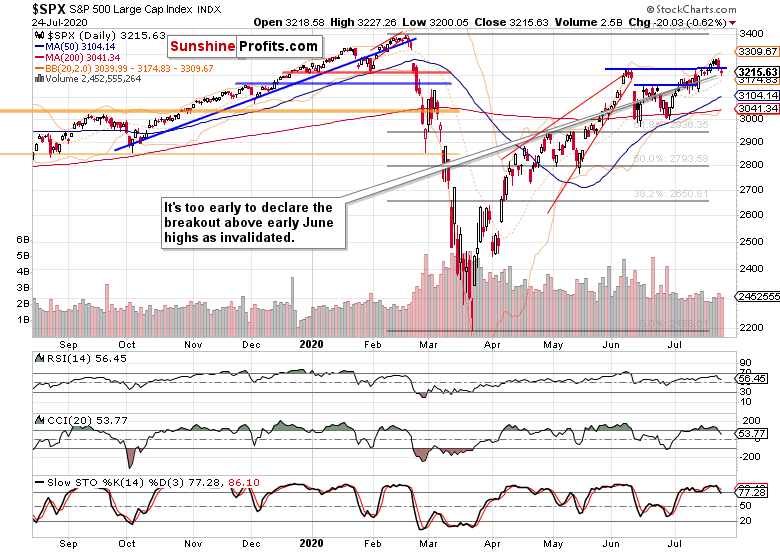
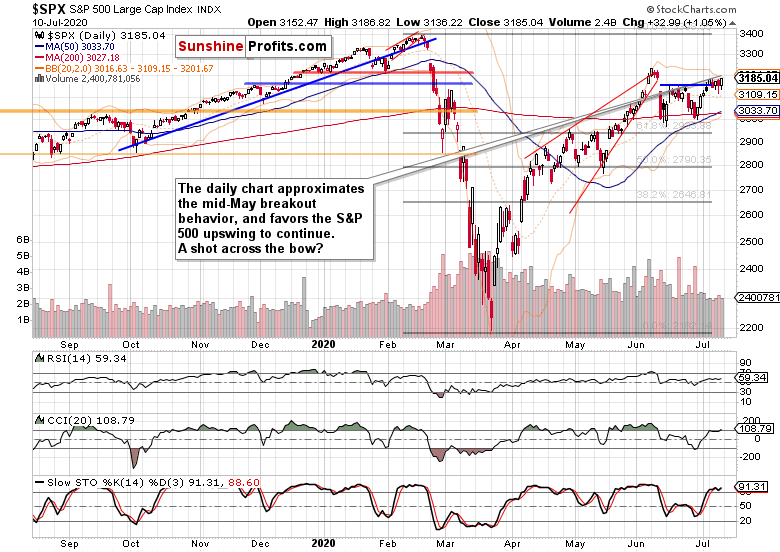
On steady volume, the stock upswing goes on. Two attempts to move lower on Friday were rebuffed, and stocks closed at their intraday highs.
Such was my Friday's short-term battle plan:
(...) Yes, the daily indicators are increasingly extended, and it's not about the RSI merely. A breather that would coincide with temporarily lower prices, would be both refreshing and healthy for another upleg.
So, we have these days' bullish price action and extended daily indicators as prices are approaching the Feb highs against the stimulus negotiations that are draging on, and many a real economy sector's pain out in the open.
Should a correction strike, and take out the bulls such as myself again profitably out of the open position, it's imperative to assess the downswing's internals, whether it is or isn't turning into something more serious and not merely temporary.
So, have the odds of a correction risen? Credit markets might have the answer.
The Credit Markets' Point of View
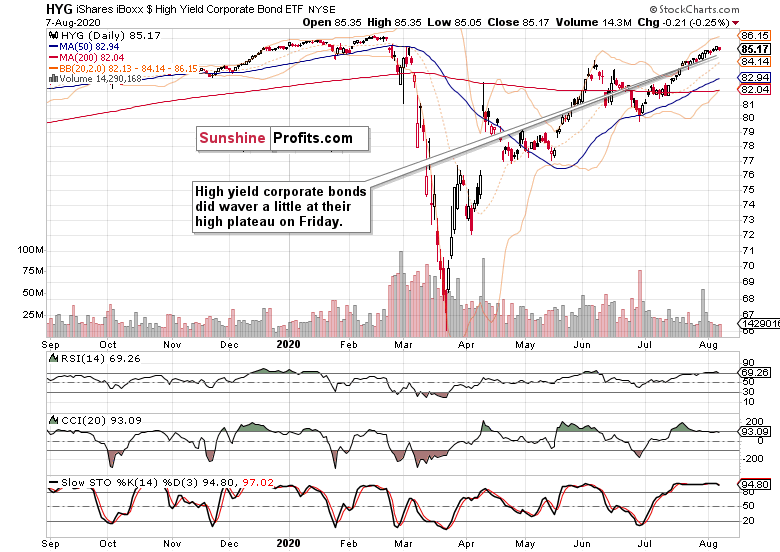
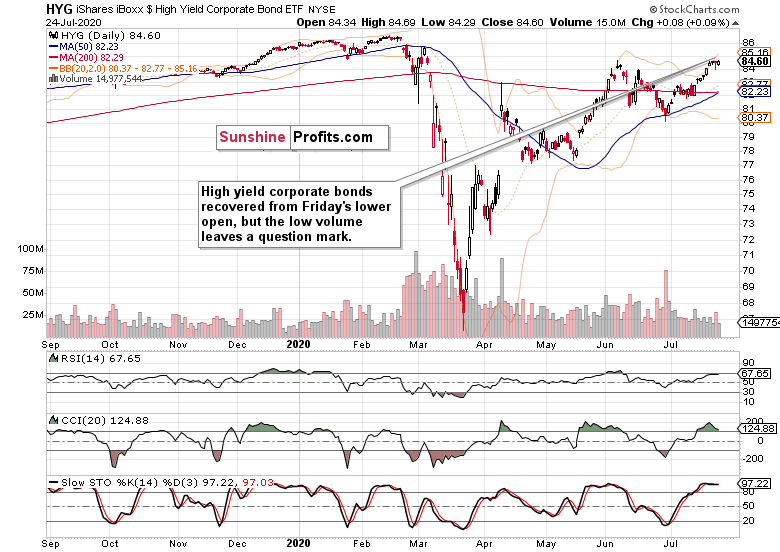
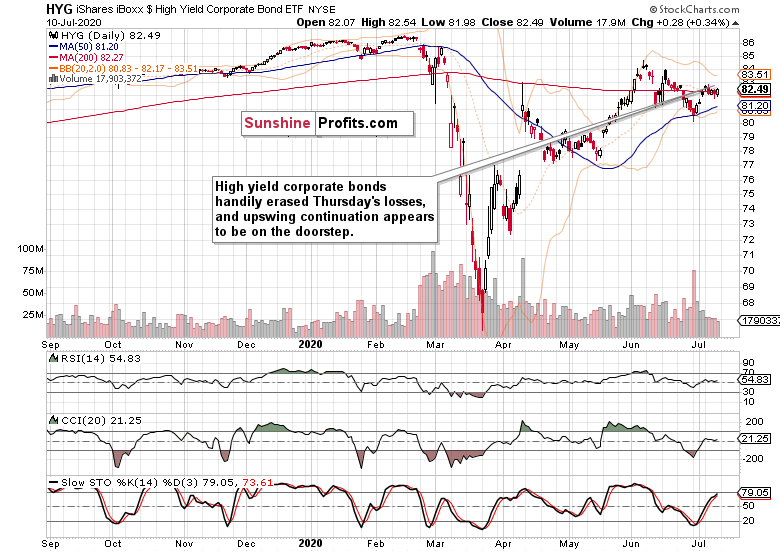
High yield corporate bonds (HYG ETF) declined on Friday, but the volume doesn't tell the story of a reversal. Far from it, the uptrend with generally rising prices and limited intraday volatility hints at the market betting that the Fed has its back. After all, its balance sheet has barely moved till Wednesday, August 5.
That's also why I am not putting much emphasis on the daily bearish engulfing pattern in investment grade corporate bonds (LQD ETF). Let's read that move in the context of preceding days, and that means a daily setback within an uptrend, on not too convincing volume.
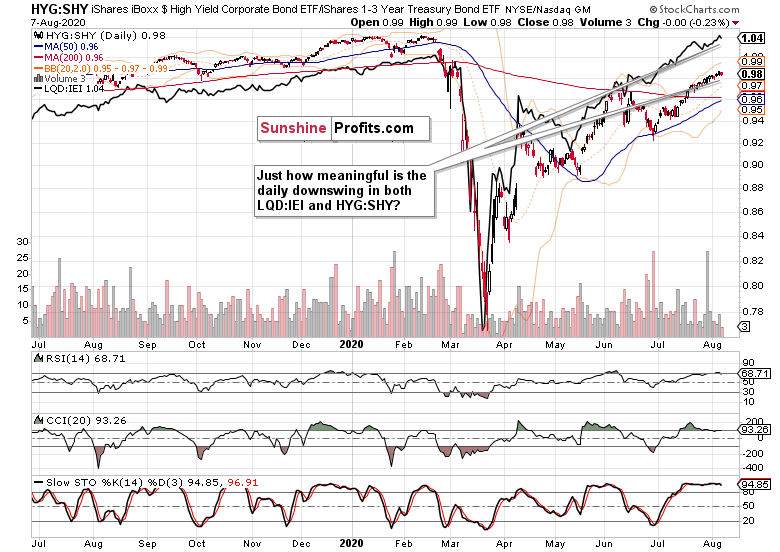
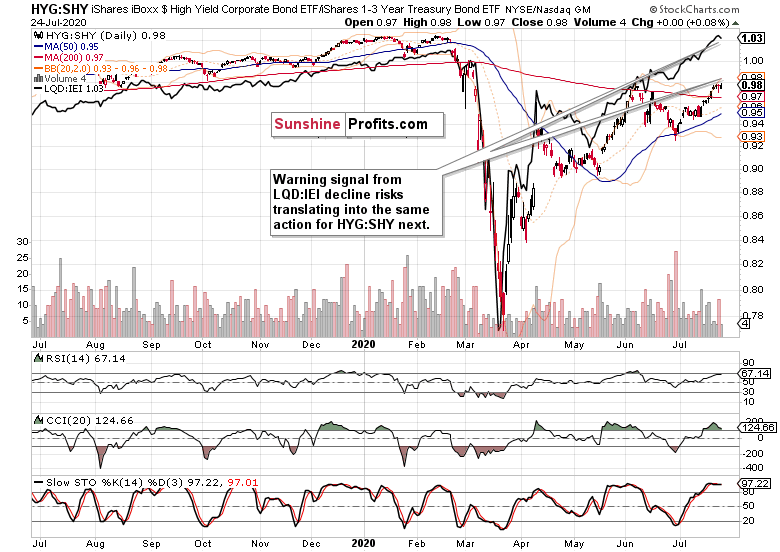
Both leading credit market ratios - high yield corporate bonds to short-term Treasuries (HYG:SHY) and investment grade corporate bonds to longer-dated Treasuries (LQD:IEI) - have moved lower on Friday, because both corporate bond ETFs fell more than the respective Treasuries.
This points to the credit markets turning risk-off, which has the potential to carry over to stocks shouldn't the ratios' decline be a one day phenomenon.
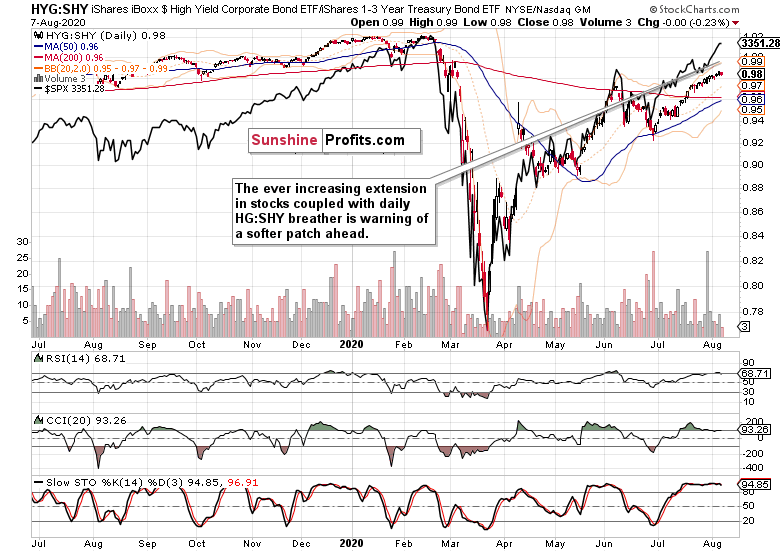
The overlaid S&P 500 closing prices (black line) are getting more and more extended relative to the HYG:SHY ratio. Has the index reached a tipping point where the bears would step in?
The bulls better tread carefully here - as in have the gains locked in, because a bear raid will be an increasingly tempting proposition this week in my opinion.
Would that derail the stock bull run? By the shape of things, I still don't view that as likely. The elections uncertainty or the measured pace of the recovery aren't on the stock market's radar screen featuring prominently just yet.
Smallcaps, Emerging Markets and Copper
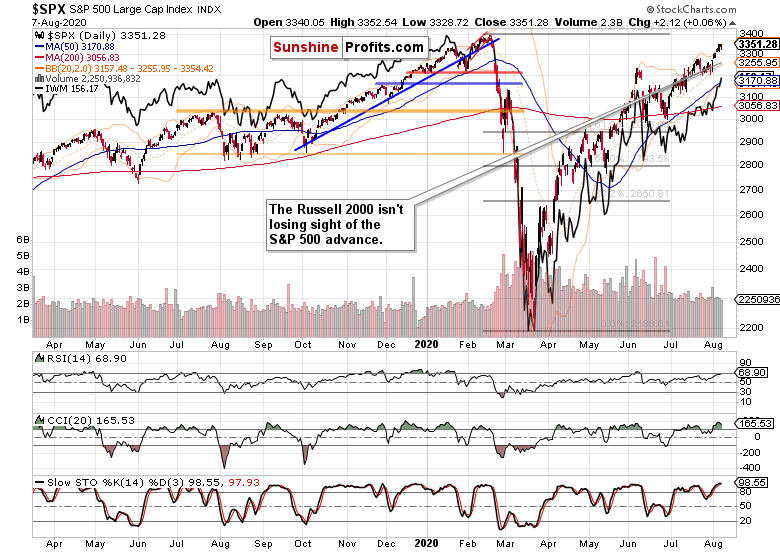
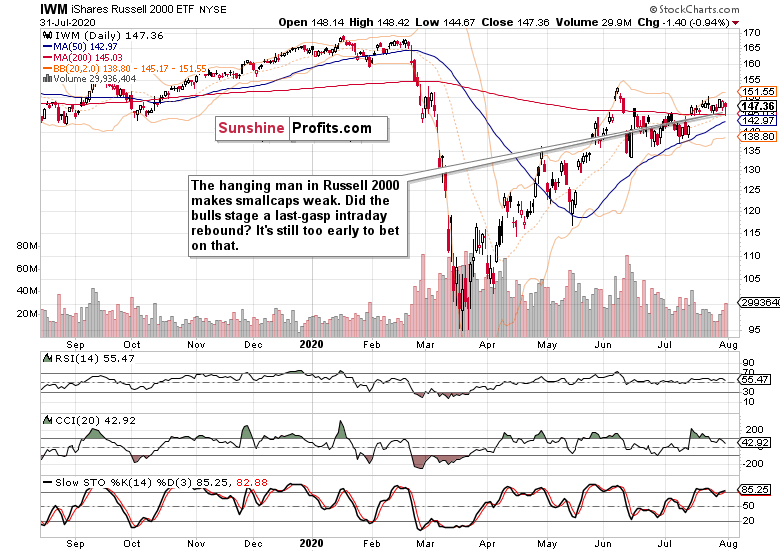
So far so good, the S&P 500 upswing was mirrored with the rising Russell 2000 (IWM ETF). The fact there's no distribution, no profit taking in the smallcaps, paints a picture of both U.S. indices' resiliency.
True, the situation in Dow Jones Industrial Average (DIA ETF) isn't as optimistic as the diamonds are trading still below their early June highs, which absolutely doesn't compare to the stellar performance of Nasdaq ($COMPQ).
Still, the non-confirmations can drag on for months, and be resolved at much higher prices. The key takeaway is that there hasn't been an immediate deterioration.
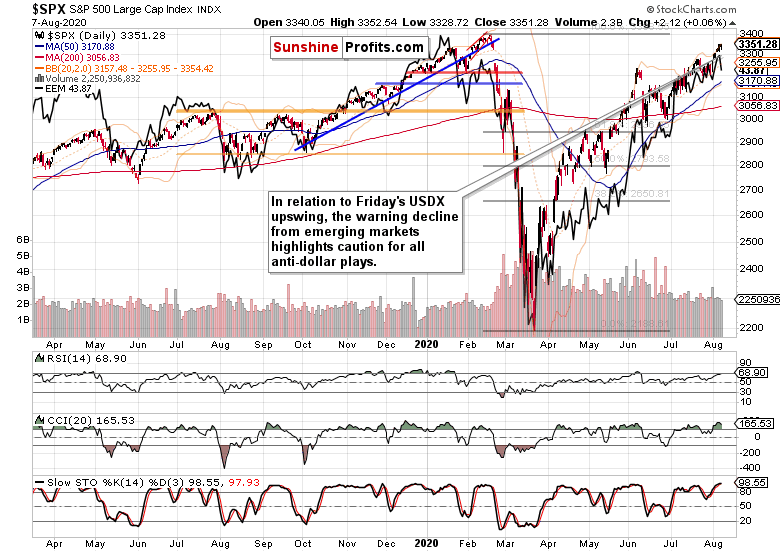
The same thing though can't be said about emerging markets (EEM ETF), because they've turned sharply lower - hand in hand with the dollar upswing. In my Friday's gold analysis, I've called for the greenback to put up a fight now, and non-U.S. stocks are feeling the heat.
Such a flight to safety has the potential to spill over into the States - the longer it last, naturally. And just as one swallow doesn't make a spring, Friday's EEM move means amber light for stock bulls.
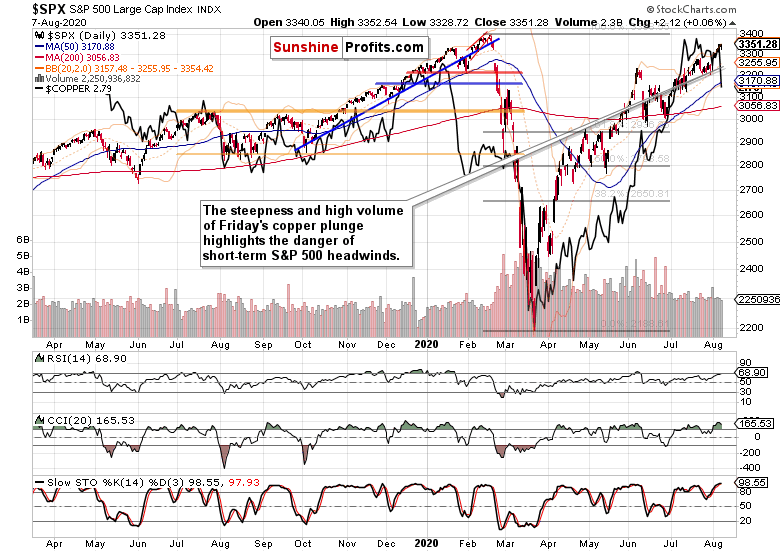
The red metal ($COPPER) seconds that cautious conclusion as it had declined on heavy volume. Such a move has the potential to exert downward influence on the S&P 500 down the road.
S&P 500 Market Breadth
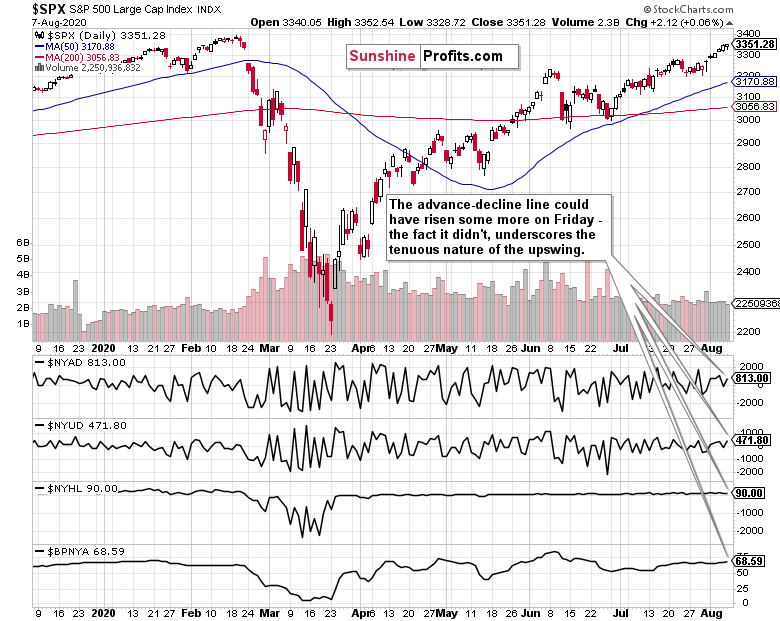
Given the S&P 500 upswing, the advance-decline line could have risen some more on Friday, and the fact it didn't, raises the possibility of a short-term setback. We might be looking at a very short-term divergence in the making (lower high in the indicator), but that would require a down-to-sideways trading to hit at this week's open.
Overall, the market breadth chart calls for short-term caution as well. The bulls enjoy the benefit of the doubt, but it's likely we're slowly but surely entering a period of not so smooth sailing ahead. Will the monetary and fiscal policy duo invalidate that?
Summary
Summing up, the S&P 500 upswing goes on, but many signs call for short-term caution as a soft patch in stocks might be not too far ahead. With the dollar likely to move higher in the short run, the risk-off echo could throw a spanner into the stock bulls' works. Time to dance close to the exit door should the bulls start running out of breath - every bull market has to endure corrections and the current one is no exception.
Thank you for reading today's free analysis. If you would like to receive daily premium follow-ups, I encourage you to sign up for my Stock Trading Alerts to also benefit from the trading action described - the moment it happens. The full analysis includes more details about current positions and levels to watch before deciding to open any new ones or where to close existing ones.
Thank you.
Monica Kingsley
Stock Trading Strategist
Sunshine Profits: Analysis. Care. Profits. -
Stock Investment Update - S&P 500 Bulls Pulled a Rabbit Out Of Their Hats
August 3, 2020, 11:18 AMWelcome to this week's Stock Investment Update.
Just as I called for, the bulls are winning in the battle to break above the early June highs lastingly. And it's not through technology, communications or the defensives - the other sectors keep more or less standing ground.
So, can I wave off the selling pressure right after the opening bell? In today's analysis, I will look at this shot across the bow, and examine the extent to which the bulls should be concerned, or not.
I reaction to Q2 tech earnings indeed overpowered the dismal quarterly GDP figures and struggling job market. Right or wrong, the stock market takes a rear view mirror look at this historic GDP plunge, treating it as a mere mini-depression. It chooses to ignore the fact that more than 54 million Americans have filed new claims for unemployment benefits, and that a total of 118 million working age Americans aren't working (the labor participation rate in June stood at 61.5% only).
With the new stimulus around the corner, it's betting that the unprecedented plunge in personal consumption (concentrated in services, not goods) and likewise steep dive in consumer sentiment, would be over. Right now, such bets are still paying off.
S&P 500 in the Medium- and Short-Run
I'll start today's flagship Stock Trading Alert with the weekly chart perspective (charts courtesy of http://stockcharts.com ):

After preceding week's hesitation, bullish price action revived the weekly chart again. On solid volume, prices closed above the early June highs. All by themselves, I don't see the extended weekly indicators as a cause for concern - such rationale has to stem from the daily chart, so let's check that one next.
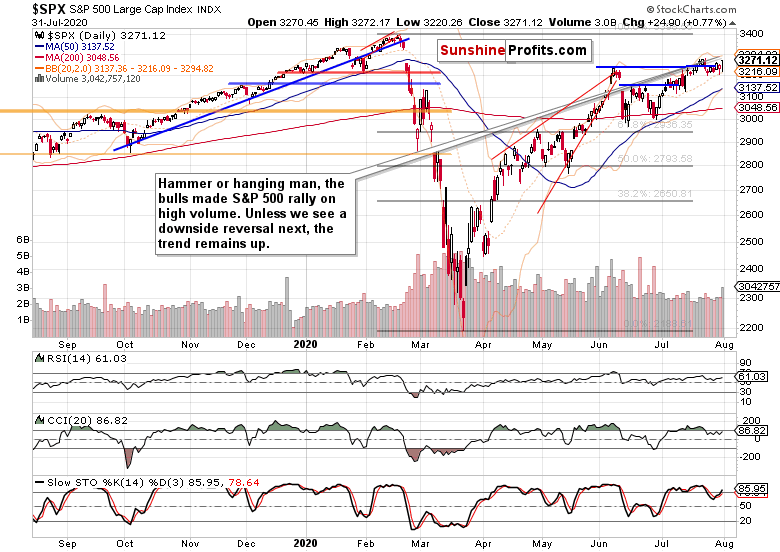
Another breakout attempt above the early June highs is officially in, and its rising volume is encouraging. Or does the bearish candlestick bring more than its fair share of caution? Without a downside reversal in the nearest days, the candle merely tells a story of a successful reversal of Friday's losses.
The credit markets still lean the bullish way.
The Credit Markets' Point of View
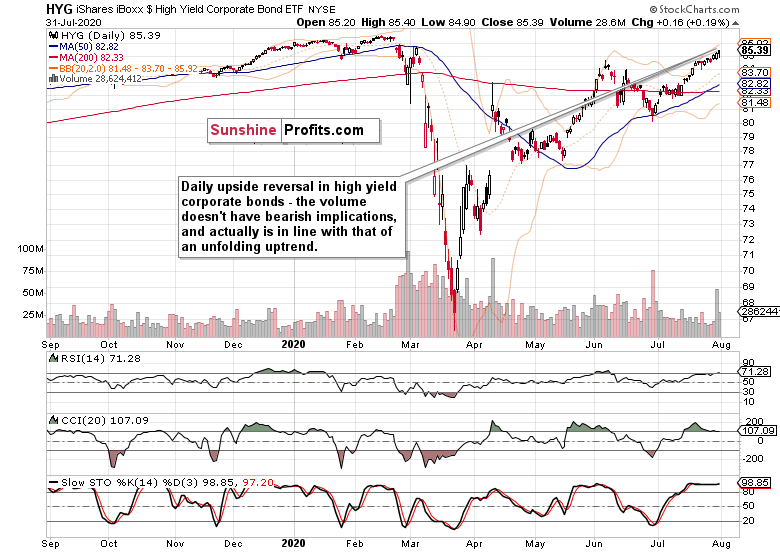
High yield corporate bonds (HYG ETF) extended gains on Friday, having earlier repelled the bears. The lower volume isn't an issue when examining the previous volume spike. Take a look at late June, and the relative volume differential in the session following the washout one. That's why I see Friday's decreasing volume vs. Thursday's high one, as no cause for concern.
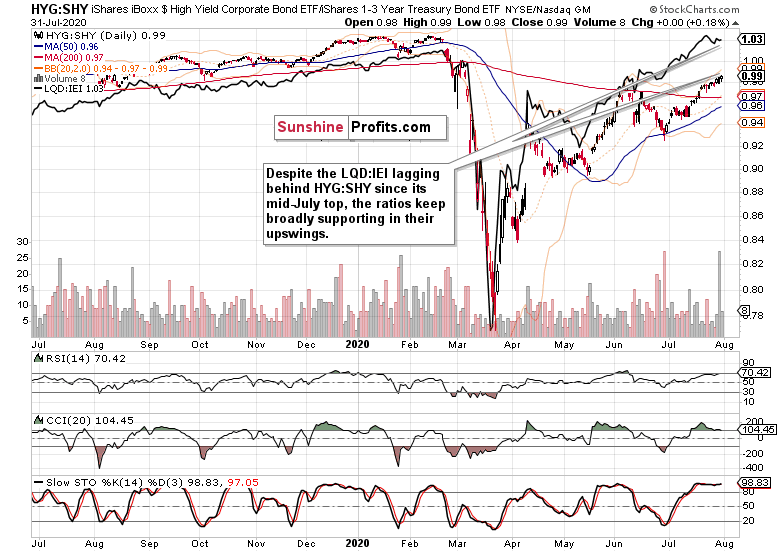
Both the leading credit market ratios - high yield corporate bonds to short-term Treasuries (HYG:SHY) and investment grade corporate bonds to longer-dated Treasuries (LQD:IEI) - are broadly supporting each other. And that bodes well for the stock upswing to go on.
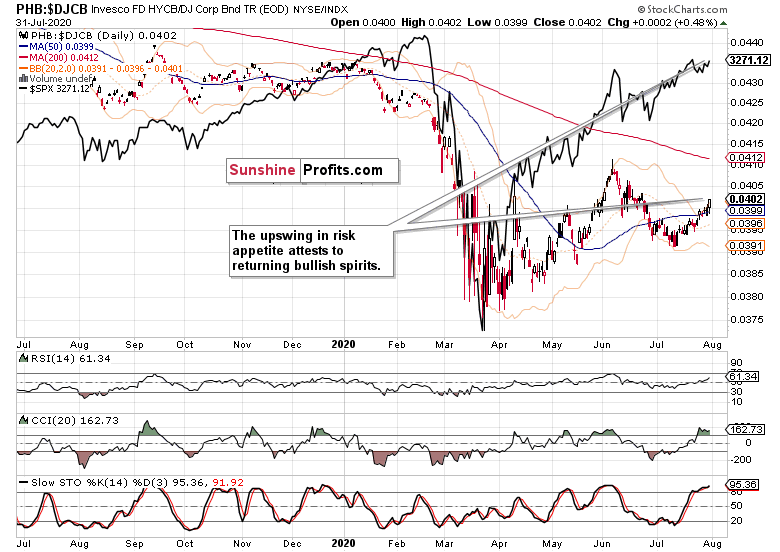
The ratio of high yield corporate bonds to all corporate bonds (PHB:$DJCB) is in an uptrend again, and such return of the animal spirits in bonds is constructive for the stock market bulls.
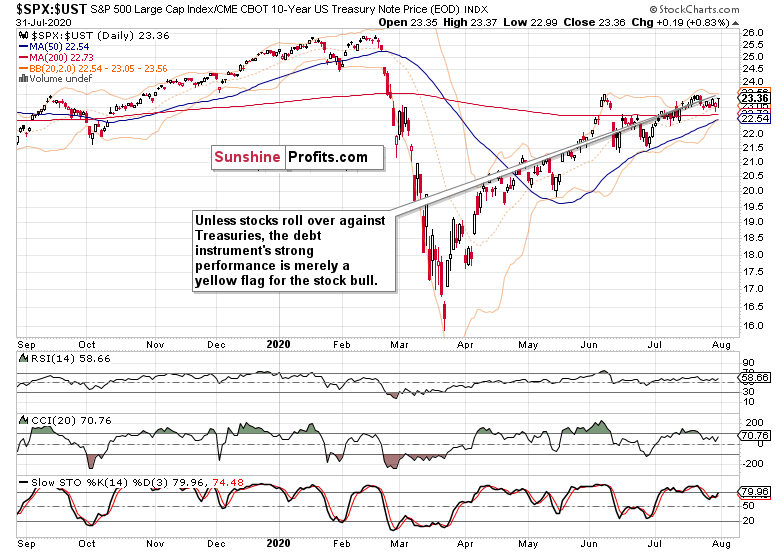
The ratio of stocks to Treasuries ($SPX:$UST) paints a bit more cautious picture. Yet, its message is still of the stock bulls enjoying the benefit of the doubt.
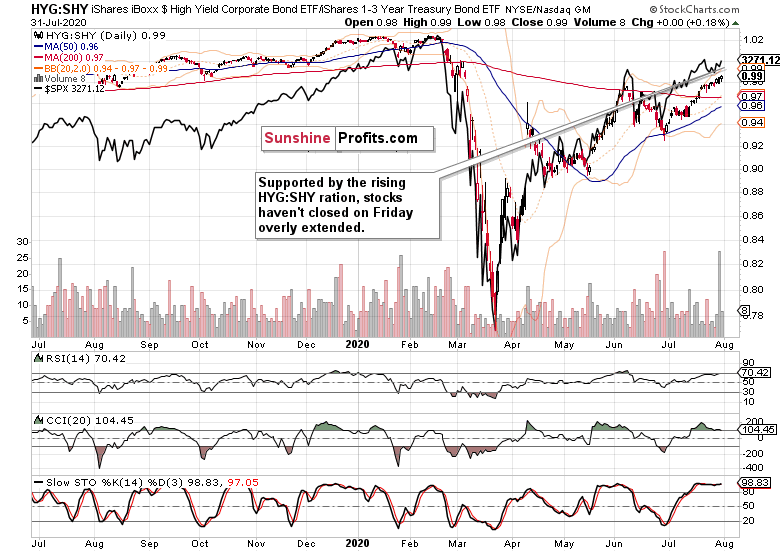
The overlaid S&P 500 closing prices (black line) against the HYG:SHY ratio show that Friday's close didn't leave stocks in a dangerously extended position. Should the HYG:SHY tailwind last as I see it likely to, then stock prices have a floor nearby.
Smallcaps and Emerging Markets
The Russell 2000 (IWM ETF) is trading weak on a very short-term basis - it didn't manage to even close unchanged while the S&P 500 moved up. Should they have performed better, that would point to a more broad-based advance within the S&P 500 - and indeed, the daily market breadth indicators in the 500-strong index have seen better days, politely put. But back to smallcaps.
Indeed, the IWM ETF is in a vulnerable position after having defended its 200-day moving average. Should its weakness take a more impactful turn, that would surely affect the S&P 500.
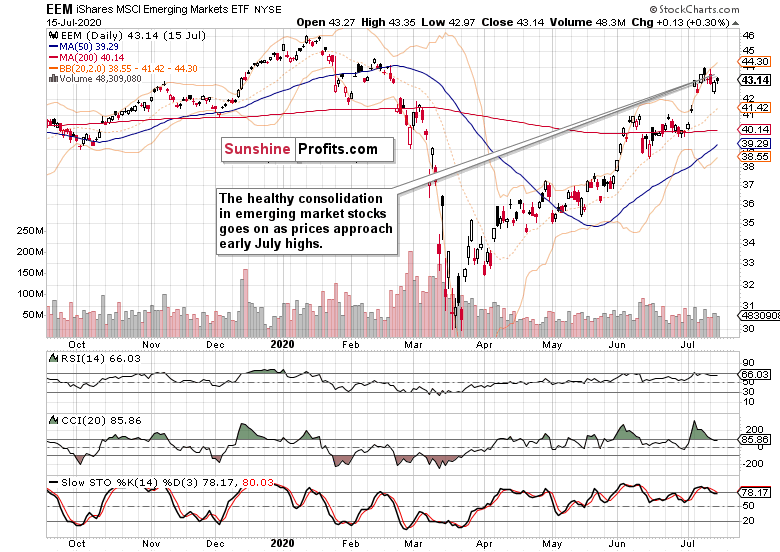
Emerging markets keep their healthy consolidation going, and are slowly again approaching their early July highs. This chart's message certainly isn't bearish for the S&P 500.
S&P 500 Sectors in Focus
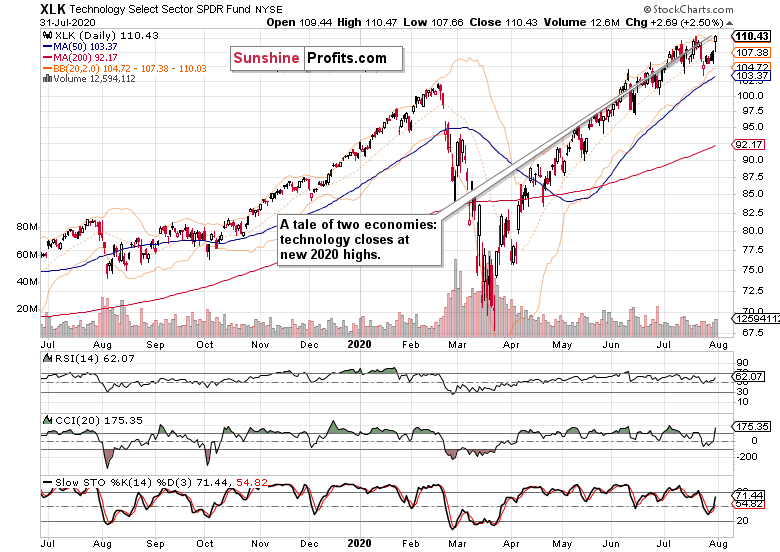
Technology (XLK ETF) is all the rage again, making new 2020 highs. Pretty extended, but the much talked about correction, hasn't come and isn't really here. The key driver of Friday's S&P 500 isn't disappointing.
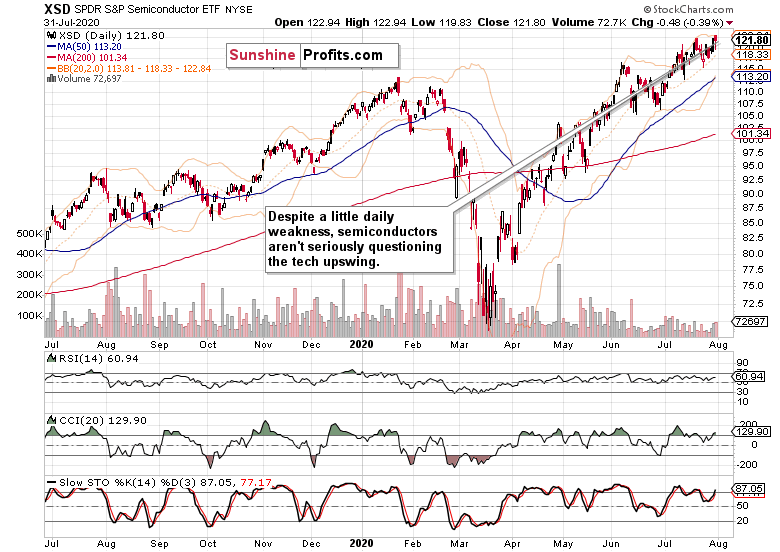
Crucially, semiconductors (XSD ETF) aren't underperforming in any dramatic fashion. Dramatic - that's an understatement, because one day's weakness doesn't cut that. Move on, no crack in the dam here.
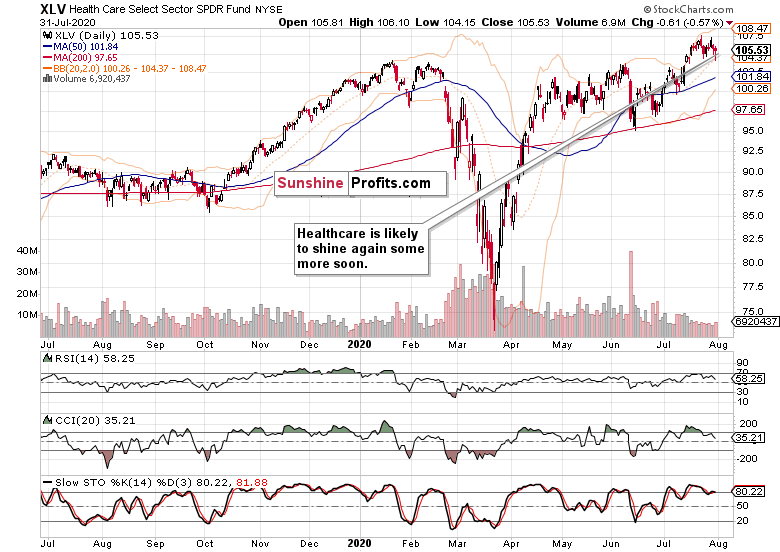
Healthcare (XLV ETF) merely refused to decline profoundly on Friday, and isn't really acting as a market leader over the past few session. Step aside though, and the chart is healthy, and I look for an upside surprise here quite soon. Perhaps some more vaccine news slash hype would help the lackluster financials (XLF ETF) performance too.
Summary
Summing up, Friday's S&P 500 reversal is keeping the breakout attempt above the early June highs alive. Credit markets keep acting strong, and the rise in Treasuries just serves to power the TINA (there is no alternative) trade as it pushes investors farther out on the risk curve. Farther than they would be comfortable, but still helping the stock bull at the moment. One of the key watchouts is the daily market breadth, where both the advance-decline line and advance-decline volume remain in the bearish territory. Overall, the balance of risks remains skewed to the upside, though the bulls would benefit from a tight stop-loss locking recent gains.
Thank you for reading today's free analysis. If you would like to receive daily premium follow-ups, I encourage you to sign up for my Stock Trading Alerts to also benefit from the trading action described - the moment it happens. The full analysis includes more details about current positions and levels to watch before deciding to open any new ones or where to close existing ones.
Thank you.
Monica Kingsley
Stock Trading Strategist
Sunshine Profits: Analysis. Care. Profits. -
Stock Investment Update - Technology is Holding the Key to the Next S&P 500 Move
July 27, 2020, 8:34 AMWelcome to this week's Stock Investment Update.
Going into Friday, I was still sticking to the bullish S&P 500 outlook. As the index declined, are the prospects of higher prices gone? Not at all, and today's analysis will examine the signs that still lean bullish despite the precarious technology position.
Despite the S&P 500 closing below the line connecting the early June highs, continued unemployment claims rising on the state level (don't forget about those rising ones under the federal pandemic programs either), the fate of the $600 weekly addition to unemployment benefits expiring at the end of July, or the U.S. - China confrontations.
On Thursday, I've laid out the market's sensitivities this way:
(...) as strange as it might sound, the stock market isn't about the real economy struggles these weeks. All eyes are on the stimulus and vaccine hopes (whatever one imagines under the latter term), not on the corona case panic and hyped death charts.
Stimulus is coming, and regardless of its final shape and size, markets are going to cheer it. The Fed is no longer in a wait-and-see weekly mode. Stocks expect a policy move, and are still positioned to benefit before inflation or economic realities (thornier road ahead than many an alphabet soup recovery projection implies) strike.
Talking economic realities, what about the societal and interpersonal ones? Sobering snippets of overnight U.S. corona fear transformations courtesy of Big League Politics:
- 75 percent believe that things will never return to normal
- 59 percent are too afraid to go back to their workplace with others
- 75 percent feel that handshakes will no longer be customary
- 38 percent want physical offices permanently removed and replaced with remote work
- 53 percent are nostalgic for the good old days when people weren't forcibly masked while the rest have seemingly become accustomed to the "new normal".
Such shifts underscore why some sectors have it way tougher than others.
S&P 500 in the Medium- and Short-Run
I'll start today's flagship Stock Trading Alert with the weekly chart perspective (charts courtesy of http://stockcharts.com ):
The weekly candlestick bears shape of a reversal, but is it a credible one? Weekly volume didn't pick up, weakening the case for a trend change. The preceding week brought us a hanging man, and that didn't bring the bears out of their caves either.
The weekly chart is thus rather neutral in its implications, but given the non-refusal (by and large) of the move above the early June highs, I still interpret the chart as bullish rather than bearish.
One close below the line connecting the early June highs, doesn't make a breakout invalidation yet. It lack rising volume, and the noticeable lower knot also makes it suspicious.
As the bulls nibble at the late-Feb bearish gap, I expect them to overcome it eventually. Especially since all eyes are on the stimulus to counter the harsh economic realities of many real economy sectors.
Such were my Friday's words regarding the days finishing in the red:
(...) Earlier in July, we have also experienced an odd bearish day that brought out the bears from their caves, without really changing the situation on the ground materially.
I expect the same dynamics to play out this time as well, regardless of the headlines touting more stimulus details only next week, or Trump discussing the China phase one trade deal value.
Meanwhile, the credit market signals are still pointing largely one way.
The Credit Markets' Point of View
High yield corporate bonds (HYG ETF) reversed their opening weakness, and closed near the upper border of its recent range. Encouraging in itself, the move though lacked convincing volume, which makes the implications less bullish than when viewed with only price action in mind.
The ratios finetune the picture. Both the leading credit market ratios - high yield corporate bonds to short-term Treasuries (HYG:SHY) and investment grade corporate bonds to longer-dated Treasuries (LQD:IEI) paused - with the latter declining. This one-day hesitation has the potential to spill over into upcoming sessions' trading.
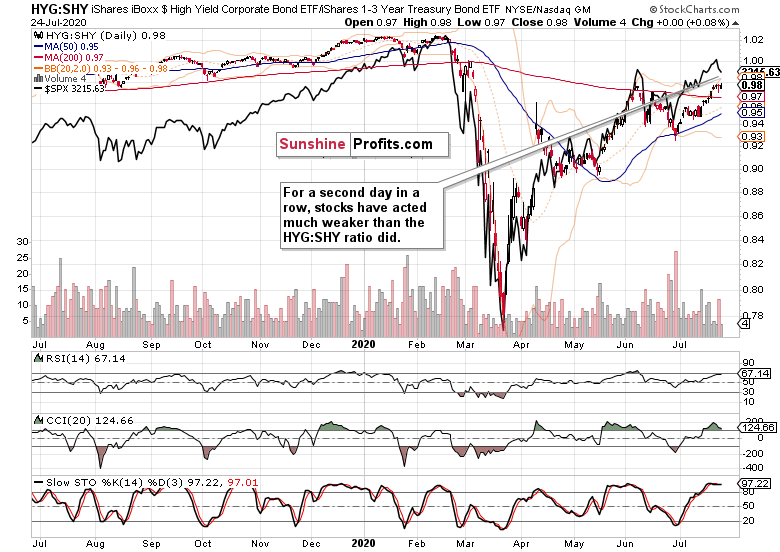
The overlaid S&P 500 closing prices (black line) against the HYG:SHY chart shows just that the pace of stocks' fall, has moderated. With more air out of their relative outperformance seen since late June, the judgmental scope for further declines becomes more limited. Unless the ratio plunges, that is - which is what I don't expect it to do right now.
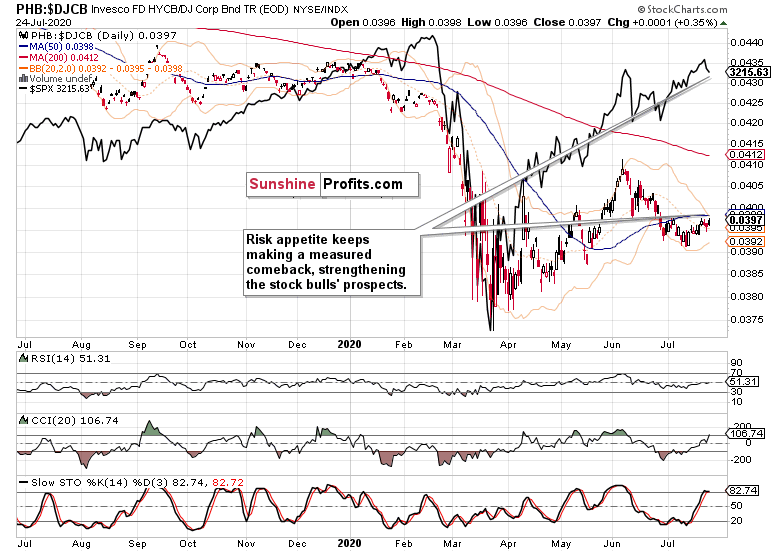
The recovering ratio of high yield corporate bonds to all corporate bonds (PHB:$DJCB) supports the notion of the stock bull having further to run. The sectoral rotation theme stands to benefit from such a dynamic.
Smallcaps, Emerging Markets and the S&P 500 Internals
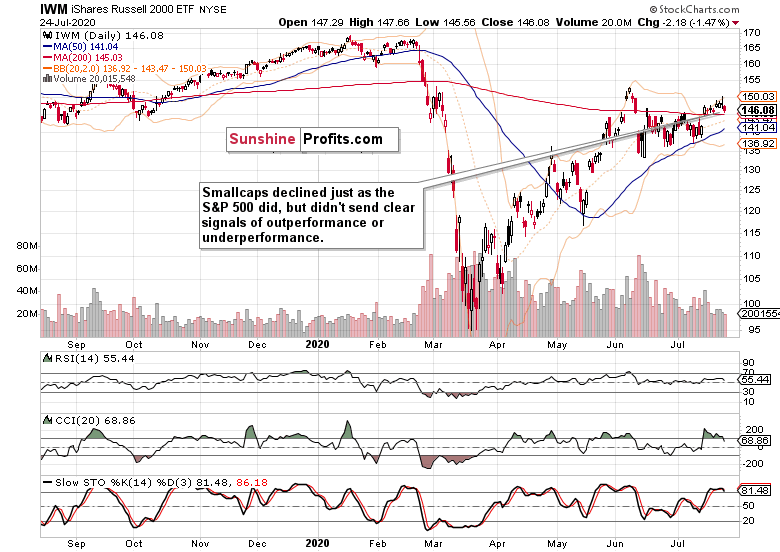
The Russell 2000 (IWM ETF) also fell on Friday, but the daily volume left quite something to be desired. For the bears, that is. As a result, Friday's candle appears to be merely a daily setback.
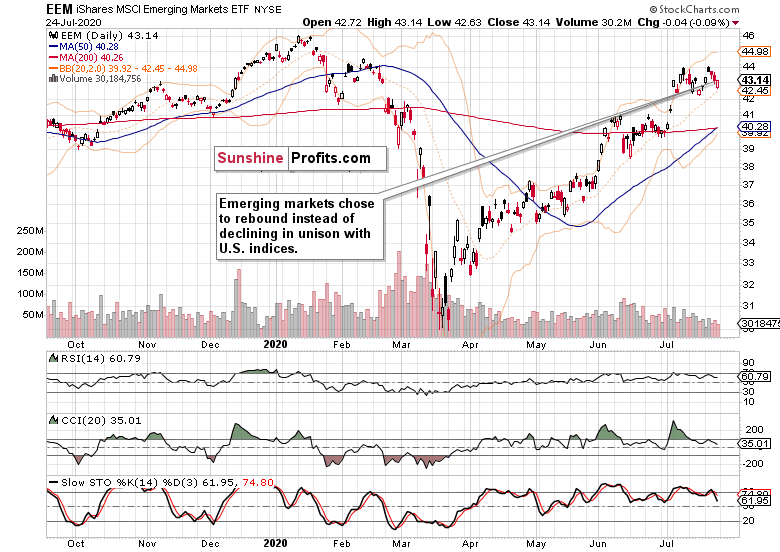
Emerging markets (EEM ETF) proved stronger on Friday, and erased their opening losses almost in full. That's positive for stocks back in the States too - it's a starting point, and obviously more has to follow.
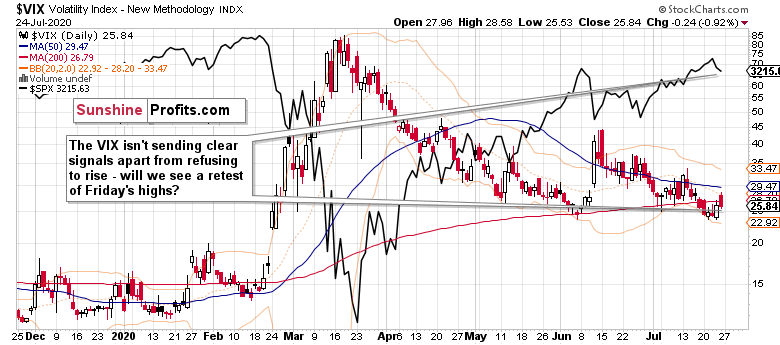
Volatility ($VIX) made an intraday reversal on Friday, though a retest of its opening highs wouldn't be out of the unexpected. This upside bump appears to have a little more to run on the upside, but judging by this chart alone, the stock bull run isn't in danger yet.
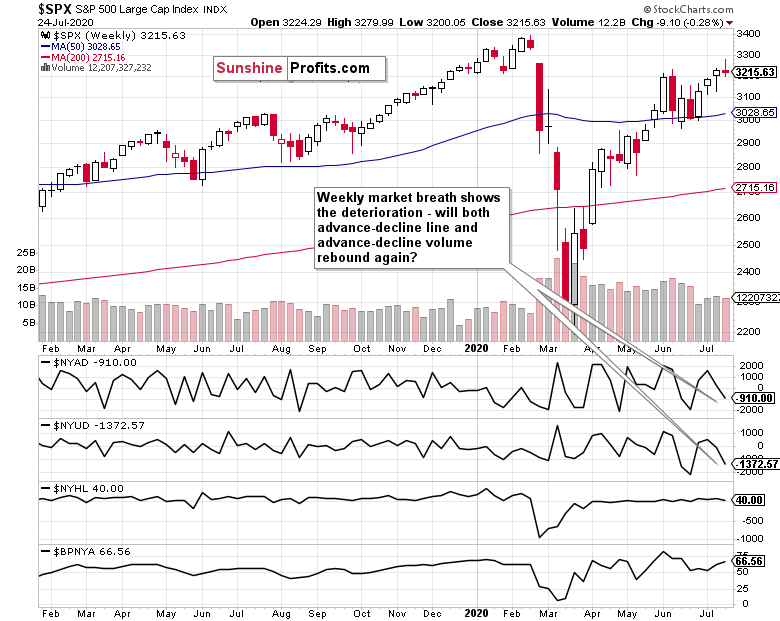
Zooming out, the weekly market breadth provides us with a broader perspective. Please note both the advance-decline line and advance-decline volume having descended into solidly negative values - but the bullish percent index solidly in bull market territory makes a case for an upcoming stock price rebound (perhaps preceded by a bit more base-building).
S&P 500 Sectors in Focus
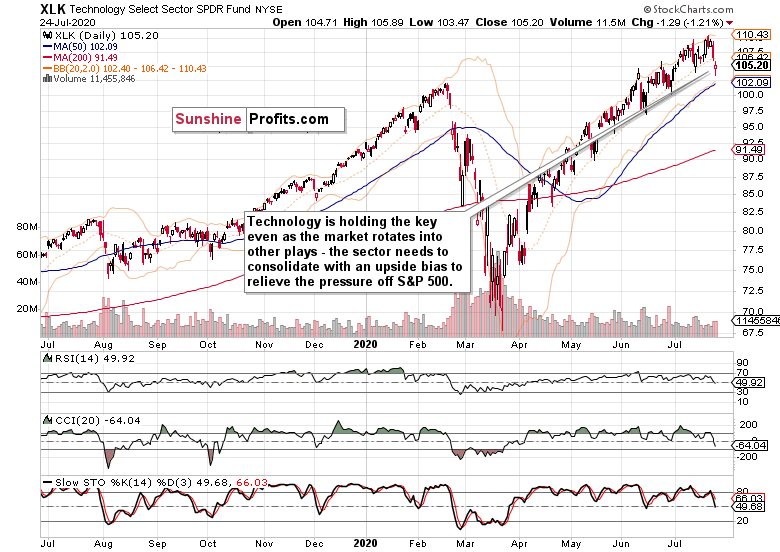
Technology (XLK ETF) holds the key, and not merely in the short-term. On a positive note, it has reversed intraday, closing slightly above its opening values. The rising volume indicates accumulation to me, lending more credibility to the bullish interpretation.
The defining moment though can't be understated. This sector's consolidation with an upside flavor would be very constructive for the S&P 500, as the ongoing rotation into former laggards can't win the day due to weighting.
But the rotational stock bull signs of health are undoubtedly in. I would highlight materials (XLB ETF), healthcare (XLV ETF) and industrials (XLI ETF) as the best of the crowd, followed by the defensive utilities and consumer staples (XLU ETF, XLP ETF respectively). Consumer discretionaries (XLY ETF) are also fighting tooth and nail to keep among the leadership sectors, which is where the heavyweight financials (XLF) are slowly but surely moving too.
Once technology joins in again (or stops standing in the way as a minimum), the stock bull run can go on and leave this soft patch with bullish undertones behind.
Summary
Summing up, Friday's S&P 500 setback hasn't materially changed the optimistic stock outlook, and the balance of signals from related markets still keeps more than slightly favoring the bulls. Technology is the joker, the wild card that would decide the S&P 500 direction in the short run, and either prolong this two-day decline, or let stocks slowly but surely regain their footing, which they seem bound to do still.
Thank you for reading today's free analysis. If you would like to receive daily premium follow-ups, I encourage you to sign up for my Stock Trading Alerts to also benefit from the trading action described - the moment it happens. The full analysis includes more details about current positions and levels to watch before deciding to open any new ones or where to close existing ones.
Thank you.
Monica Kingsley
Stock Trading Strategist
Sunshine Profits: Analysis. Care. Profits. -
Stock Investment Update - S&P 500 Is Knocking on the Doors of Early June Highs
July 20, 2020, 9:43 AMWelcome to this week's Stock Investment Update.
Three doji days in a row, and yet the S&P 500 action is telling. After breaking above the mid-June highs, Friday's close is within spitting distance of the June 8 top. And stocks are primed to overcome it.
It's because they've been consolidating below the resistance without dropping lower meaningfully. While the sentiment has turned greedier, it's still a shadow of the pre-corona days. For the week just in, there is 31% bulls, 45% bears and 24% neutral (AAII data) - hardly a screaming picture of all out greed.
Too many expect a bearish outcome along the double top lines - and there is no shortage of negative catalysts waiting in the wings. But the bets on new stimulus and unemployment impact softened are winning the day. What's the best black swan indicator anyway? Sharply rising USDX - and look where it is instead. Gold isn't getting sold off - there is no liquidity crunch present.
I also look at the healthy rotation into value stocks - into beaten down sectors - amid the froth being taken off in technology. But given the strong leadership from semiconductors, tech is still favored to join the party sooner than those looking at the P/E ratios think. Yes, rotation is what bull markets are made of.
S&P 500 in the Medium- and Short-Run
I'll start today's flagship Stock Trading Alert with the weekly chart perspective (charts courtesy of http://stockcharts.com ):
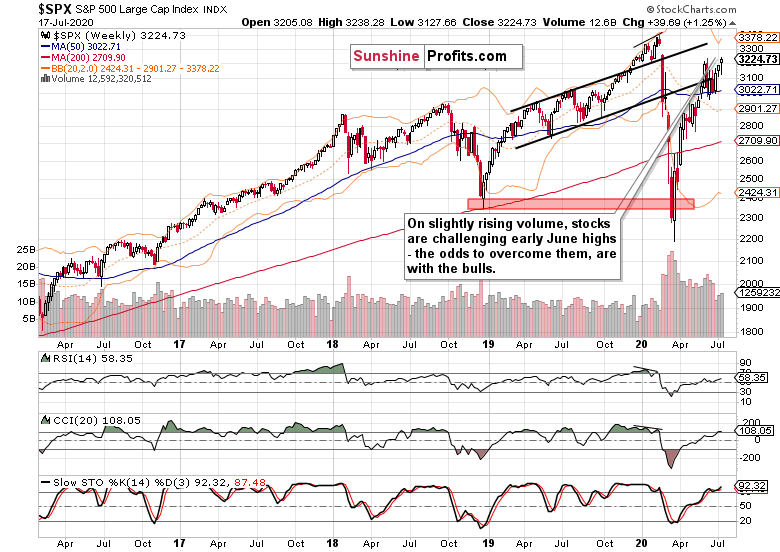
The rebound off the 50-week moving average goes on as the S&P 500 extended gains in the past week. While the weekly volume isn't outstanding, it's still a tad higher than was the case a week ago.
The sizable lower knot of the week just in, got us the hanging man candlestick. That's a bearish pattern indicating exhaustion of the buyers, but considering everything covered in today's analysis, I wouldn't trust it.
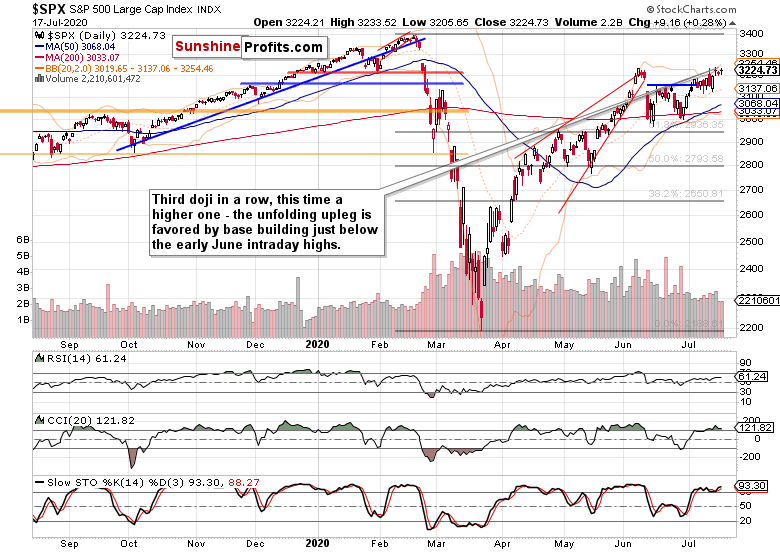
The blue resistance based on mid-June tops has turned into support, and the index is undergoing a healthy consolidation close to the early June highs.
Stocks are just taking their time, in line with my Thursday's thoughts about the potential double top and the selling nearby:
(...) the pressure to go higher is building under the surface in my opinion. I says so because should the bears be willing to sell heavily in the 3220-3230 zone (potential double top area), they would have done so - the fact they haven't been willing to push prices materially lower, is telling by itself.
Yes, the volume behind the upswing off the late June lows hasn't been outstanding, but only prices falling sharply and preferably also on rising volume, would make it a double top.
Prices consolidating just below are a show of latent strength to me. And even more so when I look at the credit markets.
The Credit Markets' Point of View
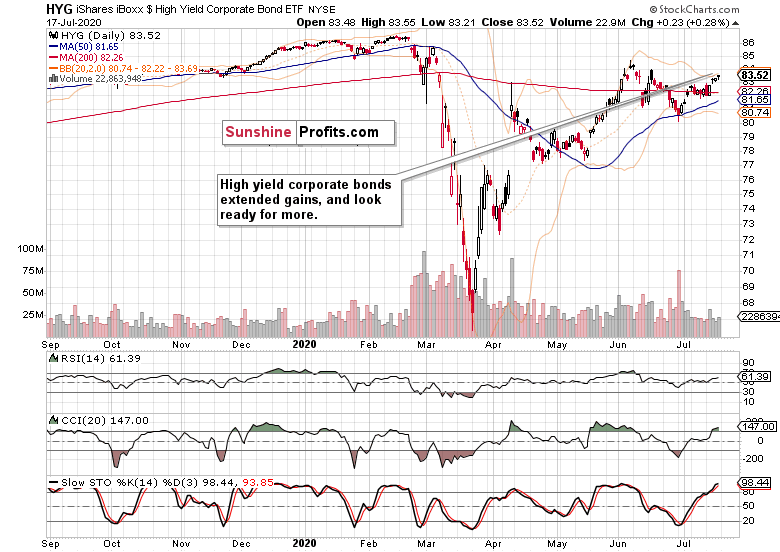
The action in high yield corporate bonds (HYG ETF) is growing increasingly supportive. Friday's doji formed at a higher level, and on increasing volume compared to Thursday. I wouldn't be surprised to see it carry over into Monday's session - the swing structure and indicators support more gains to come.
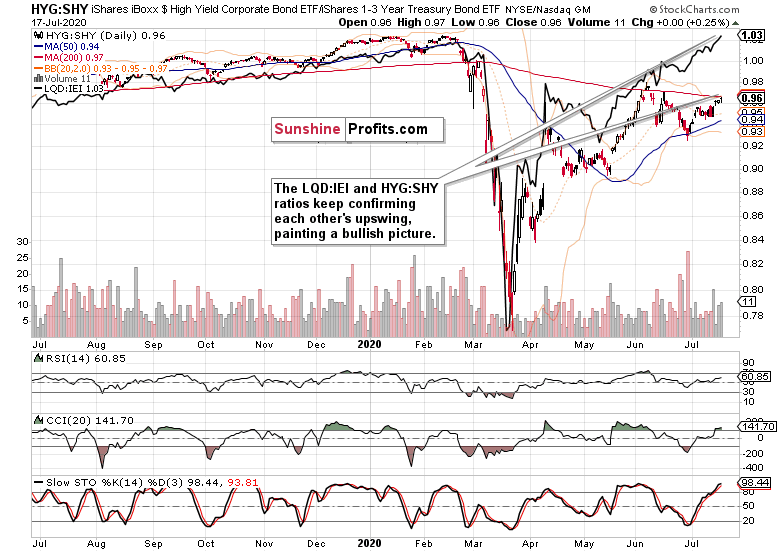
And so do the ratios - both investment grade corporate bonds (LQD:IEI) and high yield corporate bonds (HYG:SHY) keep pointing the same way. Their path of least resistance being undeniably higher, is in tune with more stock gains.
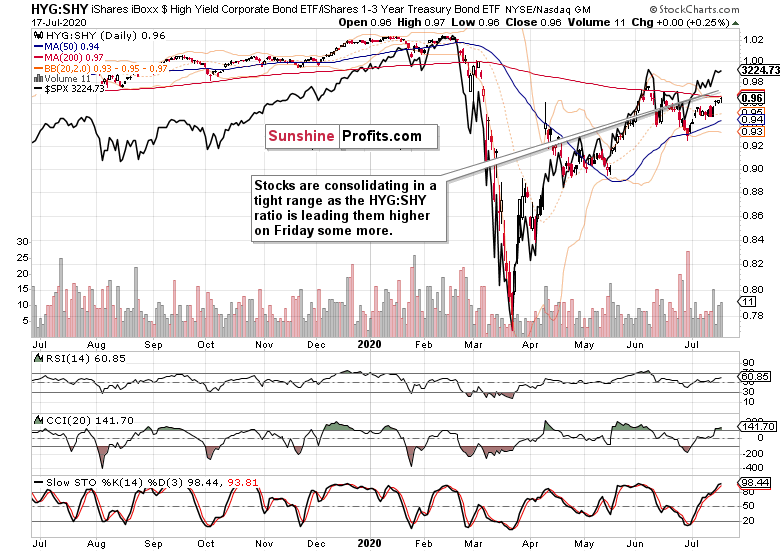
Looking at Friday's dynamic alone, the high yield corporate bonds to short-term Treasuries (HYG:SHY) ratio is gently pushing the overlaid S&P 500 closing prices (black line) to rise. There are no new sudden dislocation striking the eye - the relative momentum in both, is intact. The upswing is merely taking time, and the charts don't scream danger.
S&P 500 Sectors in Focus
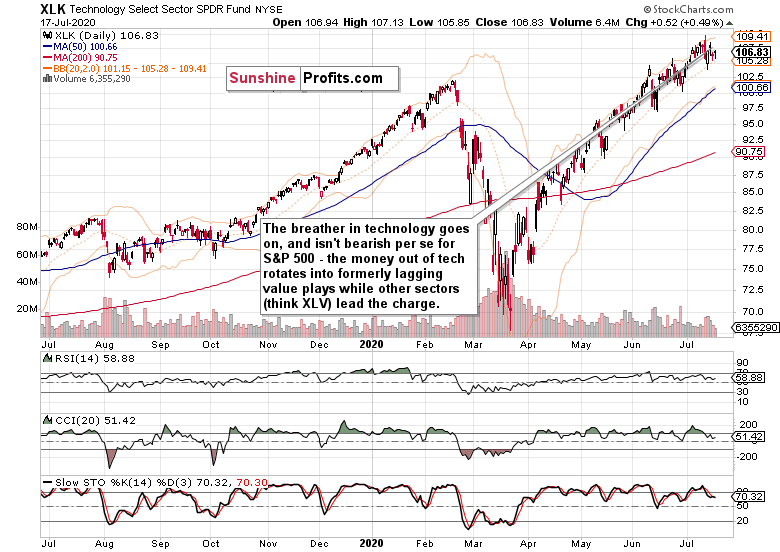
The talk of the tech bubble has helped to take off some froth from the sector with P/E ratios at nosebleed levels. Technology (XLK ETF) isn't breaking down, just looking for a short-term direction in its newfound trading range. It's more likely than not it would eventually break out higher, and timing is the only question as the continuing outperformance in semiconductors (XSD ETF) foretells.
I view this as a healthy development, and even more so given that the tech money isn't leaving the stock market, but moving into other plays. Considered undervalued, or taking the baton, the rotation's winners are many.
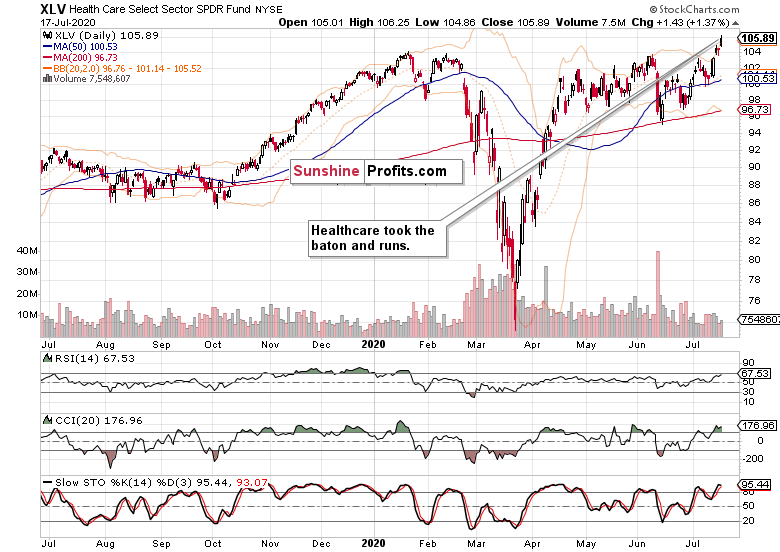
Healthcare (XLV ETF) is taking initiative after a prolonged consolidation following an even sharper rebound off the March 23 lows than technology enjoyed.
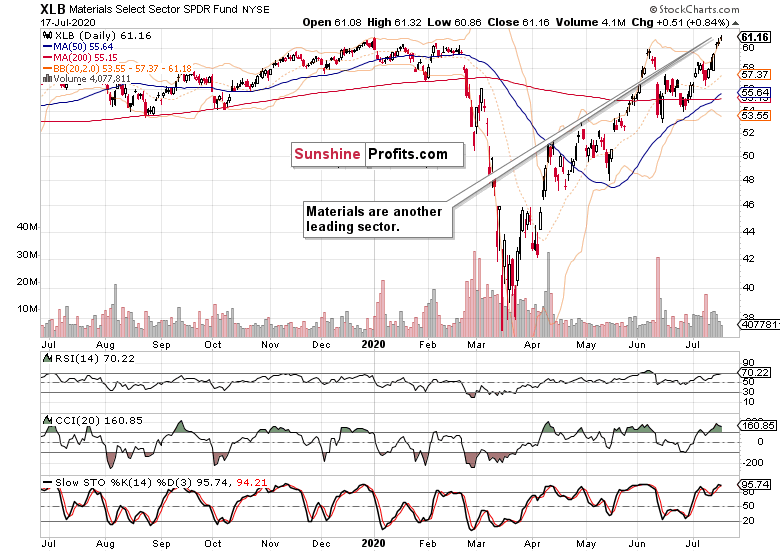
Materials (XLB ETF) are also on fire - and little surprise given the massive money printing. Consumer discretionaries (XLY ETF) are also making new 2020 highs. Even the defensive plays (utilities and consumer staples - XLU ETF, XLP ETF respectively) are seeing gains as market players seek undervalued stock assets instead of moving to the sidelines.
It's been on June 5 precisely, when I made the coming inflation a central theme of the stock bull run in the article Reaping the Early Benefits of Inflation in Stocks. Yes, both the monetary and fiscal stimulus is overweighing the corona shocks that I covered extensively on April 12 in the article S&P 500 in the Aftermath of Fed's $2.3T Backstop.
It's not until we see inflation on the ground making a return that the stock bull would become endangered. The stimulus (existing and in the pipeline) is powerful enough to keep overwhelming the corona aftershocks (and unless lockdowns get out of hand again, the newly incoming shocks too) for a good more than a few months to come.
Corona Panic and Reality
A parting factual look at the corona deaths beyond the CDC-provided declining weekly figures that I featured in the July 9 article The Renewed S&P 500 Upswing Is Coming. Let's see this comparison (chart courtesy of Lew Rockwell and Zero Hedge) between the Spanish flu that killed an estimated 50-100 million worldwide, and corona.
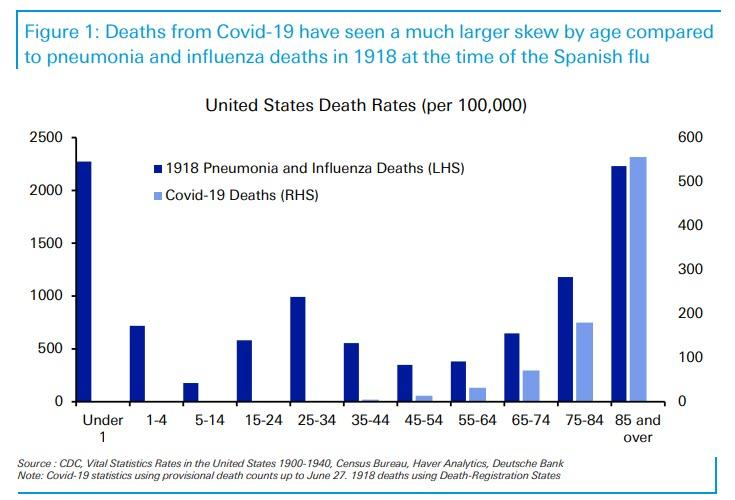
Tell me, which one was more deadly and dangerous? The country was at war, and there were no lockdowns, and the ability to make a living wasn't crippled. People just strove to be productive, and were responsible about doing so.
Summary
Summing up, the S&P 500 is ready for more gains, and the sentiment isn't excessively greedy as the put/call ratio shows. Smallcaps (IWM ETF) are joining in, emerging markets (EEM ETF) are doing great, and the healthy rotation within S&P 5000 sectors is on. The dollar again rolled over as I called for it to do, pointing out that the shelf life of whatever disturbances (think China, corona fear politics) is probably very temporary.
The following verbatim quote from my Friday's summary rings true also today. Yes, I think the 3230ish area will be overcome - and I say forget the barrage of negative news and look instead how the markets are just shaking them off. That's a strong bull run to me, higher in the face of negative news or the Fed on pause. Read the charts, follow the money - the signs of something fishy will manifest themselves well ahead. For now, the overall path of least resistance in the S&P 500 remains higher.
Thank you for reading today's free analysis. If you would like to receive daily premium follow-ups, I encourage you to sign up for my Stock Trading Alerts to also benefit from the trading action described - the moment it happens. The full analysis includes more details about current positions and levels to watch before deciding to open any new ones or where to close existing ones.
Thank you.
Monica Kingsley
Stock Trading Strategist
Sunshine Profits: Analysis. Care. Profits. -
Stock Investment Update - The Brightening Outlook for S&P 500 Bulls
July 13, 2020, 9:26 AMWelcome to this week's Stock Investment Update.
I doubted that Thursday's downswing was a shot across the bow courtesy of the bears, and instead laid out the case for why the stock upswing is likely to renew itself when I looked at the big picture. And so far, the stock bull run remains intact, regardless of all the non-confirmations out there.
As always, I'll lay out the facts in search of market's upcoming direction, and they still lead me to think that the stock uptrend has more chances of continuing than not.
The bulls are prevailing in the clashing narratives and facts on the ground:
(...) I say so despite the uptrend in new U.S. Covid-19 cases that has many states stepping back from the reopening, rekindling lockdown speculations. I say so despite the Fed having its foot off the pedal in recent weeks, which makes for more players looking at the exit door.
Treasuries aren't relenting. It's corona vaccine and expensive treatment hype against fear. Fear of surging cases and lockdowns that would derail the fragile real economy even more.
Just as I wrote in Friday's Stock Trading Alert:
(...) Central banks are standing ready to act, and money printing remains in our future. The greatest real policy risks I see, concern lockdown miscalculations and new stimulus measures.
Any corona progress hopes lift up the cyclicals, and it isn't just the tech, healthcare or materials that are having a good day. There is no mad rush into dollars, just into selected U.S. sectors and Treasuries. Greed is rising but isn't at extremes. The stock bull isn't breaking down - there is no sign of it.
Let's dive right into the S&P 500 performance.
S&P 500 in the Medium- and Short-Run
I'll start today's flagship Stock Trading Alert with the weekly chart perspective (charts courtesy of http://stockcharts.com ):
After the prior rebound off the 50-week moving average, the S&P 500 extended gains in the past week. The weekly volume has encouragingly improved, if ever so slightly. Couple that with the weekly indicators though, and that still isn't enough to call the chart unequivocally bullish.
Bullish, yes. That's part of the anticipated rocky ride through the summer. Elections uncertainty isn't rocking the markets as much as when November 3 comes knocking on the door. Real economy rebound, employment data, and corona policy responses will play a greater role these weeks.
All in all, the weekly chart is bullish-to-neutral in its implications.
If the second peek above the horizontal line connecting mid-June tops didn't stick, perhaps the third one will. The volume print doesn't help deciphering that, but chances are the strong runup to Friday's closing bell would carry over into Monday's session.
Still, the current dynamics reminds me of the S&P 500 taking on the late April and early May highs. After a prolonged consolidation with stocks trading more often than not above the resistance, the S&P 500 just spurted higher one day. Chances are we'll see history repeated.
Credit markets support this assessment.
The Credit Markets' Point of View
High yield corporate bonds (HYG ETF) quickly overcame the weak selling wave, and marched higher throughout the regular session. After the flag-like consolidation, the upswing looks ready to go on, regardless of not spectacular volume on Friday.
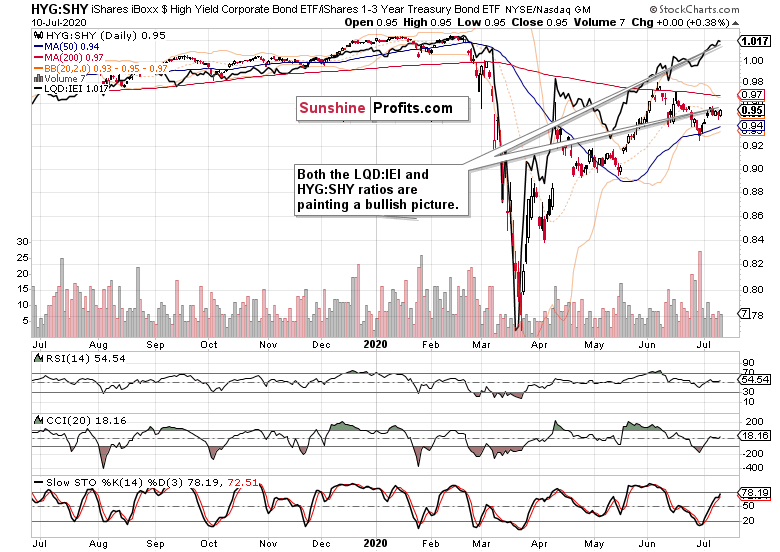
Both the high yield corporate bonds to short-term Treasuries (HYG:SHY) and investment grade corporate bonds to longer-dated Treasuries (LQD:IEI) are positioned supportively for the stock upswing to continue.
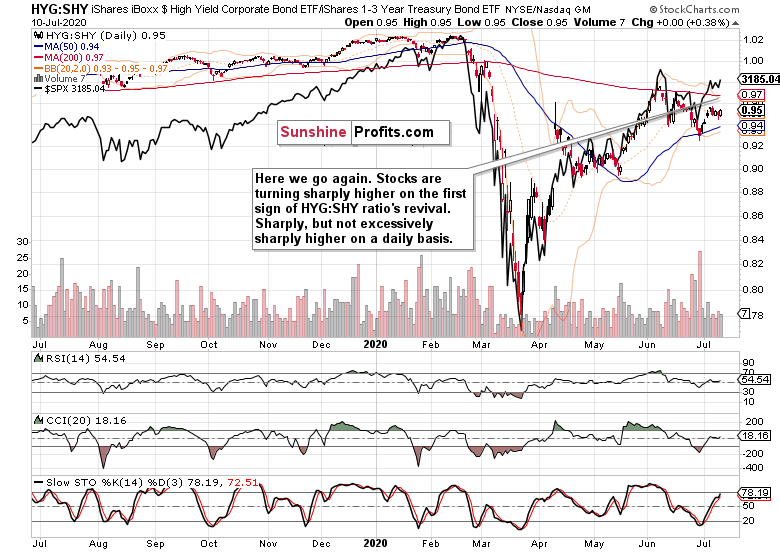
And as you can see on the HYG:SHY chart with the overlaid S&P 500 closing prices (black line), stocks aren't getting ahead of themselves any more dramatically since their late June upside reversal.
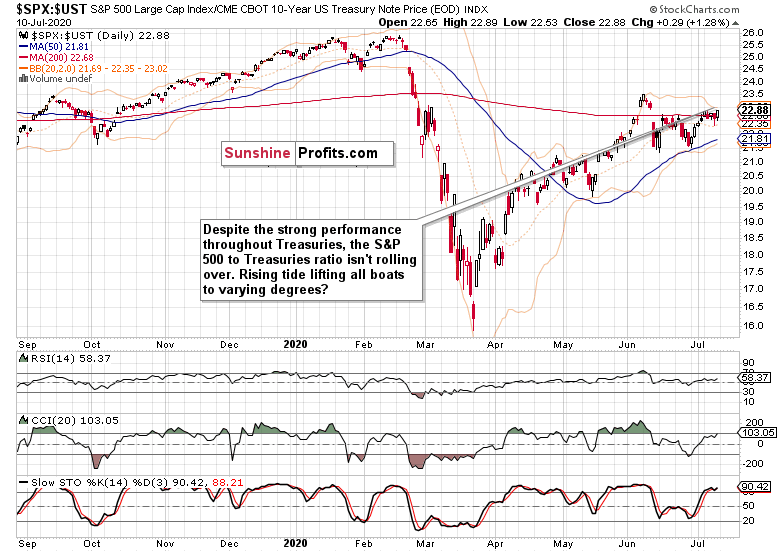
The stocks to Treasuries ratio ($SPX:$UST) isn't breaking down, far from it. Risk appetite is making a comeback into the market place, as the junk corporate bonds to all corporate bonds (PHB:$DJCB) ratio's unwillingness to decline any more in the short run is also hinting at.
As said on Friday, credit markets are telling me that the sky isn't falling:
(...) should I see it start to, I'll change my mind and let you know about it. With the Fed waiting in the wings, the path of least resistance remains higher. And don't forget about the infrastructure bill or the second stimulus check either.
Some More on Stocks, USDX and Copper
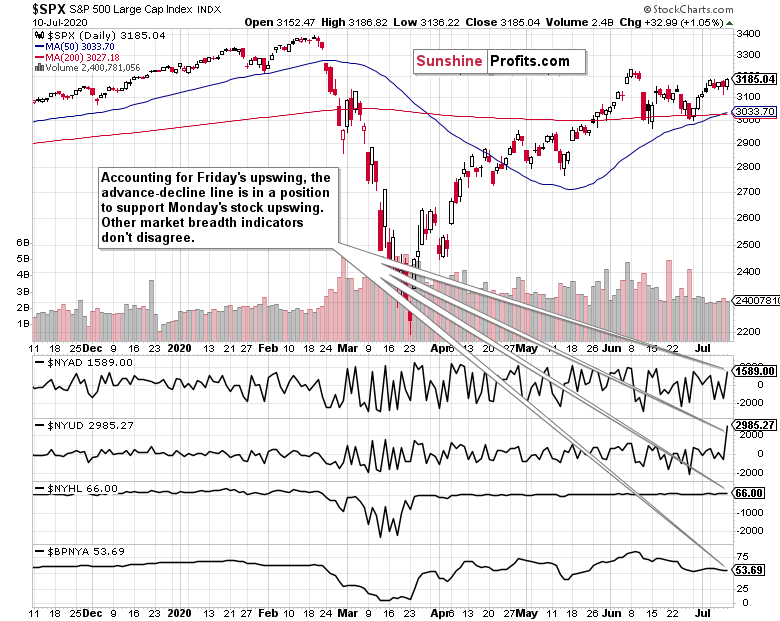
The daily market breadth indicators are still positioned constructively for the upswing to continue. They're not disagreeing or pointing to a changing character in the market. Yes, people might be looking suspiciously on liquidity-driven rallies, and the pace of money creation is truly unprecedented.
But such a rally can go on longer than thought. Equally so, the subsequent reversal might come in as really sharp. Do we see such froth currently? Not yet.
The Russell 2000 (IWM ETF) underperformance goes on, and Friday's upswing isn't a game changer. But such underperformance can go on for months while both indices march mostly higher, which is what I think comes next.
The greenback isn't flashing a warning sign of a deflationary squeeze ahead, and that's conducive for risk assets. Had I seen rising Treasuries, rising dollar, and wavering stocks - that would be a different cup of tea entirely.
There is the China recovery, there are issues at copper-producing nations and mines. But gold is holding up greatly, and generally rising since the March liquidity crunch. Even as it's over $1800, copper is doing greatly too! Just as emerging markets (EEM ETF) are.
The copper-to-gold ratio has risen considerably. Does the red metal smell economic recovery fueled not merely by the electric car mandates? I think that the ratio's performance is a gentle nod in favor of the stock bull run to continue.
From the Readers' Mailbag
Q: First off. you're the reason I subscribed to Sunprofits, your team analysis are well thought through, it's just read and relax. Speaking of fundamentals, looking at Change in EPS vs Change in Price for Q2. Do we have to wait for a wave of bankruptcies before dot-crash II happens? Are the trends similar?
A: Thank you for the appreciation, it's great to know my analyses are helping you! P/E ratios as a prominent decision-making tool rise in prominence for long-term investors. As I seek to capture short- and medium-term moves, they're less useful on a daily basis. And the same goes for their quarterly comparison. As I wrote recently, it's the P in P/E that counts for more, which in other words means that it's about the price charts.
Bubbles can go on for longer than most people think, and the same is true for the current Fed-has-our-back one. Corporate bankruptcies are rising already, yet the S&P 500 marches higher regardless of most stocks trading below their 200-day moving averages. It's hard to say what would be the catalyst, the pin if you will, that will prick the current stellar rise off the March 23 lows. It might coincide, precede, or lag behind the anticipated wave of bankruptcies you mention - and of course, it depends upon how one defines a wave exactly.
But this pricking doesn't need to happen in Q2. I still think that we'll take on the S&P 500 Feb highs this year, and stand a good chance of overcoming them before 2020 is over.
Summary
Summing up, Friday's upside reversal is giving the stock bulls the anticipated upper hand in the short-run, which is in line with the medium-term assessment too, Credit markets are supporting the stock upswing, and appear likely to do so even more in the near future. The Russell 2000 underperformance is amply outweighed by the S&P 500 market breadth, dollar's weakness and surging emerging markets and copper. The breakout above the short-term resistance formed by the mid-June S&P 500 tops has thus good prospects of succeeding shortly.
If you enjoyed the above analysis and would like to receive daily premium follow-ups, I encourage you to sign up for my Stock Trading Alerts to also benefit from the trading action described - the moment it happens. The full analysis includes more details about current positions and levels to watch before deciding to open any new ones or where to close existing ones.
Thank you.
Monica Kingsley
Stock Trading Strategist
Sunshine Profits: Analysis. Care. Profits.
Free Gold & Stock Newsletter
with details not available
to 99% investors
+ 7 days of Gold Alerts
+ Mining Stock Rankings
Gold Alerts
More-
Status
New 2024 Lows in Miners, New Highs in The USD Index
January 17, 2024, 12:19 PM -
Status
Soaring USD is SO Unsurprising – And SO Full of Implications
January 16, 2024, 8:40 AM -
Status
Rare Opportunity in Rare Earth Minerals?
January 15, 2024, 2:06 PM

