

-
Administrative Announcement
September 14, 2020, 3:55 AMThere will be an approximately two-week break in the regular publication of Stock Investment Updates.
We apologize for this inconvenience, and we sincerely hope that the profits you made thanks to our Stock Investment Updates in the previous weeks and months will make this short break endurable. Once again, we’re sorry for this inconvenience and we thank you for your understanding and patience.
Thank you.
Przemyslaw Radomski, CFA -
Stock Investment Update - Correction or Reversal? Cast Your Votes!
September 8, 2020, 12:01 PMWelcome to this week's Stock Investment Update.
The bears pushed hard also on Friday, but couldn't close near the daily lows. Has the bid returned, and the correction is over now? Given Friday's lower knot and Monday's upswing, it might seem so. How does today's premarket downswing fir in the picture then?
But the key thing is that the bull is alive and well. As long as money will keep being redeployed into other stocks from those that take it on the chin during any correction (such as tech stocks during this one), the bull is far from a top.
That's the power of rotation, as money moves from red hot tech into value plays (with financials perhaps also springing to life at one point - when if not now as yields are rising).
Let's move to the charts.
S&P 500 in the Medium- and Short-Run
I'll start today's flagship Stock Trading Alert with the weekly chart perspective (charts courtesy of http://stockcharts.com ):
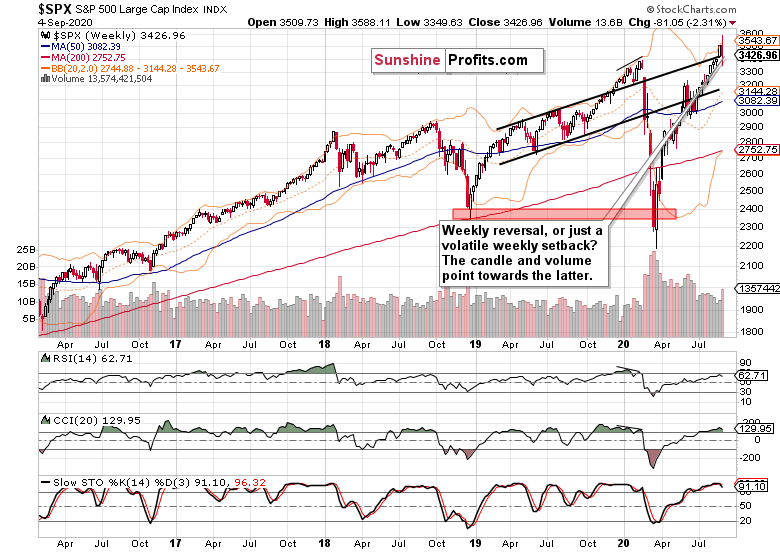
After breaking above the upper border of the rising black trend channel still in August, stock prices retraced that move all the way back. On increasing volume, the bears even pierced this level, but were rebuffed.
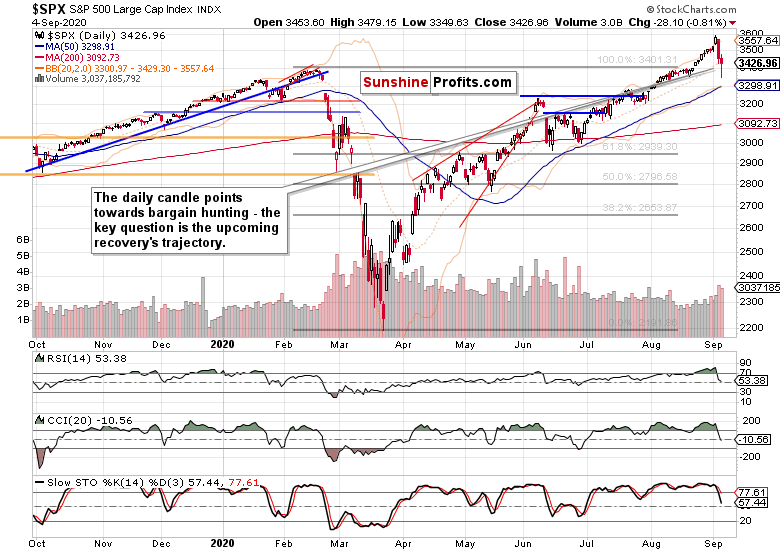
The daily chart appears constructive for the buyers in the short run. On rising volume, much of the downswing was erased, paving the way for the bulls to try their luck next. But I still see the bears as likely to return over the next few session, offering the bulls a better entry point than was the case at the very end of Monday (3440).
Such were my Friday's thoughts on the upswing attempt:
(...) the bulls will have to prove that it wouldn't turn out as a dead cat bounce.
The Credit Markets' Point of View
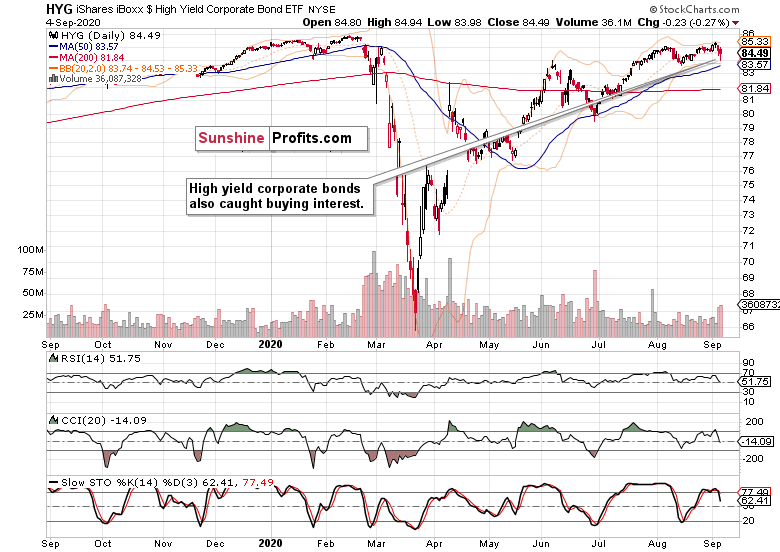
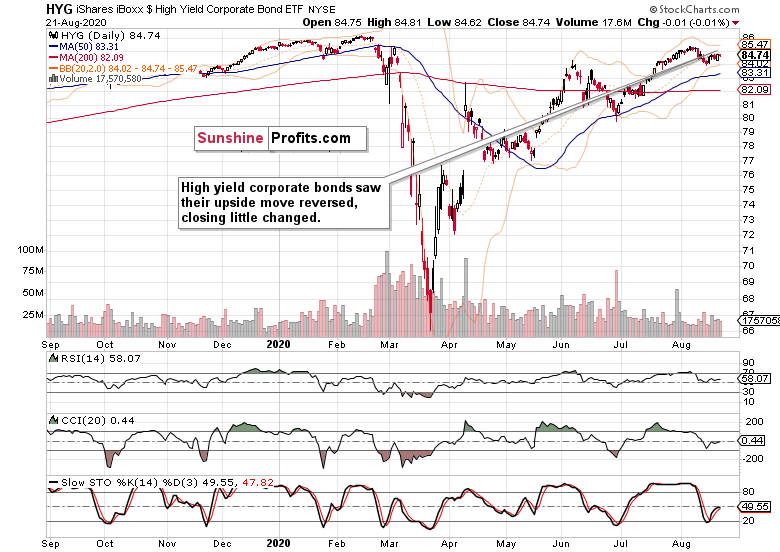
Stocks were not alone in seeing buyers step in - high yield corporate bonds (HYG ETF) did so too. But its lower knot could have been arguably longer, given the S&P 500 performance. Notably, investment grade corporate bonds (LQD ETF) didn't recover during Friday's session at all.
These factors point to a relative indecision in the credit markets as these are unwilling to jump the gun.
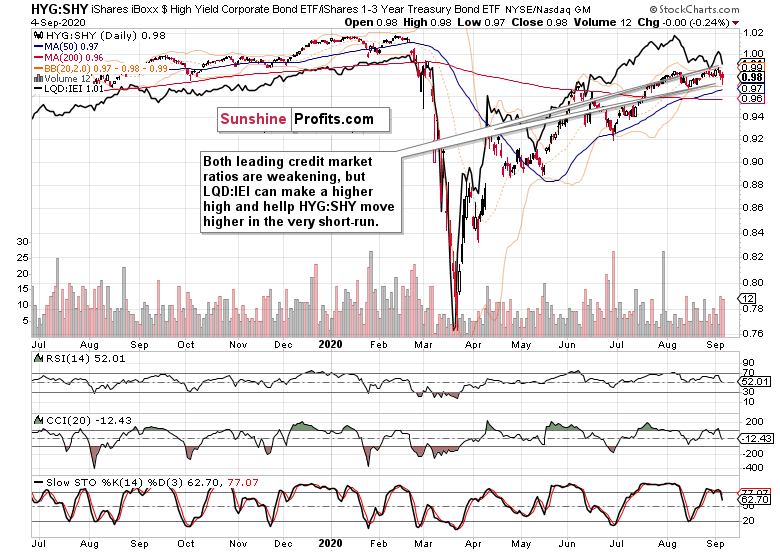
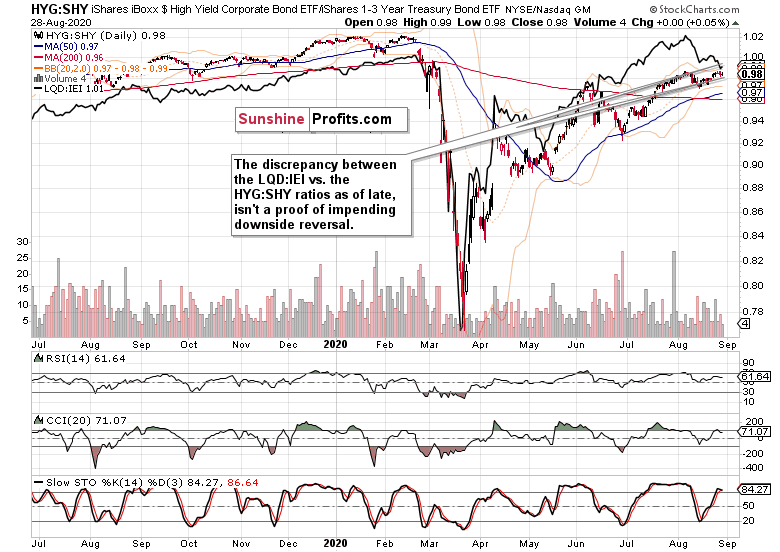
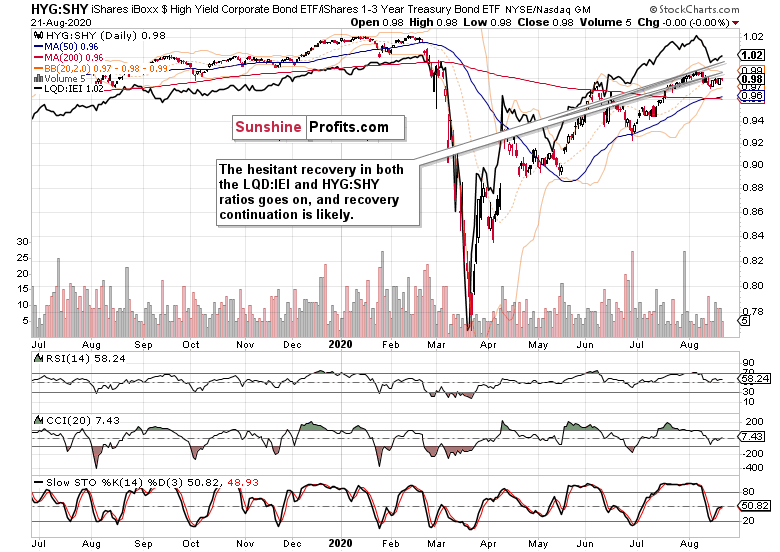
Both leading credit market ratios - the investment grade corporate bonds to longer-dated Treasuries (LQD:IEI) and high yield corporate bonds to short-term Treasuries (HYG:SHY), keep pointing down, but most of their weakness appears to be over for now.
Of course, with the anticipated arrival of the October correction, that will change, but chop with a slightly bullish bias looks as the most probable scenario for September.
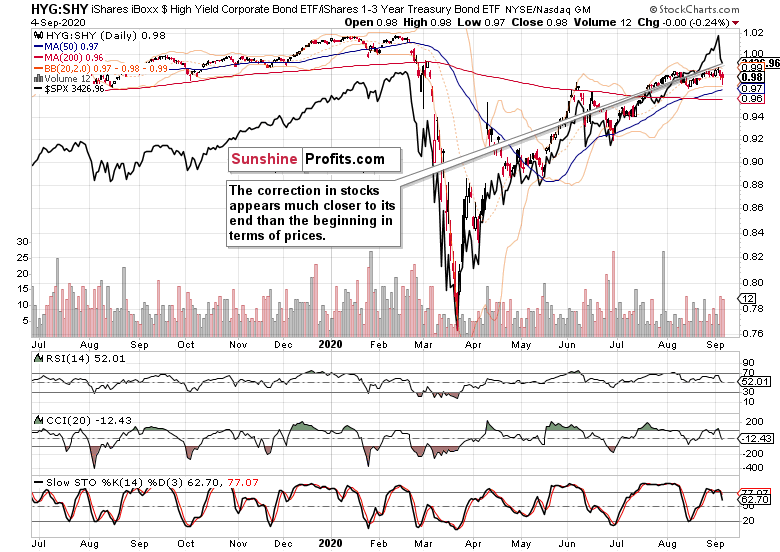
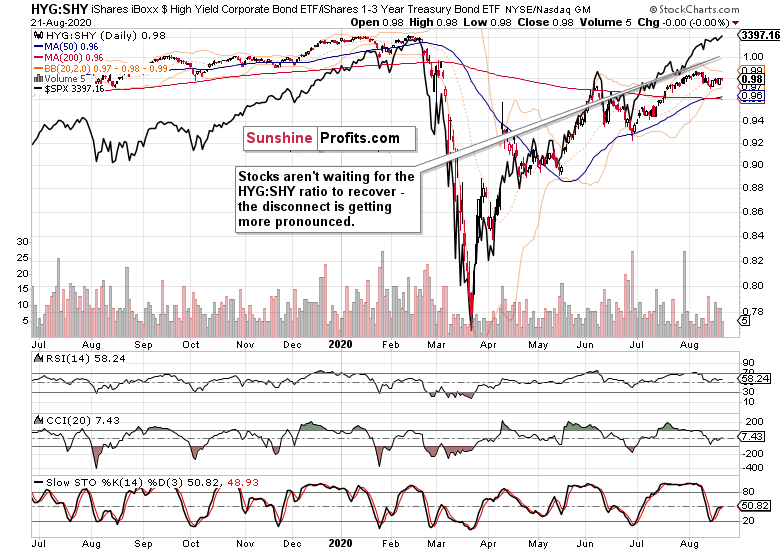
Relative to the high yield corporate bonds to short-term Treasuries (HYG:SHY) ratio's daily performance, stocks have reached short-term comparative valuations making them rather attractive vis-a-vis the key credit market ratio.
Smallcaps, Tech and the Metals
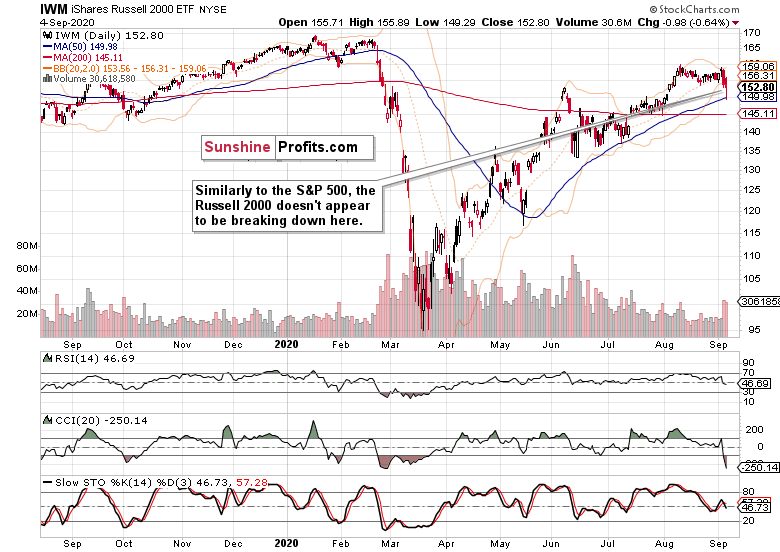
Smallcaps (IWM ETF) mirrored the S&P 500 resiliency, and likewise erased much of the downswing. No sign of distribution here - and while underperforming, the Russell 2000 doesn't disprove the stock bull run.
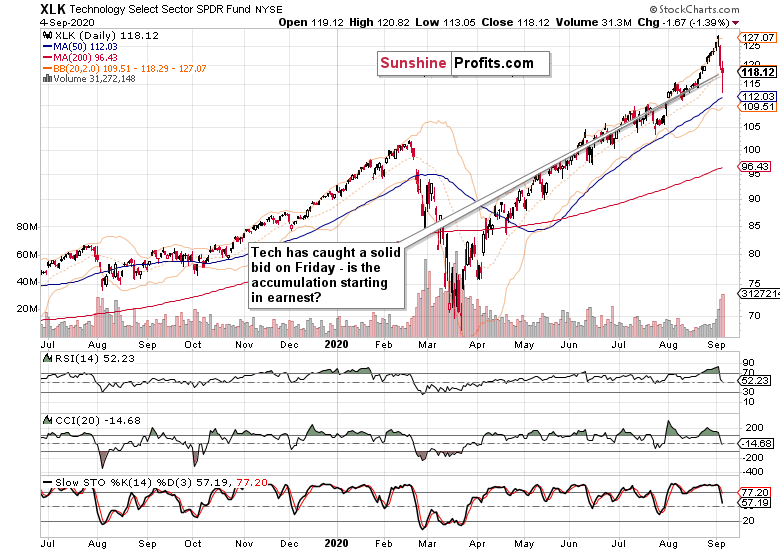
Technology (XLK ETF) strongly rebounded off the deep intraday lows, and the volume shows the extent of the bulls' commitment. The sectoral correction has been healthy, and I expect tech to go on a slow recovery over the coming days and weeks.
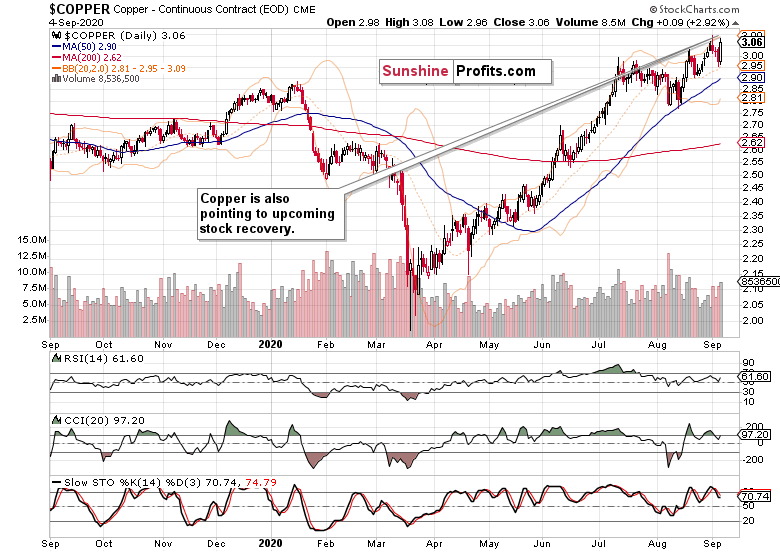
Copper continues its own grind higher, and its chart is bullish. That points to the economy being in a recovery, however slow and uneven that is.
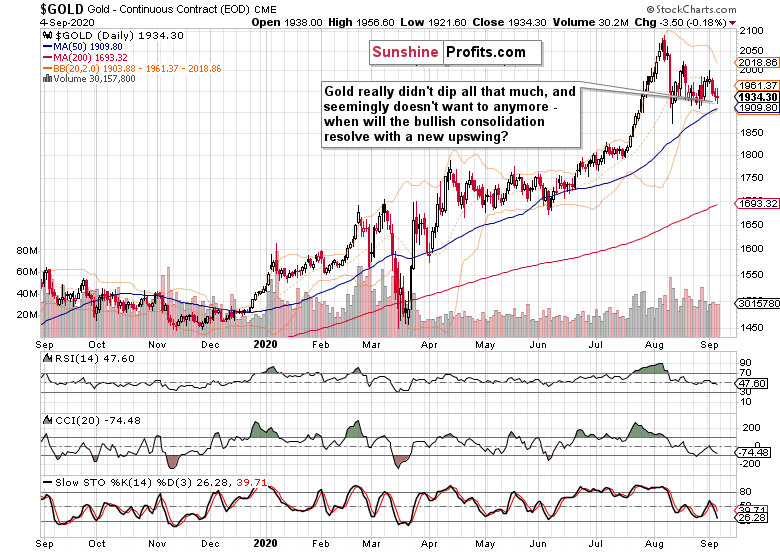
Finally, gold remains in its bullish consolidation, and it's my opinion that it would attempt to extend the early summer gains once the floor in the U.S. dollar probes lower values again. This might take time though, as I look for USDX to spike higher first - quite a few bullish divergences have formed there, and will likely play out over the coming weeks.
Given the weakening oil ($WTIC), that would be little surprising, and actually fitting the October correction hypothesis. No markets go up or down in a straight line, and neither the dollar nor the yellow metal, are an exception.
Summary
Summing up, the bulls' complacency was shaken to the core, and the extreme greed sentiment readings are history. The put/call ratio has though barely budged, which is hinting at the correction likely having a bit longer to run, at least in terms of time. The advance-decline line has ticked higher, pointing to a likely upswing attempt right next - and we saw that yesterday. The weekly advance-decline line though could still have a way to go before reaching the June extremes - but this can wait for October to happen.
The key takeaway is though that we have seen a sharp correction, and not a reversal. In such circumstances, trading decisions remain a question of the risk-reward ratio, and one's willingness to let the dust settle for a moment first.
Thank you for reading today's free analysis. If you would like to receive daily premium follow-ups, I encourage you to sign up for my Stock Trading Alerts to also benefit from the trading action described - the moment it happens. The full analysis includes more details about current positions and levels to watch before deciding to open any new ones or where to close existing ones.
Thank you.
Monica Kingsley
Stock Trading Strategist
Sunshine Profits: Analysis. Care. Profits. -
Stock Investment Update - The Daily Staircase Rally in Stocks Goes On
August 31, 2020, 8:58 AMWelcome to this week's Stock Investment Update.
Higher stock prices every day - or so it seems. And understandably so, given Fed's inflation tolerance, and regardless of consumer confidence taking an earlier hit. With the stimulus bill still stuck in Congress, the Fed is between a rock and a hard place. The economy appears slowing a bit in its recovery, and more support is needed. It's my opinion that it'll arrive before elections.
Talking elections, I see the aftermath of Kenosha "mostly peaceful" riots as a palpable turning point, bolstering Trump - the law and order candidate. And that takes away from the election uncertainty, from the fear of higher taxation among others. Let's face it - the economy is fragile, and needs stimulus beyond transfer payments to avoid the second dip.
It's usually at least the full month before that date, when stocks get especially vulnerable, so we still have a prospect of slower September ahead, but I look for the month to end in the black.
All right, let's see those narratives in the charts.
S&P 500 in the Medium- and Short-Run
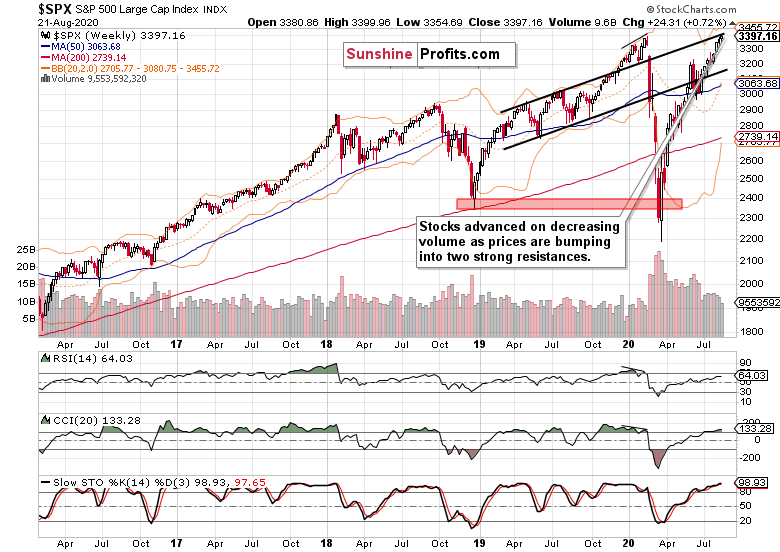
I'll start today's analysis with the weekly chart perspective (charts courtesy of http://stockcharts.com ):
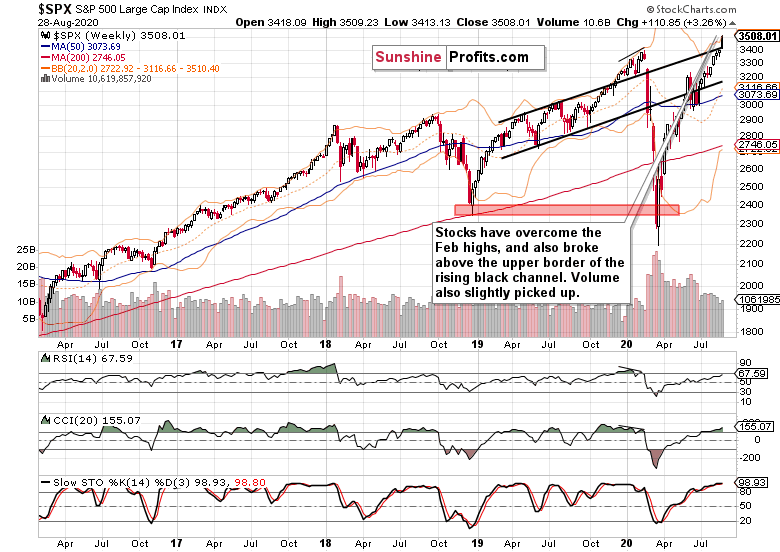
The picture painted is clearly bullish, and both the upper border of the rising black trend channel and the zone around the Feb highs, are done as resistances. Volume is slowly returning, and the extended weekly indicators don't worry me - both the momentum and fundamental reasoning why stocks, is there.
Yes, with the Fed move, I see debt instruments suffering, and a new source of money inflows to power stocks higher.
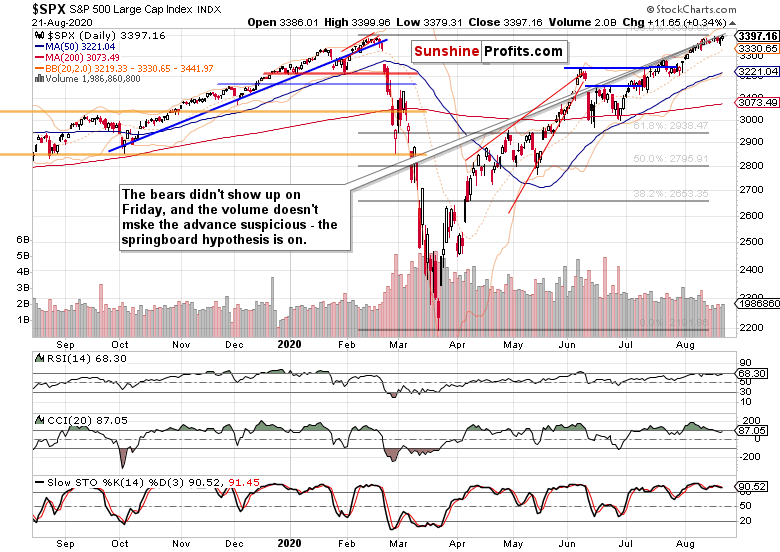
Such were my Wednesday's observations:
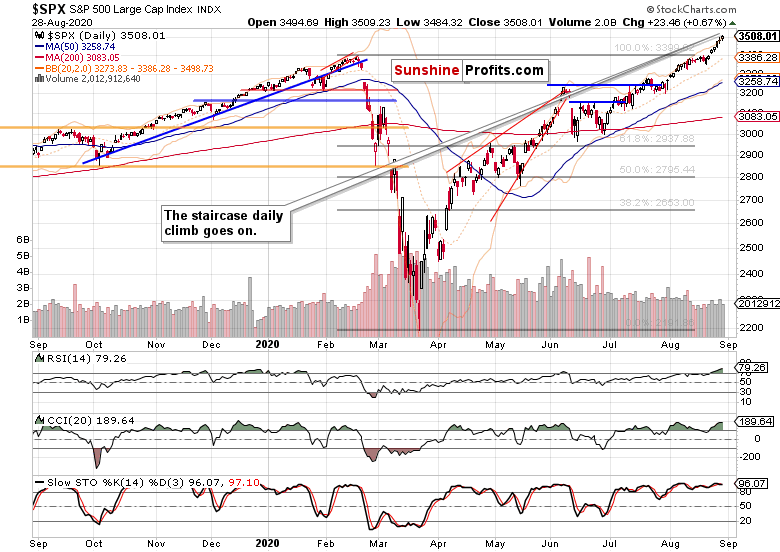
(...) The breakout is now confirmed as the bears haven't really appeared yesterday either. Even though the volume is relatively low, it doesn't detract from the rally's credibility in my eyes - it serves to merely make it less credible for some, while the stock upswing goes on. Until it doesn't, naturally.
But can I call for a top with a straight face, given the price action in stocks? No, the trend remains up - there is no sign of its reversal.
And absolutely, the bull run is alive and well. Day in and day out, stocks are rising, and the volume isn't pointing to any kind of trend reversal. A short-term pause? That will come one day, but won't flip stocks bearish in my opinion.
The Credit Markets' Point of View
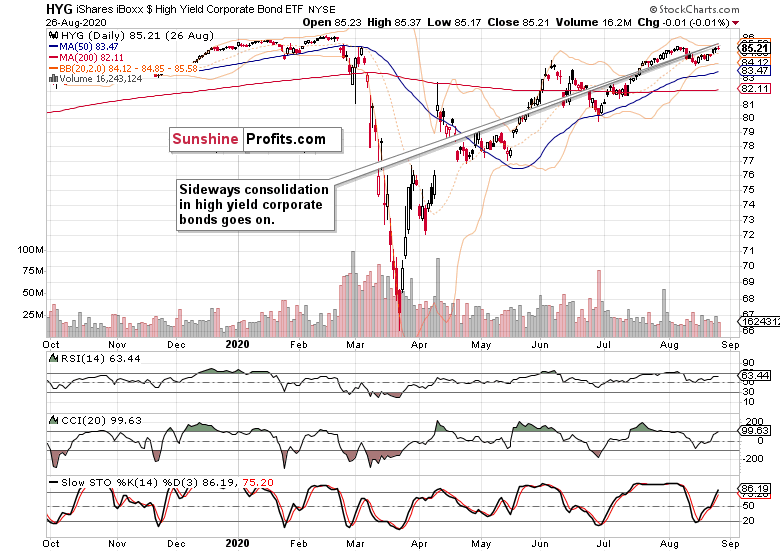
High yield corporate bonds (HYG ETF) still keep going nowhere, but are holding up much better than their investment grade counterparts (LQD ETF). In other words, it's risk-on according to the credit markets.
High yield corporate bonds to short-term Treasuries (HYG:SHY) are holding up much better than investment grade corporate bonds to longer-dated Treasuries (LQD:IEI) - and given the macroeconomic backdrop of the day, I am reading more into the HYG:SHY ratio. Little wonder given that now:
(...) the economy recovery story joins hands with bondholders demanding higher rates to make up for higher expected inflation.
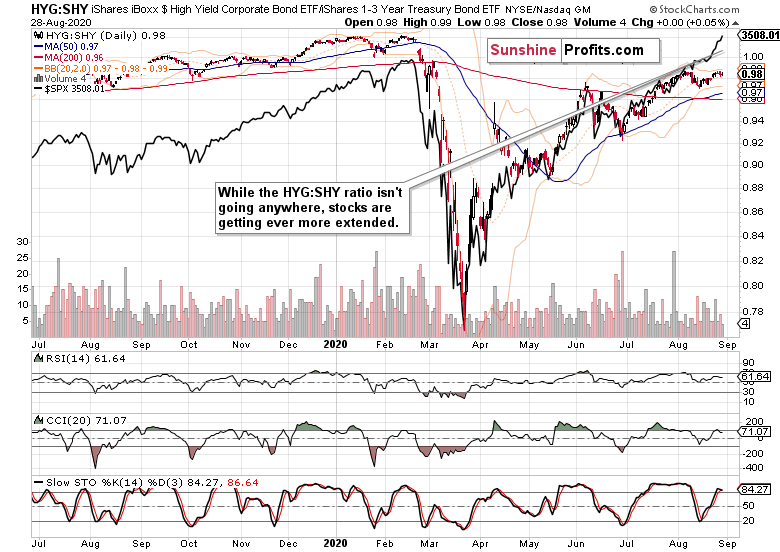
At the same time, stocks getting ever more extended relative to the HYG:SHY ratio, are consistent with the TINA (there is no alternative) shift. While greed is at extreme readings, there are still plenty of bears that haven't capitulated yet.
S&P 500 Market Breadth and Sectoral View
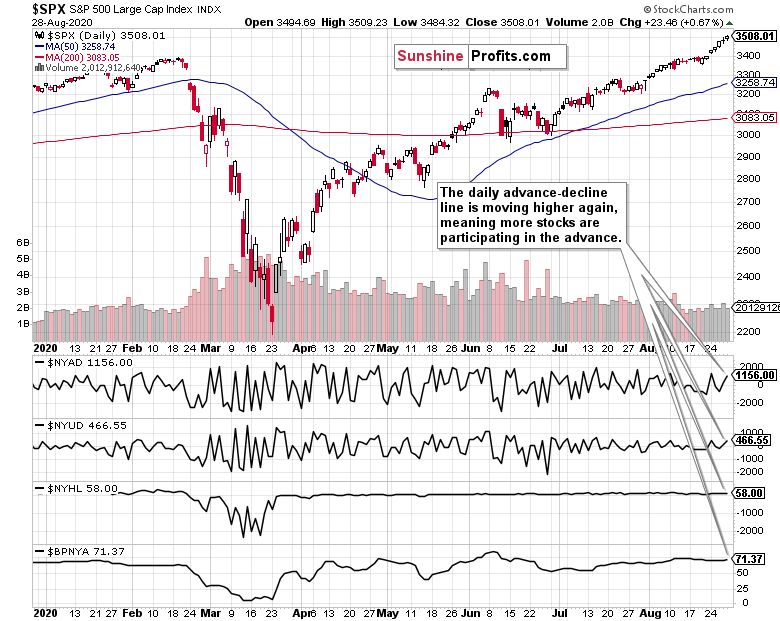
The advance-decline line finally scored a noticeably higher reading, indicating that it's just a little bit less about the tech (or FAANG, have your pick) carrying the torch. Advance-decline volume has risen too, and the bullish percent index remains solidly in a bull market territory.
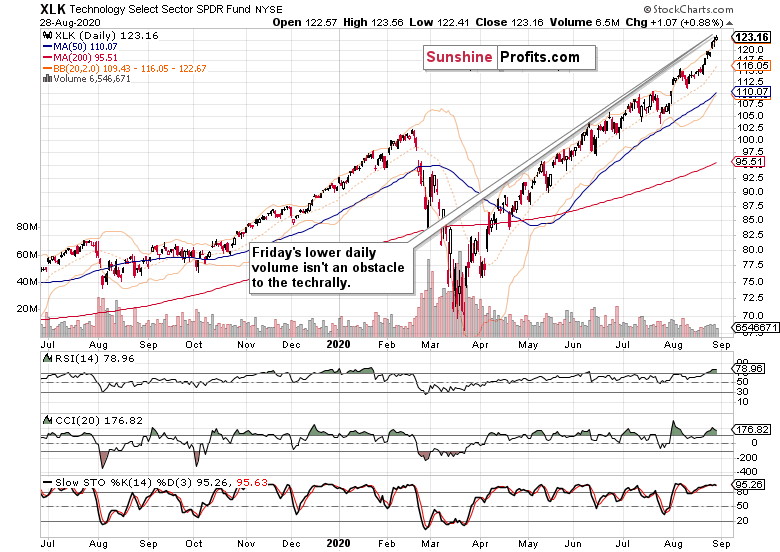
Technology (XLK ETF) keeps powering higher like there's no tomorrow, and the price action is of a healthy uptrend. Well, healthy - steady with hardly a correction. No sign of a top, definitely not in this leading sector.
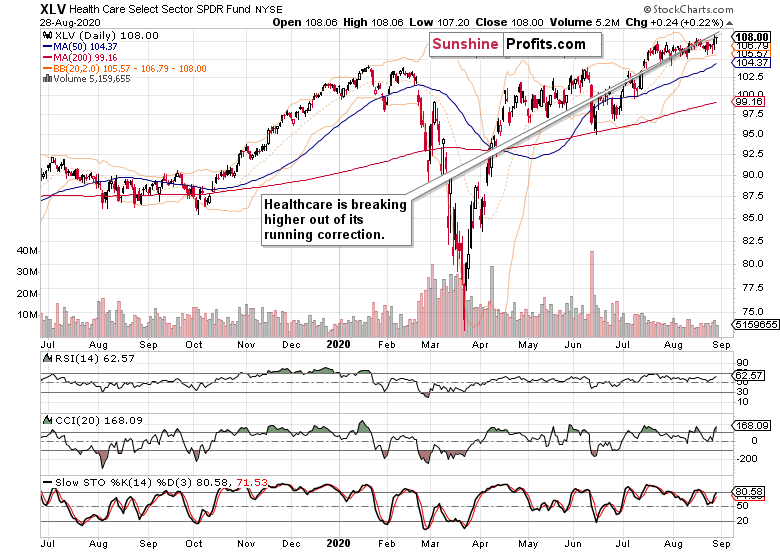
Healthcare (XLV ETF) is on the rise too, as its prices are leaving the prolonged correction. The outlook is naturally bullish.
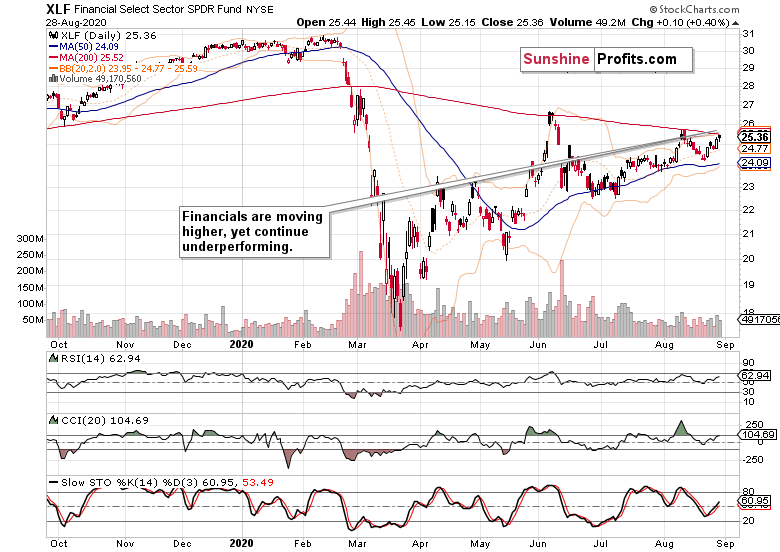
Financials (XLF ETF) typify cyclicals' performance - and that's still one of underperformance. With tech this prominently in the limelight, it's hard to see more than a few bursts of rotation into value plays as tech keeps firmly in the pool position.
Summary
Summing up, the S&P 500 keeps extending gains, and so does the tech sector. Volatility has made a move to the downside on Friday, pointing to little changes in the market character - it's still a bull market run, to put it precisely. The credit markets reflect the risk-on move, and both the top in stocks, and a meaningful correction, appear to be rather far off.
Thank you for reading today's free analysis. If you would like to receive daily premium follow-ups, I encourage you to sign up for my Stock Trading Alerts to also benefit from the trading action described - the moment it happens. The full analysis includes more details about current positions and levels to watch before deciding to open any new ones or where to close existing ones.
Thank you.
Monica Kingsley
Stock Trading Strategist
Sunshine Profits: Analysis. Care. Profits. -
Stock Investment Update - S&P 500 Made Its Case for Higher Stock Prices
August 24, 2020, 10:22 AMWelcome to this week's Stock Investment Update.
Friday's upswing took stocks to the all-time highs again, and the tech sector was in the driver's seat. Healthcare and consumer discretionaries also did well, but that's far from enough as the market breadth indicators keep flashing non-confirmations. And they're not alone.
Non-confirmations can drag on for a long time without ushering in a meaningful correction. They can get less pronounced by a prolonged sideways move in prices. Alternatively, a sharp and temporary correction can arrive with little fanfare. Which way do I see things turning out over the coming weeks?
Wednesday's correction attempt failed without much in terms of a follow-up. That's a point for a continued slow grind higher, or for a sideways consolidation as minimum. In other words, the correction isn't likely arriving very soon - but over the coming weeks, it most probably will. The outlook for days just ahead, looks rather bright to me.
Let check whether this theory holds water.
S&P 500 in the Medium- and Short-Run
I'll start today's analysis with the weekly chart perspective (charts courtesy of http://stockcharts.com ):
While last weeks' bullish price action goes on without end in sight, it's happening on ever lower volume. The bears aren't though willing to step in, which makes higher stock prices likely, regardless of the bulls being stuck at two key resistances (the upper border of the rising black trend channel and the zone around the Feb and recent all-time highs) over the last few days.
The bears missed another opportunity to make a real stand on Friday, and the bulls turned the session around. The volume barely noticeably rose, but still rose - boding well for Monday's session at the very least.
How much did the credit markets support the upswing?
The Credit Markets' Point of View
High yield corporate bonds (HYG ETF) made no progress on the way up. The decreasing volume still paints a picture of a short-term consolidation, which goes well with the bears being unable to reassert themselves.
Another piece in the corporate credit market puzzle are the investment grade corporate bonds (LQD ETF) - and their rise negates the HYG ETF hesitation in my view.
Such were my Friday's observations on the leading credit market ratios:
(...) Both high yield corporate bonds to short-term Treasuries (HYG:SHY) and investment grade corporate bonds to longer-dated Treasuries (LQD:IEI) - rose yesterday The longer they keep the sideways-to-bullish bias, the better the likelihood of their renewed move higher in earnest, and by extension, for stocks too.
After Friday, stocks got even more extended relative to the HYG:SHY ratio. Stocks are clearly willing to rise without taking a cue from this key ratio.
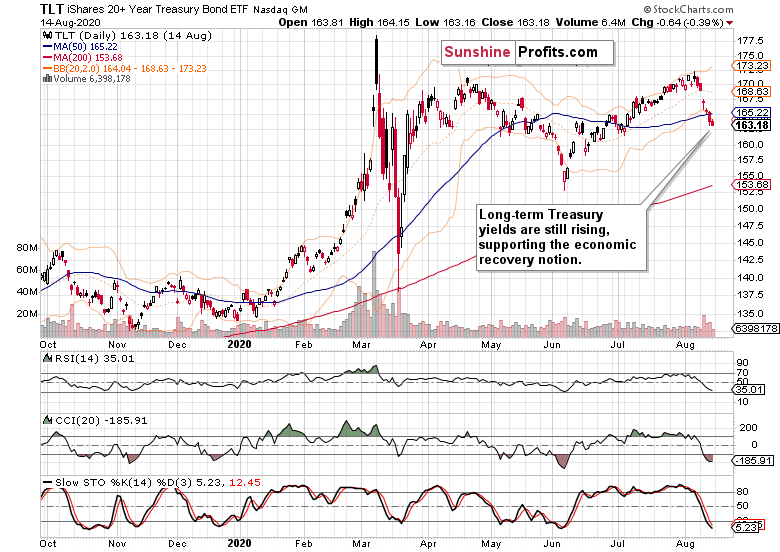
The yields in long-dated Treasuries (TLT ETF) keep rising - or at least, they don't indicate that some flight to safety would be going on. They're underscoring that the wheels of real economy are starting to turn since the late spring horrendous data went on a broad recovery. At their own pace and unevenly, naturally.
S&P 500 Market Breadth and Technology
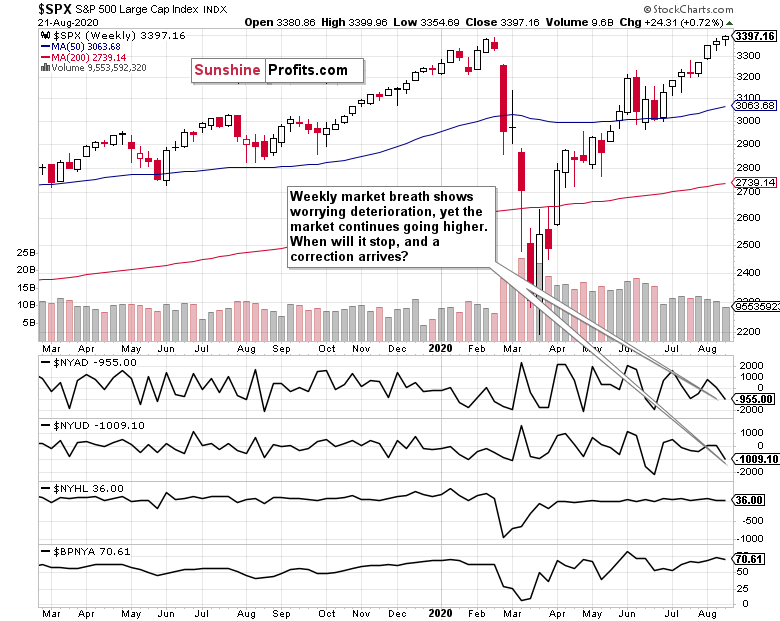
The state of weekly advance-decline line is one big red flag as higher stock prices are supported by less and less advancing issues, advancing volume, or new highs. Even the bullish percent index is weakening a little.
Does it mean the bull market's end is in sight? Absolutely not, but a correction or soft patch wouldn't be totally unexpected. Does the above chart make it imminent? Not. So, what's a trader to do about it?
My favorite approach over the past weeks of such precarious readings, has been tight open trade management with relatively frequent updates of the stop-loss parameters in order to lock in open profits. Unless I attempt to jump in on the brief momentum of the short side, which needn't really always pay off.
The stock tide keeps rising, and I would compare that effort to catching a low in an individual wave, using techniques based also on the short-term market breadth just next.
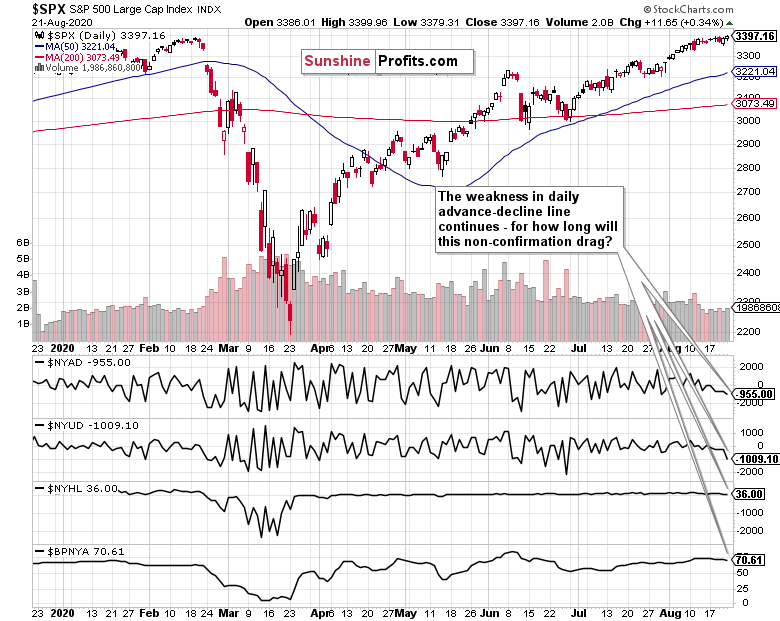
The short-term offers a weakening view of not only the advance-decline line that certainly doesn't confirm the stock upswing. On the other hand, it doesn't m ake a correction imminent - unless the generals leading the stock advance roll over, that is.
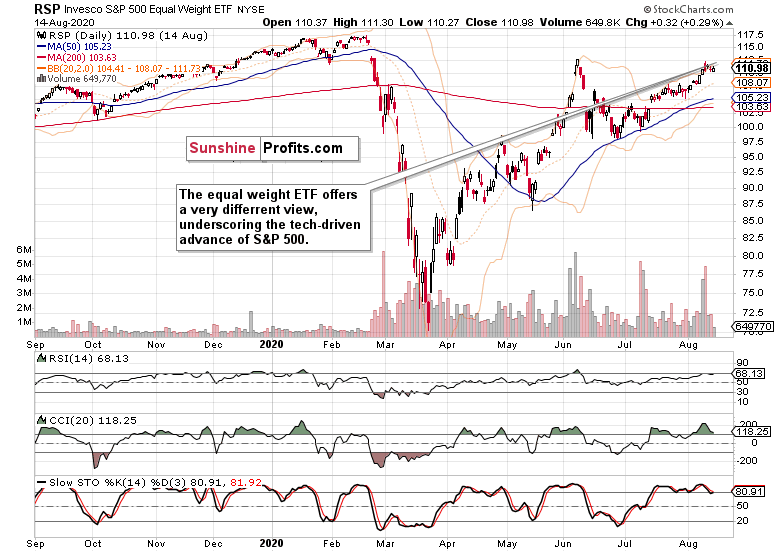
Imagine that each S&P 500 stock would have equal representation in the index, and that weights would no longer matter. That's exactly what the equal weight S&P 500 ETF (RSP ETF) is all about.
And it reveals a very different view of the stock market that's still trading below the early June lows. In other words, it's been the tech sector that's been driving the index higher.
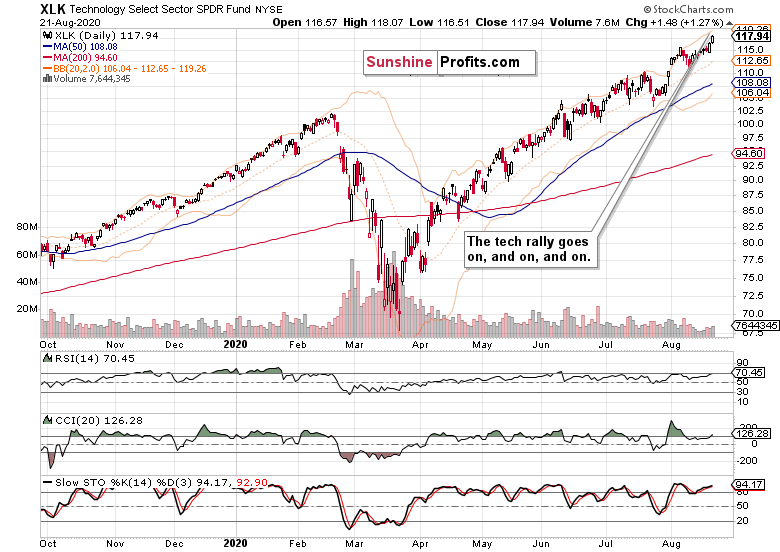
And technology (XLK ETF) is indeed pushing it higher, and not only because of Apple (AAPL) becoming a $2T market cap company. The other heavyweights are responsible for the lion's share of the gain - and perhaps more tech companies would start participating now that semiconductors (XSD ETF) finally made a daily reversal.
Summary
Summing up, the S&P 500 went on its path of higher prices, rebuffing another downswing attempt on Friday. While the non-confirmations are concerning, they aren't an immediate obstacle to an upswing over the coming days, but I certainly look for them to force stocks to go sideways as minimum - sooner or later over the coming weeks.
As for now, the very now, the path of least resistance remains higher, and better be approached with a tight stop-loss as smallcaps aren't willing to participate and market breadth issues are a chapter in and of itself.
The stock bull isn't over yet though, not by a long short, and I look for the non-tech sectors to take up the baton once the much awaited correction actually arrives - or more precisely, when that correction starts getting long in the tooth, I look for the cyclicals to get moving.
Thank you for reading today's free analysis. If you would like to receive daily premium follow-ups, I encourage you to sign up for my Stock Trading Alerts to also benefit from the trading action described - the moment it happens. The full analysis includes more details about current positions and levels to watch before deciding to open any new ones or where to close existing ones.
Thank you.
Monica Kingsley
Stock Trading Strategist
Sunshine Profits: Analysis. Care. Profits. -
Stock Investment Update - The Case for Higher Stock Prices
August 17, 2020, 10:28 AMWelcome to this week's Stock Investment Update.
Refusing to decline or rise intraday, stocks are getting ready for a sizable move - and I think it would be to the upside. But it might not happen without moving lower first, as the flattening $VIX shows. The advance decline line doesn't really bring much short-term clarity to the picture either, but the bullish percent index is solidly in a bull market territory.
And in times as trying the patience as these, that's what hints at what the prudent course of action is. Stepping back, and checking the big picture. Are the bullish premises still valid? Any cracks in the dam emerging?
I still see that the bulls deserve the benefit of the doubt, and the reasons why follow.
S&P 500 in the Medium- and Short-Run
I'll start today's analysis with the weekly chart perspective (charts courtesy of http://stockcharts.com ):

Such were my comments on the weekly chart 7 days ago:
(...) Bullish price action for many recent weeks on volume that isn't yet inviting increasing participation of the sellers. This fact alone bodes well for higher stock prices in the medium-term, but the buyers will meet a set of two key resistances shortly.
It's the Feb all-time highs that are drawing nearer day by day, and the upper border of the rising black trend channel.
The measured move higher continued, and volume decreased again, which doesn't point to the bears' willingness to step in just yet. Given the background of no stimulus deal thus far, and the election uncertainties going beyond taxation, that's actually encouraging.
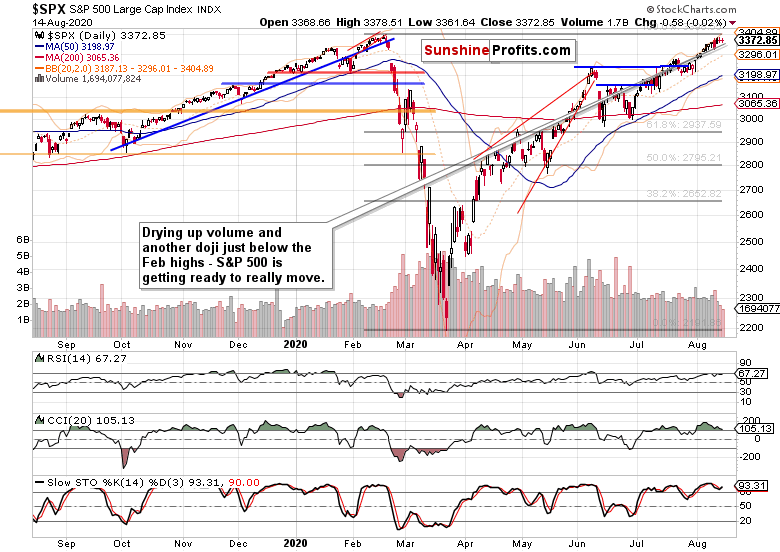
The daily chart shows the S&P 500 hesitation in short run perfectly. Volume is progressively declining, and a bigger price move is needed to entice market participants to act. And odds are, that it would be in line with the predominant direction, which means higher.
The Credit Markets' Point of View
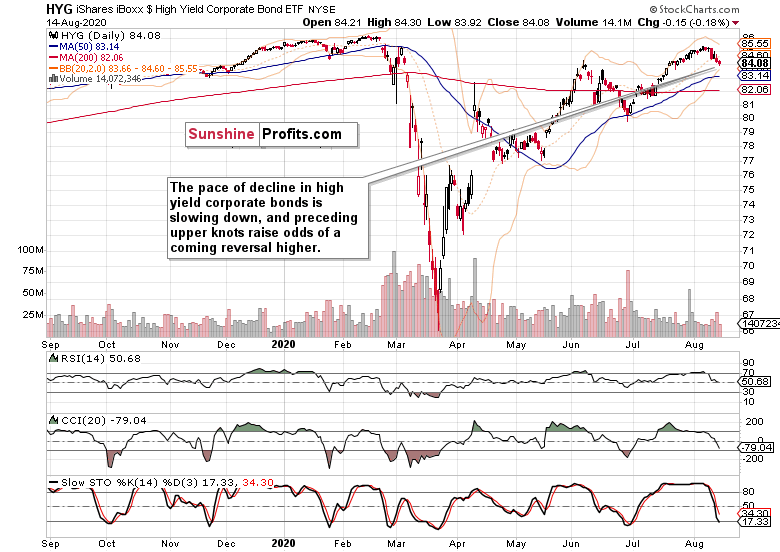
High yield corporate bonds (HYG ETF) can't find a strong bid lately, but the selling pressure appears abating. And so is the pace of daily declines losing steam to a degree.
Does the recent string of lower prices usher in a downtrend? Doesn't seem so just yet. Thus, I view it as a correction within an uptrend. As a consolidation while waiting for the coming Fed move as it comes to weekly balance sheet increases, and more positive economic news.
But the markets are about so much more than the Fed - the central bank is just one player, though with the deepest pockets. This is where other debt instruments come into play, and I mean the high quality ones, especially Treasuries.
First though, let's take a look at investment grade corporate bonds (LQD ETF) just below.
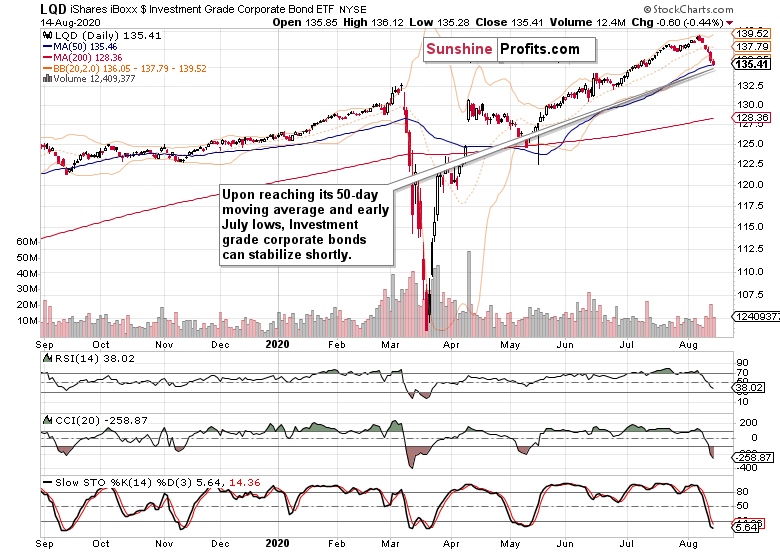
The investment grade bonds' dynamic is quite similar to their high-yield counterparts - both are declining, yet could see stabilization shortly. And as the 50-day moving average and early July lows have been reached in LQD ETF, the high-quality bonds might lead the way higher.
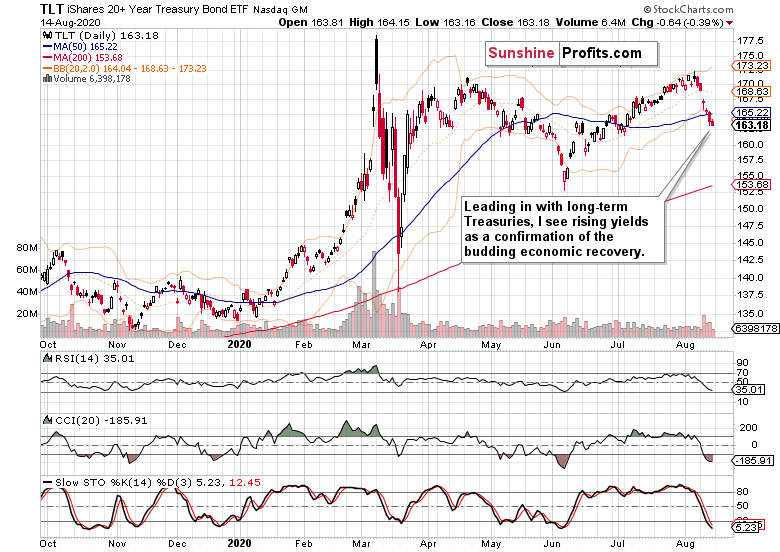
Very long-term Treasuries mirror the deceleration of the plunge. But it's especially within these instruments that I see a confirmation of the real economy recovery story, and the justification of why rising yields will translate into higher stock prices.
Take a good look at early June - Treasuries were plunging in the runup to the surprise non-farm payrolls gain that corresponded with the upside breakout above the rising wedge on the S&P 500 daily chart. This raises the likelihood we'll see an upswing in stocks this time around too.
Smallcaps, Emerging Markets and Other Clues
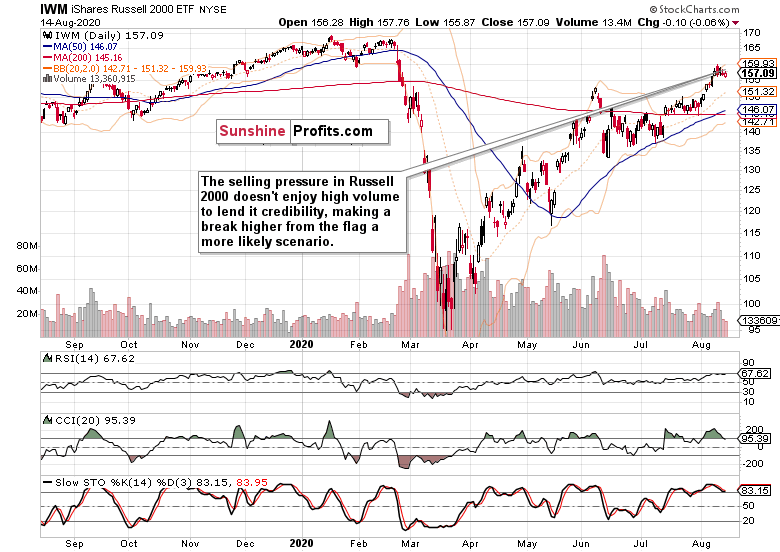
Over the very recent sessions, the Russell 2000 (IWM ETF) was acting weak, but let's not forget that it broke above it early June highs earlier. This makes the currently retreating prices a correction within an uptrend as the smallcaps aren't losing sight of the 500-strong index.
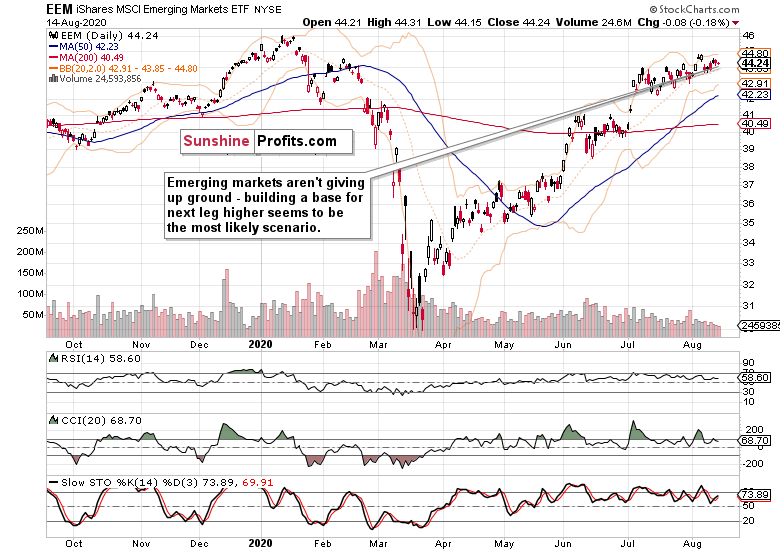
Neither the emerging markets (EEM ETF) are signaling danger - after outperforming since the start of July, they're taking a breather currently. The base they're building, will give way to another upswing (that's the more probable scenario).
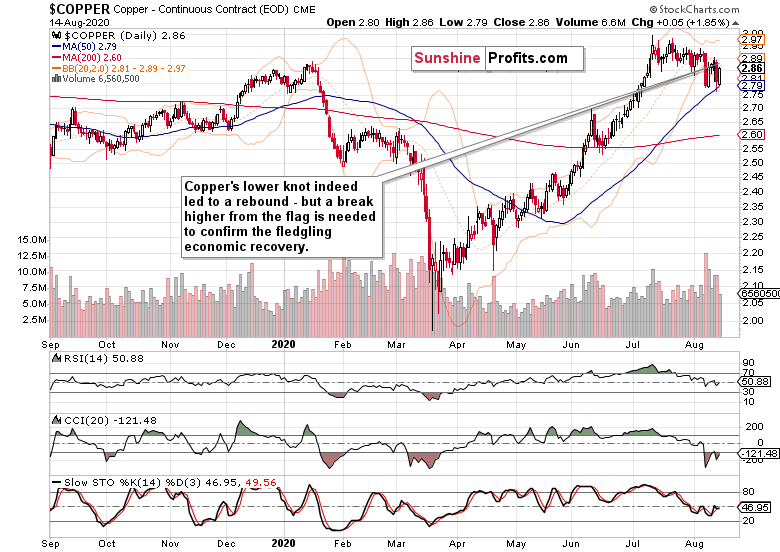
Copper keeps consolidating preceding months' sharp gains, and appears less and less likely to decline as time passes by. Should it take on the $3 level successfully, that would be another vote of confidence in the nascent economic recovery.
Let's recall my Friday's observations on the metal with PhD. in economics:
(...) yesterday's lower knot indicates that the bulls have stepped back to a degree. That increases the probability that once trading leaves this flag, they will do so with a break higher.
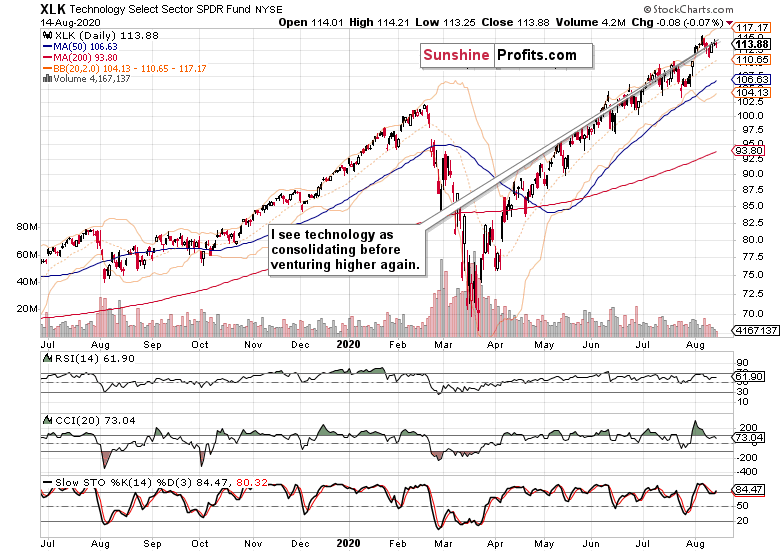
Technology (XLK ETF) keeps consolidating with a bullish bias, and remains the leading S&P 500 sector. Healthcare (XLV ETF) is pausing, while financials (XLF ETF) are showing promising signs of life.
Summary
Summing up, S&P 500 has been going nowhere lately, and the market sentiment can be characterized as one of greed. Encouragingly for the bulls though, the bears are coming back to life as the slowly rising put/call ratio shows - that means the bullish side of the boat got less crowded. The economic recovery story is gaining traction, and stocks are likely to be helped in their upswing once long-dated Treasuries level off, which could help corporate bonds catch a strong bid again.
While the air near the Feb all-time highs is quite thin, the bulls aren't looking to be at the end of their rope.
Thank you for reading today's free analysis. If you would like to receive daily premium follow-ups, I encourage you to sign up for my Stock Trading Alerts to also benefit from the trading action described - the moment it happens. The full analysis includes more details about current positions and levels to watch before deciding to open any new ones or where to close existing ones.
Thank you.
Monica Kingsley
Stock Trading Strategist
Sunshine Profits: Analysis. Care. Profits.
Free Gold & Stock Newsletter
with details not available
to 99% investors
+ 7 days of Gold Alerts
+ Mining Stock Rankings
Gold Alerts
More-
Status
New 2024 Lows in Miners, New Highs in The USD Index
January 17, 2024, 12:19 PM -
Status
Soaring USD is SO Unsurprising – And SO Full of Implications
January 16, 2024, 8:40 AM -
Status
Rare Opportunity in Rare Earth Minerals?
January 15, 2024, 2:06 PM

