

Trading position (short-term; our opinion): long positions (100% position size) with stop-loss at 2580 and the initial upside target at 3125.
Tuesday's refusal of the stock upswing didn't really stick, and the S&P 500 opened higher. Trading with an upward bias during the session, the index closed comfortably above the 61.8% Fibonacci retracement. As outlandish as it might seem, does it denote a new bull market being on the way? It just can't be overstated how crucial this level is to the stock market outlook...
S&P 500 in the Short-Run
Let's start with the daily chart perspective (charts courtesy of http://stockcharts.com ):
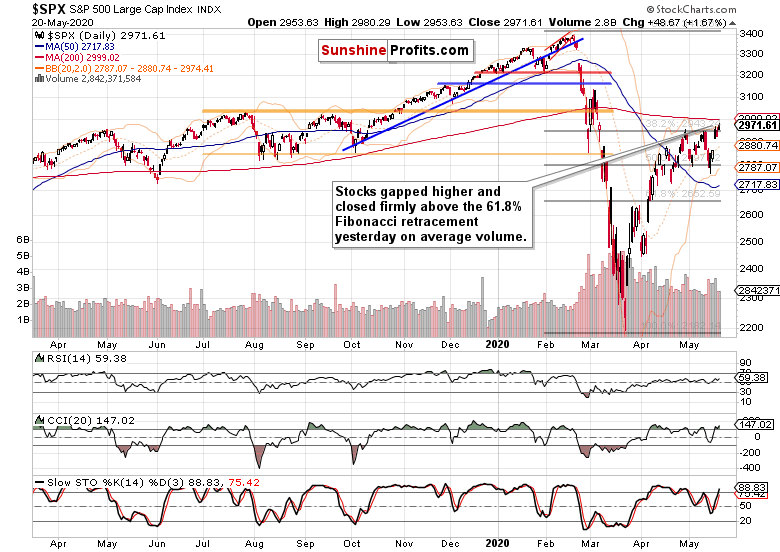
Cutting into the 61.8% Fibonacci retracement several times already, stocks are on a slow but steady move this week. It's as well the early March gap that they're challenging. While the S&P 500 just closed above the Fibonacci retracement (that's around 2940), the gap's upper border stands still unbeaten.
Yesterday's volume doesn't mark a spike where the buyers would be falling over themselves to enter into the market, but it's not representative of a reversal either (thanks to closing relatively near the intraday highs). It's just on the lower end of the average spectrum, which would be consistent with a gradual upswing development. Is it that neither the buyers nor the sellers believe it? By believe, we mean to be ready to get into the market in droves, in place of a wait-and-see position.
The daily indicators keep supporting the unfolding upleg. Will they convince more buyers to enter the fray with passing time? As we see the grind higher in fits and starts as the most likely scenario, it's probable.
The Credit Markets' Point of View
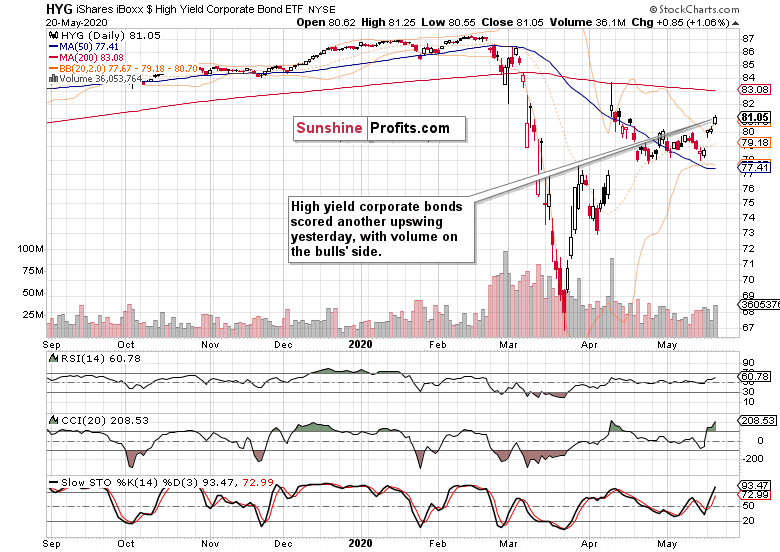
High yield corporate debt (HYG ETF) keeps providing tailwind for the move higher in stocks. On sizable volume and near its intraday highs, this leading metric of credit market health overcame the late April and early May highs. With its daily indicators supporting further gains, how does the broad credit market performance reflect upon the stock advance?
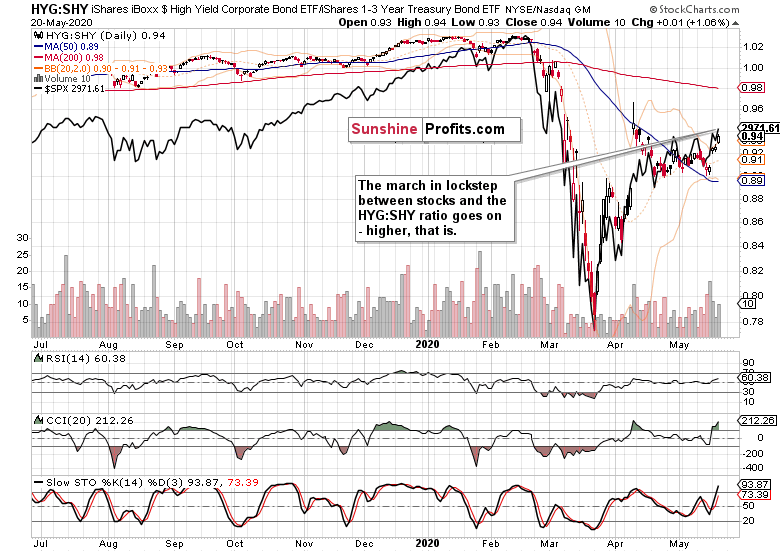
Stocks aren't getting ahead of themselves. The high yield corporate bonds to short-term Treasuries ratio (HYG:SHY) keeps being in accord with the march north in the overlaid S&P 500 chart (the black line).
Key S&P 500 Sectors and Ratios in Focus
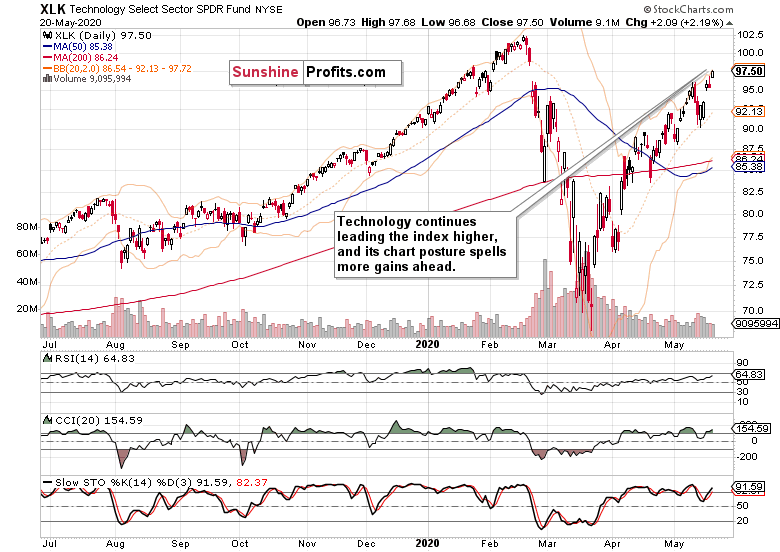
To illustrate the point, have you seen how easily technology (XLK ETF) overcame Tuesday's daily setback? In our yesterday's analysis, we noted that the daily reversal lower on a not so outstanding volume means that the uptrend is intact. And it is.
Healthcare (XLV ETF) couldn't keep its opening gains yesterday, and remains very much range-bound. Financials (XLF ETF) gave up their intraday gains, but their bullish opening gap remains intact as they're knocking on the door of the early May highs in an attempt to overcome them.
Consumer discretionaries (XLY ETF) refused to close its opening bullish gap, and instead consolidated sizable opening gains. While consumer staples (XLP ETF) rose as well, they relatively underperformed the discretionaries.
As a result, believe it or not, the consumer discretionaries to staples ratio (XLY:XLP) is already trading well above its February highs. Given the degree of real economy destruction seen around, that's quite a signal this leading indicator is sending. The financials to utilities ratio (XLF:XLU) looks to have stabilized not too far from the declining resistance line connecting its mid-March and early-May intraday tops, and it's our opinion that it would go on to break higher.
Among the stealth bull market trio, energy (XLE ETF) performed best. Together with materials (XLB ETF) and industrials (XLI ETF) though, they've been largely consolidating last two days' gains. Consolidating with a bullish bias, that is - and that bodes well for the stock rally to continue at its own pace.
From the Readers' Mailbag
Q: I switched jobs and was in the process of moving my 401k directly from one company to another. The old company sent a paper check to me cashed out on March 12th..a low point. I have to put the check into my new 401k account. waited for market to go back down but never happened. Now i will be buying higher than sold. I have the check to the 401k company FBO myself -What are my options if any?
A: Let me give you an answer that doesn't constitute any tax accounting or similar advice, and concentrates instead on the stock market situation at hand, and how I would approach the matter were I in your shoes.
First things first - it's not a shame to buy higher, if the outlook is correspondingly bullish. You're assessing the outlook, and not a price point by itself.
Off the all-time February highs, stocks dived to the March 23 lows. The recovery has been similarly steep, and eventually overcame the resistance posed by the 38.2% Fibonacci retracement in early April. All right, but should the bear market be alive and well still at that time, stocks should have very real trouble overcoming the 50% Fibonacci retracement.
And they did have issues, and it was only last week that they refused to plunge below it again. So, they kind of left the glass half full, half empty. That would give a big-picture impression of possible, yet not outrageously large gains ahead, or just muddling through directionless for some time.
Now, we see stocks taking on the 61.8% Fibonacci retracement, in what would mark a transition to a stock bull market. And it stands a pretty good chance of coming true, regardless of all the suffering in the real economy. This is a third attempt to overcome this key resistance, so it again speaks of a thorny road ahead. Thorny, but mostly higher on low volatility compared to Q1- and as we expect the breakout to succeed, it would attract new institutional money alongside more retail investors. Not that the latter wouldn't be coming already (money market outflows show that).
One more point in support of the new bull market theory and against retesting or breaking below the March lows. If you look at similar post WWII situations in stocks, and see how the S&P 500 performed since reaching the 50% Fibonacci retracement average, the current situation, despite all the corona facts, hysteria and tidal wave of bankruptcies ahead, is taken as no big deal. I mean, stocks are pretty much following the average case scenario.
And that's a steady climb higher at a not too steep a pace. By not too steep, I mean almost a straight line pointing to stocks around 3050 quite before the Labor Day. Right now, stocks are fairly reasonably priced, and it should be noted that even the worst case scenario would take them only to the low 2600s during the summer. That's not such a large downside that stocks could suffer if you consider the real world as seen through your very own eyes.
That's how I see the table set for the upcoming weeks. Of course, the runup to the elections and the possible arrival in earnest of the second corona wave would decide whether stocks go on to march higher (quite possibly faster than before considering the great uncertainty removed), or point lower next. Either way, we would get plenty of advance warnings - the current situation simply requires chart reading, methodology and being attuned to the fundamental developments and interventions, all on a daily basis.
Now comes the being in your place part. I would either look for overshoots to the downside from the ideal path forward in stocks over the summer, and allocate capital to buy when we get temporary discounts. Yes, that means disregarding the fact that financial markets are the only place where buyers run out of the store screaming in fear whenever a discount presents itself.
Or I would just go the dollar-cost-averaging path, meaning I would allocate a certain portion of the funds to place at steady intervals over time in what is essentially giving up on trying to time the market. Both attempts have their pros and cons, and it's essentially about the time and emotional capital you want to invest...
What is not part of your question, but still needs to be answered in one breath, is where I would allocate those funds. Then, there is the distant time horizon of a 401(k).
While we can count on financial repression to go on and keep yields relatively low, remember that during the 1980s, Treasuries were jokingly called certificates of guaranteed confiscation. Given the inflationary clouds ahead, you'd stand a better chance in Treasury inflation-protected-securities (TIPS), laddered bond portfolio of your own making (yes, buying individual bonds and keeping them till maturity), or even going for dividend aristocrats (these are stocks with decades-old history of paying out dividends and raising them constantly along the way - these are your Coca Colas or Procter & Gambles and the like).
Heck, even some technology stocks behave in a way that can be similarly taken advantage of. I personally view the Microsoft or Apple charts as bullish - and this is just two of the many greatly-performing tech stocks. The tech sector is primed for more gains, and healthcare is too - these heavyweights have the brightest prospects in 2020.
The above shows the vulnerability of having to cash out of the market at an inopportune time. That messes up with lifetime planning (just as the two bear markets in 2000s did), and the above thoughts represent my top of mind ideas to deal with it gracefully.
Summary
Summing up, Tuesday's decline was erased before the market open already, and the S&P 500 had kept the bullish intraday bias since. But this isn't about such a short time frame only - both the credit market performance and sectoral analysis keep pointing in the direction of more stock gains to come. The bulls' first objective is to confirm the breakout above the 61.8% Fibonacci retracement by three consecutive closes higher, and to overcome the early March bearish gap (its upper border is at around 2970) in a show of strength. Thereafter, the bulls would target the 200-day moving average at around 3000. That's for starters, as we expect to slowly grind higher overall despite the high likelihood of sideways-to-slightly-down trading over the summer. But before that, the ball remains in the bulls' court.
Trading position (short-term; our opinion): long positions (100% position size) with stop-loss at 2580 and the initial upside target at 3125.
Thank you.
Monica Kingsley
Stock Trading Strategist
Sunshine Profits - Effective Investments through Diligence and Care

