

Briefly: outlook for the stock market is sideways in the short-term, then sideways-to-bullish for the following weeks and especially months.
Neither on Thursday, nor on Friday did the bears manage to break below the 50% Fibonacci retracement. Stocks rebounded, albeit less convincingly than on Thursday. Or was it convincing enough? Let's examine both sides of the story to assess whether it's the bulls or bears that are holding the upper hand now.
S&P 500 in the Medium- and Short-Run
We'll start this week's flagship Stock Trading Alert with the weekly chart (charts courtesy of http://stockcharts.com ):
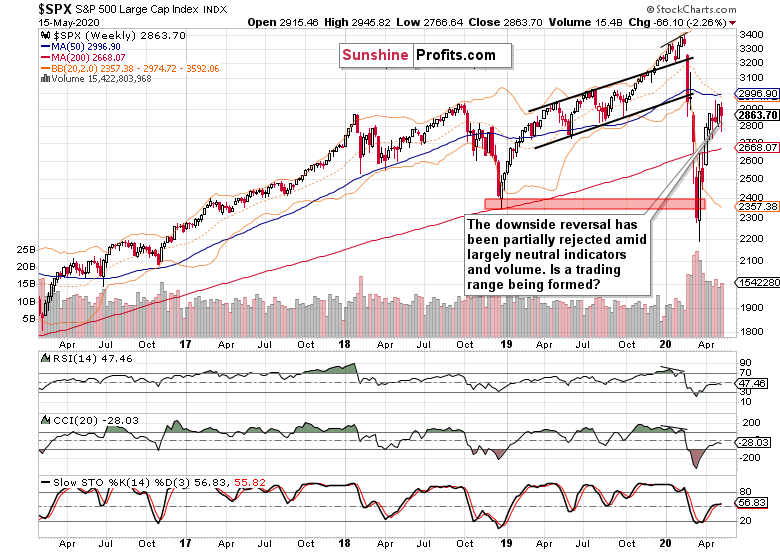
The bulls opened the week, making another run at the 61.8% Fibonacci retracement. Late on Tuesday, the Fed made several pronouncement that were not really surprising, but they still served to take the wind off the bulls' sails. Namely, it was stated that more fiscal stimulus might be necessary, and that the virus needs to get under control so as to fix the economy. On Wednesday, Powell echoed these kind-of-obvious positions, and stocks sold off to the 50% Fibonacci retracement. On Thursday, they declined on another 3,000K unemployment claims data, yet reversed later in the day. Friday brought us renewed US-China tensions and terrible retail sales figures, which took stocks lower again - yet they recovered in the latter half of the session.
As a result, the weekly candle bears a red body that marks the decline, and a sizable lower knot denoting last two days' recovery. Neither the weekly volume nor the weekly indicators stand out in any way. Are stocks likely to go on grinding slowly higher, or will the bears try luck again with another downswing attempt?
Let's see the daily charts for more details.
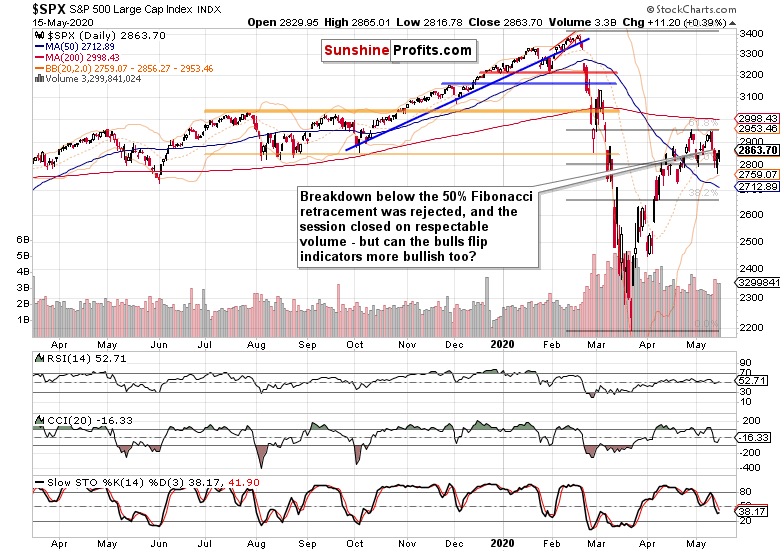
Trading around the 50% Fibonacci retracement attracted relatively more volume than the breakout attempt above the 61.8% one. As the buyers are certainly becoming more active around the 2800 area, is it likely to hold another selling wave should it come? And how likely will it come?
Well, the daily indicators aren't exactly on their buy signals just yet - Stochastics is still on a sell signal, while CCI has ticked higher before reaching the -100 area and RSI is fairly neutral.
Let's dig a bit deeper into Friday's events and paint a picture of what's to come early this week. While the Democrat-proposed $3T bill is dead on arrival, it's fairly obvious there would be a new fiscal stimulus - however, it hasn't materialized yet even as an outline. Then, after backlash against the implied cure-all coronavirus vaccine position, Trump flip-flopped to say that the virus would just go away at some point, all by itself - which seems to have helped with Friday's modest upswing.
On Tuesday, we'll hear Powell's testimony - and after last week's reaction to the cautious tone struck, the risks of another selloff are there. It can't be denied that the authorities have managed to paper over the problem, but is the consumer and small business sector coming back? We're of the opinion that the nearest months will show the veracity of the rebound, and we suspect that a very wide-stretched U-shaped real economy recovery would actually be the optimistic scenario here.
These weeks, the market will likely remain in a wait-and-see mode, reluctant to make a sizable move either way. But what if the risks were skewed rather to the downside in the very near-term? Coming back to the Fed, it's likely - after moving decisively in late March and early April, their Treasury/mortgage-backed securities purchases keep being low. That's one key buyers less. What would be a better excuse to ramp up the printing presses than another slide in the markets?
In other words, it's unlikely that Powell, after putting pressure on the executive branch to act, would bring the punch bowl to the Senate hearing. This makes it likely that the market would need to spook the Fed into action first.
Do we find support for the above theory in the credit markets?
The Credit Markets' Point of View
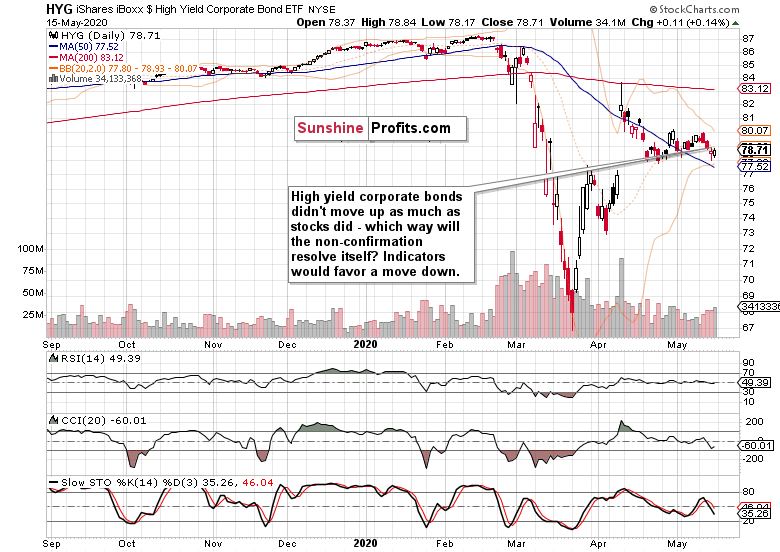
High yield corporate debt (HYG ETF) didn't really rebound either on Thursday or on Friday. That's a sign of non-confirmation of the stock upswing.
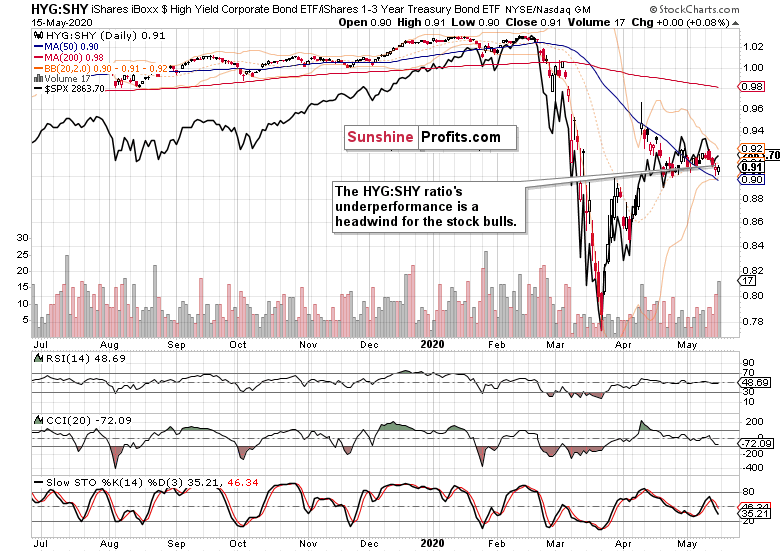
The high yield corporate bonds to short-term Treasuries ratio (HYG:SHY) also keeps underperforming. Just as we wrote on Thursday, this ratio is well positioned to exert downside pressure on the overlaid S&P 500 chart (the black line), even after Friday's modest move higher.
Fundamentally speaking, that's what one can expect when Fed's firepower isn't really there at the moment. This is why another attempt to move lower in stocks, is likely.
Key S&P 500 Sectors and Ratios in Focus
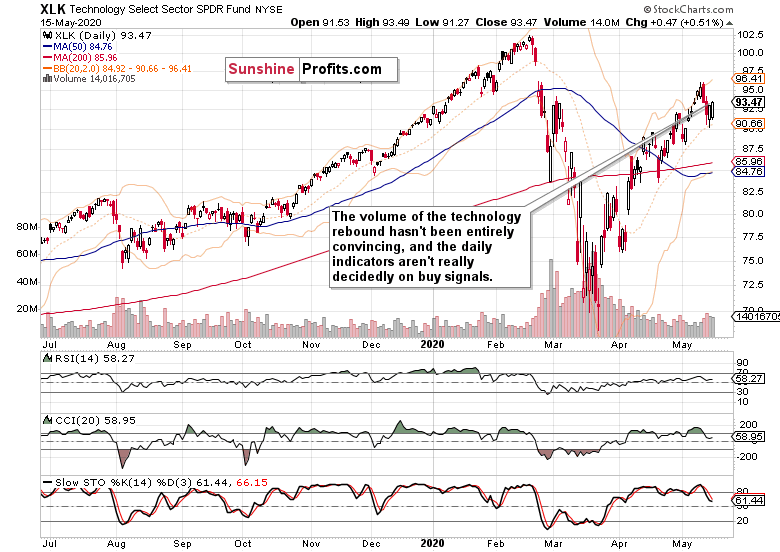
Sure, technology (XLK ETF) rebounded on encouraging volume, but the technical picture isn't fully convincing. The daily indicators still aren't on their buy signals, and while the sector keeps making higher highs and higher lows, last two days' rebound appears extended and consolidation with a downside bias isn't out of the question.
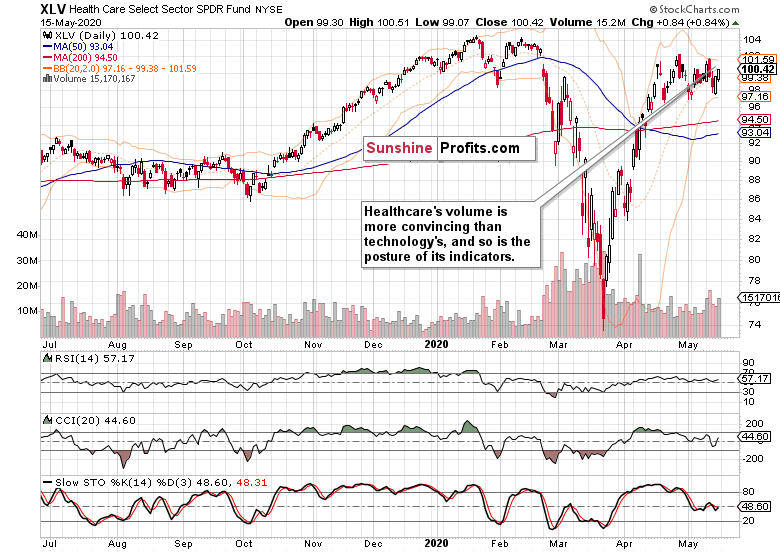
Healthcare's (XLV ETF) price action looks more favorable to the bulls, especially since Friday's volume overcame that of the Wednesday's downswing. Unlike tech, the sector didn't open near its Thursday's starting prices. But can it keep pulling the S&P 500 higher?
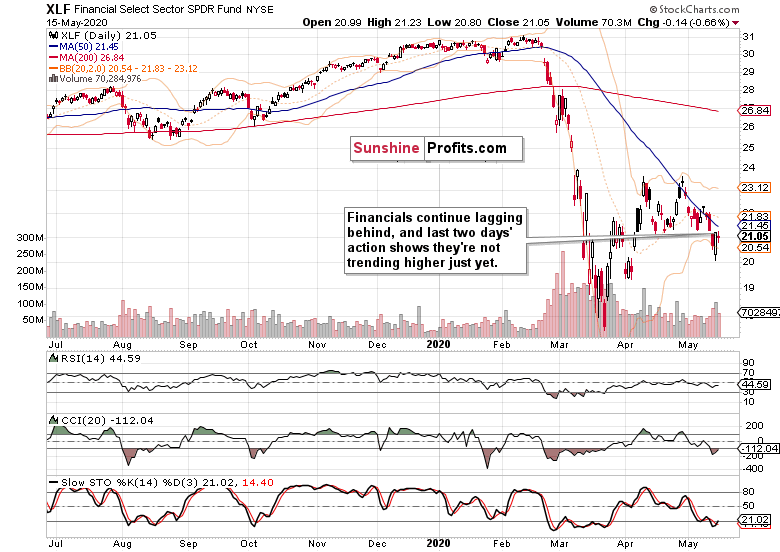
Financials (XLF ETF) continue underperforming, and despite erasing Wednesday's plunge, they're not trending higher. They reflect the weak performance of the credit markets, which doesn't bode well for the advancing index as such.
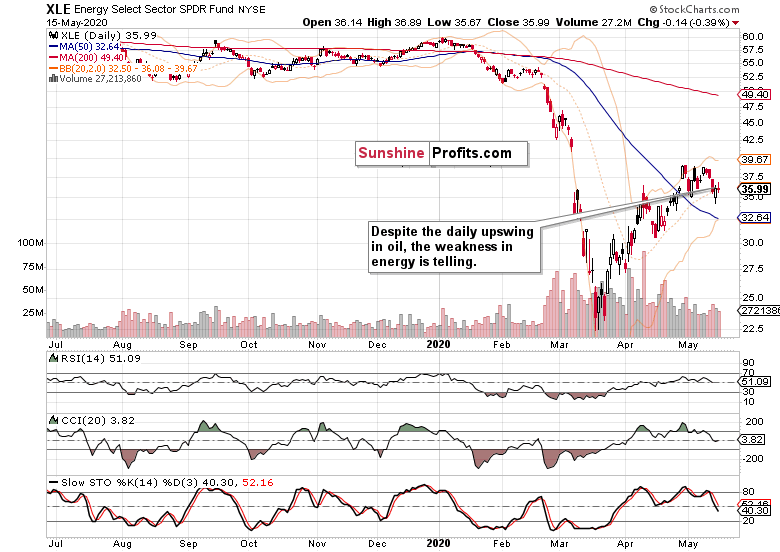
Energy (XLE ETF) is taking a breather, and has issues moving higher regardless of the oil price recovery. As the volume also leaves quite something to be desired, the short-term risks appear skewed to the downside.
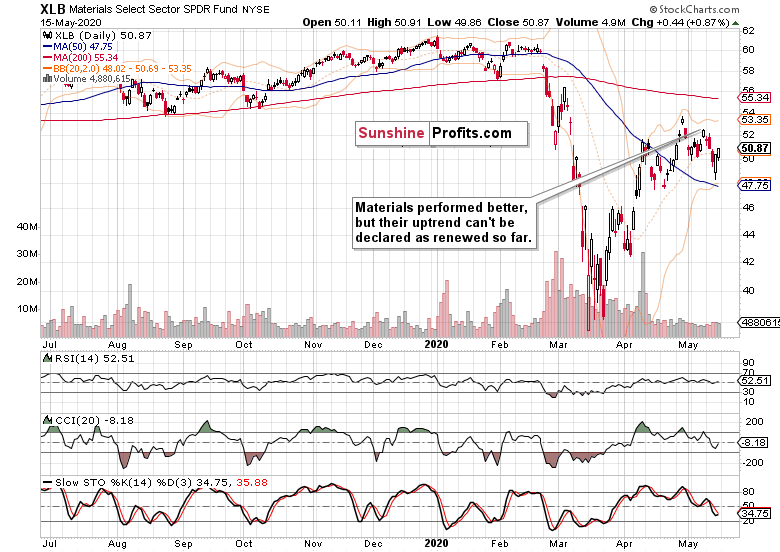
However, that's not true to such an extent in materials (XLB ETF). On one hand, they rejected the lower low and sprang higher, but the daily indicators and volume aren't yet on the side of the bulls. While that may change later this week, we're not there yet, and consolidation over the nearest sessions remains the most likely scenario.
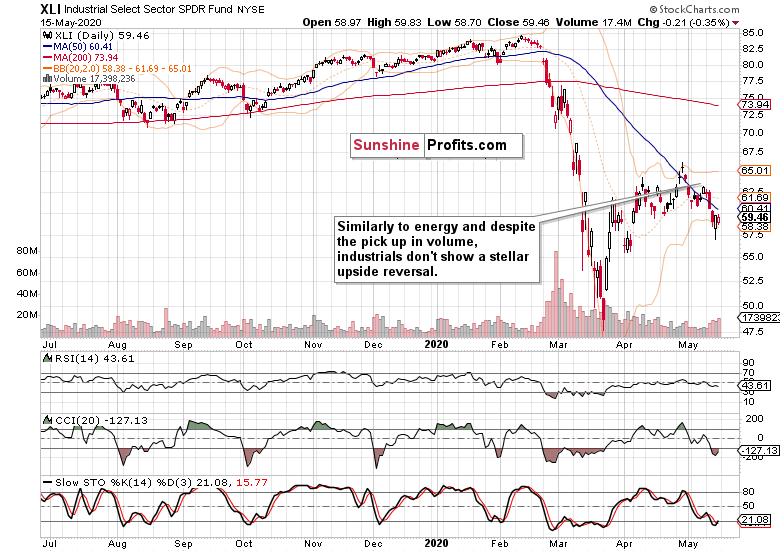
The last of the stealth bull market trio, the industrials (XLI ETF) performed as feebly as energy did. It's a safe bet to say that these three sectors haven't exactly assumed leadership in the S&P 500 rebound, making it more likely that the stock bulls will get again tested this week.
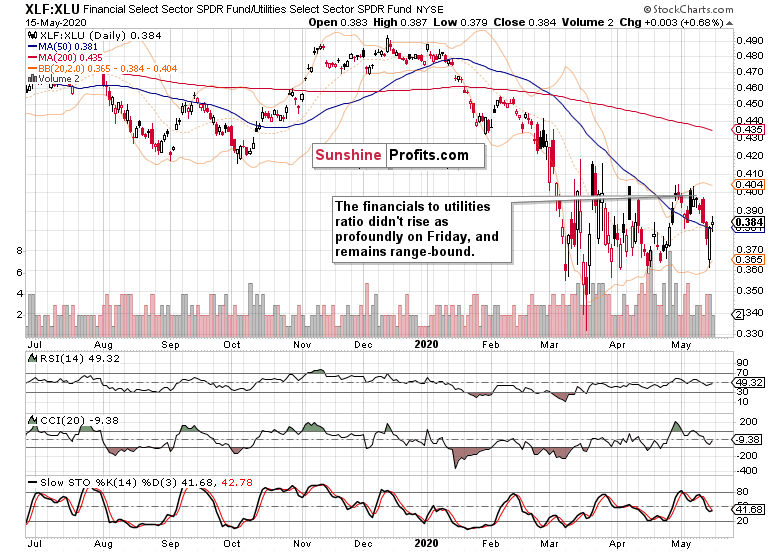
The financials to utilities ratio (XLF:XLU) still doesn't act bullish - the sideways action would favor consolidation in this relatively broad sideways trading range (2800 to 2940) in the S&P 500 - still within the lower half of that spectrum for now.
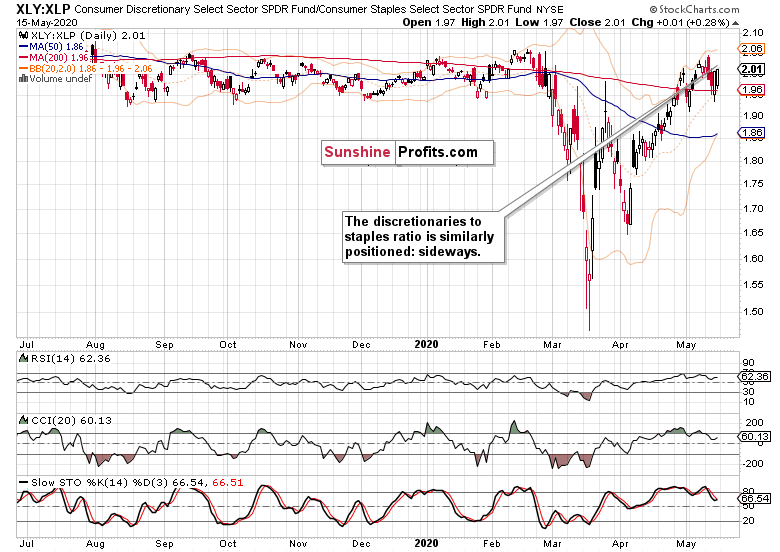
Similarly, the consumer discretionaries to consumer staples ratio (XLY:XLP) is consolidating. It means that it's not giving clear signs of the upcoming directional move in stocks.
The Fundamental S&P 500 Outlook
As the coronavirus infection charts appear to have relatively stabilized, and the Fed offered ample support at a critical juncture, the stock market hasn't sold off in a dramatic way since. Moving from the March 23 lows to the 50% Fibonacci retracement, it has overcome this resistance and taken twice on the 61.8% one. Last week, the 50% retracement held as support.
The above paragraph would speak in favor of a near-term trading range between the two retracements. But would that mean that no selloff below the lower one can happen? Absolutely not, the 2720 or even the low 2600s can get tested. And that needn't to happen on very adverse corona-related developments. Faced with incoming data, the market can start to doubt whether we're within sight / we've reached the bottom and the real economy is on the mend now. Continuing unemployment claims, retail data, manufacturing figures and similar would show. Or escalation in US-China trade tensions can drive the stock selloff similarly to the way it did early on Friday. Or the Fed playing the monetary interventions on-off game, can work to similar effect.
Still, having gone as high from the low 2200s, the risk of retest or breakdown below these lows, isn't there at the moment. Not with all the implicit and explicit Fed support, the many fiscal stimulus measures, and crucially, not unless corona goes from we-have-flattened-the-curve to oh-it's-exponential-again. Despite the relative complacency and the dangers it brings, we're still far from the market pressing the panic button.
Reaching 2800, 2720 or the low 2600s wouldn't count as panic. Considering this year's swings, a move to these levels (especially the first two, but there's potential for an overshoot to the 2600s) would constitute a relatively shallow correction, after which a slow grind higher could go on (barring catastrophic corona developments). After all, we're in an election year.
What to do about the current S&P 500 pricing, what actions to take? For all the above-mentioned reasons (namely the credit-related ones), we're expecting a push lower in stocks to happen most likely over this week, and in all likelihood still within May. With breakouts and breakdowns having failed recently (bringing about no directional move or momentum to trade), the choice of opportune entry and exit points is rising in importance.
Summary
Summing up, despite the bullish finish to Friday's trading, the buyers don't have yet the indicators on their side. Weekly ones including volume are mostly neutral, while the daily ones remain vulnerable to a downside move. As the credit markets portend, the stock upswing appears to have gotten a bit ahead of itself, and Tuesday's Powell testimony coupled with yet another reduction in Fed's purchases starting today, are likely to be the catalyst of renewed selling. Delivered with a sober assessment of the real economy prospects and uncertainties (yes, the Q2 Fed-projected GDP drop is now 35%), it could drive stocks back to the 2800s, and the HYG ETF breaking below the late April lows. This would strengthen the bearish case for stocks in the near term - just as the US-China trade tensions or anchoring the reopening rebound expectations do.
Very short-term outlook for the stock market (our opinion on the next 2-3 weeks):
Sideways.
Short-term outlook for the stock market (our opinion on the next 2 months): Sideways-to-bullish.
Medium-term outlook for the stock market (our opinion on the period between 2 and 6 months from now): Sideways-to-bullish.
Long-term outlook for the stock market (our opinion on the period between 6 and 24 months from now): Bullish.
Very long-term outlook for the stock market (our opinion on the period starting 2 years from now): Bullish.
As a reminder, Stock Investment Updates are posted approximately once per week. We are usually posting them on Monday, but we can't promise that it will be the case each week.
Please note that this service does not include daily or intraday follow-ups. If you'd like to receive them, we encourage you to subscribe to our Stock Trading Alerts today.
Thank you.
Monica Kingsley
Stock Trading Strategist
Sunshine Profits - Effective Investments through Diligence and Care

