

Briefly: in our opinion, full (300% of the regular position size) speculative short positions in mining stocks are justified from the risk/reward point of view at the moment of publishing this Alert.
Gold and silver both reversed yesterday (Jan. 11), which might seem bullish at first sight, but it isn’t.
Reversals are the key moments in any market, because they often mark tops and bottoms. And – of course – everyone wants to buy at the bottom and sell at the top. That’s much easier said than done though, because tops form exactly at the moment when the urge to buy is at its peak, and the opposite is true for bottoms. So, in order to make money, one needs to decide on not following what they “feel” is going to happen, but what the objective tools that have proven effective in the past suggest. If enough of them suggest the same thing, the odds are that the market is going to do something – regardless of how one “feels” about the market at a given time.
Reversals are particularly interesting, because they allow one to enter the market almost right at the bottom and exit right at the top. And they work over and over again. They’re easy to spot too – the price was going up for days and now it moved up and then back down. Easy as that… Or is it?
You already know the answer. No, it’s not that easy. It may look simple, especially at first glance, but it’s not easy, and the emotional factors are not the only obstacle in determining whether or not a reversal was really important.
The thing about reversals that’s hidden in plain sight is that they are not only about the price. The key thing to look for during these reversals is volume.
We should see a fierce battle between bulls and bears, leaving one side overpowered – in the case of bottoms, bulls should overpower bears. Low or average volume means that the battle was not fierce, or that there was very little fighting done on a given day. The implications would likely be nonexistent.
So, what happened yesterday in gold and silver with regard to volume?
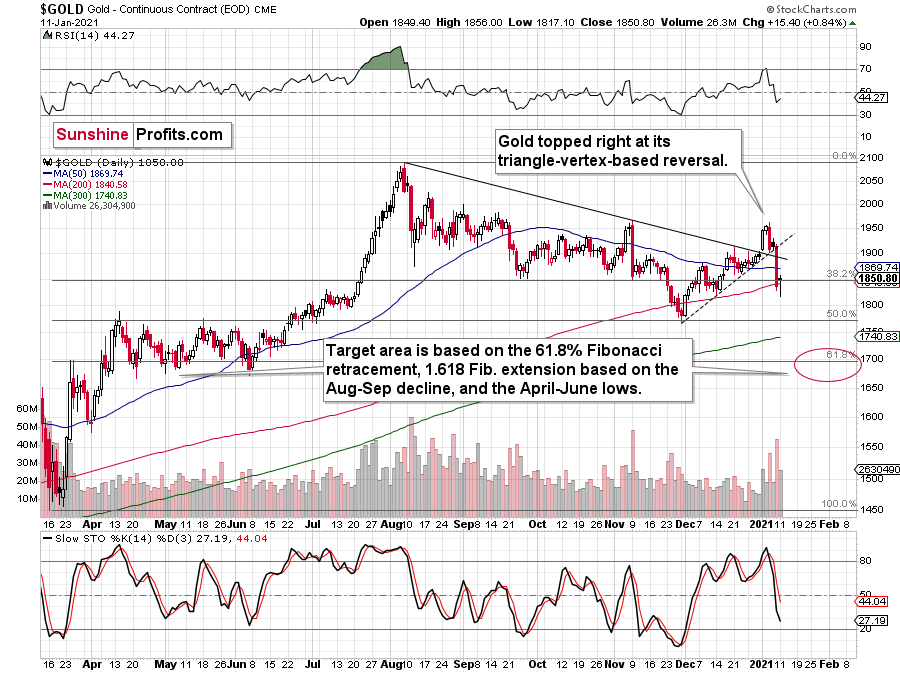
Figure 1 – COMEX Gold Futures
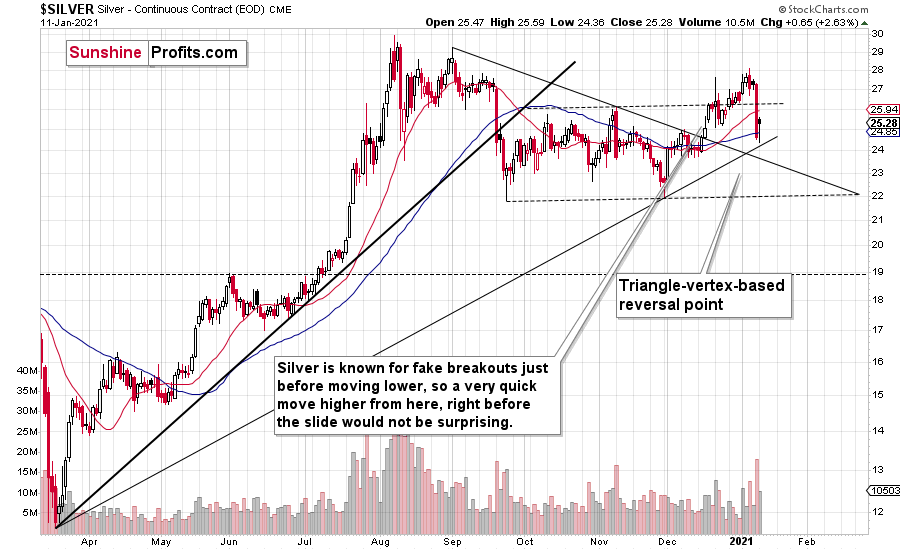
Figure 2 – COMEX Silver Futures
The volume was notable, but it was not huge. So, did gold form a critical reversal? Not really. It corrected some of its declines and took form of a reversal, but it didn’t have the reversal’s “spirit”. The bulls didn’t seem to have overpowered the bears. What seems to have happened instead, is that bears took a break after a massive daily victory.
You can see a good example of a clear reversal in silver, on Sep. 24, 2020. The volume was the second biggest in a month and slightly bigger than what accompanied the previous day’s decline. And indeed, that was a bottom for months.
Gold doesn’t feature any crystal-clear reversal example in recent history, but the closest to it would be the Aug. 12, 2020 session. Back then, gold reversed, but the rally was over in a week. So, did the reversal really work? It did, but only to some extent. And what kind of volume preceded it? It was big, but not huge. It was big enough to show a bull’s strength, but it was not truly groundbreaking. Thus, a limited reaction was perfectly justified – and that’s what we saw.
Getting back to the current situation on Monday, the volume was relatively average, so I don’t think one should focus on the “default, bullish” implications, because this is not a “default bullish” reversal. It’s a suspicious reversal that might have actually been a breather, so forecasting gold’s rally here would likely be a mistake. The volume doesn’t indicate that it was an important reversal – it’s only the price that indicates that.
So, will gold and silver plunge immediately? Perhaps, and perhaps not. Friday’s (Jan. 8) decline was quite profound, so a few extra days of back-and-forth movement or even a small rally, wouldn’t be surprising. The overall trend is down, and since the USD Index has already (most likely) bottomed, more downside should be expected for the precious metals.
Speaking of the USD Index, it’s breaking above increasingly more resistance lines.
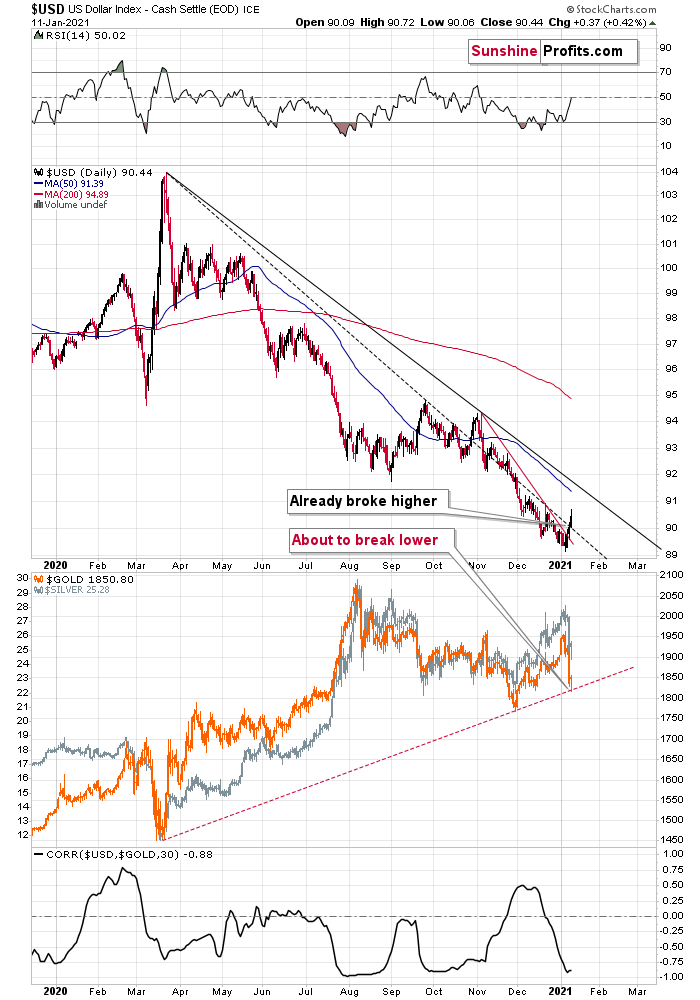
Figure 3 - USD Index, USD, GOLD and CORR Comparison
After confirming the breakout above the very short-term declining resistance line, the USD Index has now broken above the declining dashed line that’s based on the March 2020 and September 2020 tops.
With the correlation between the USD index and gold (bottom part of the chart) being strongly negative, the USD’s breakouts are bullish for gold. Namely, they tell us that after a breather, the USD Index is likely to continue its rally, while precious metals are likely to fall.
The next big move in the PMs is likely to take place once gold breaks below its rising support line, and that’s likely to happen relatively soon. Moreover, please note that the existence of the support line is – by itself – a reason for gold to correct before sliding. This makes the theory of yesterday’s (Jan. 11) reversal not being a true reversal even more valid.
All in all, it seems that the precious metals sector is about to decline once again, if not immediately, then shortly.
And what about mining stocks?
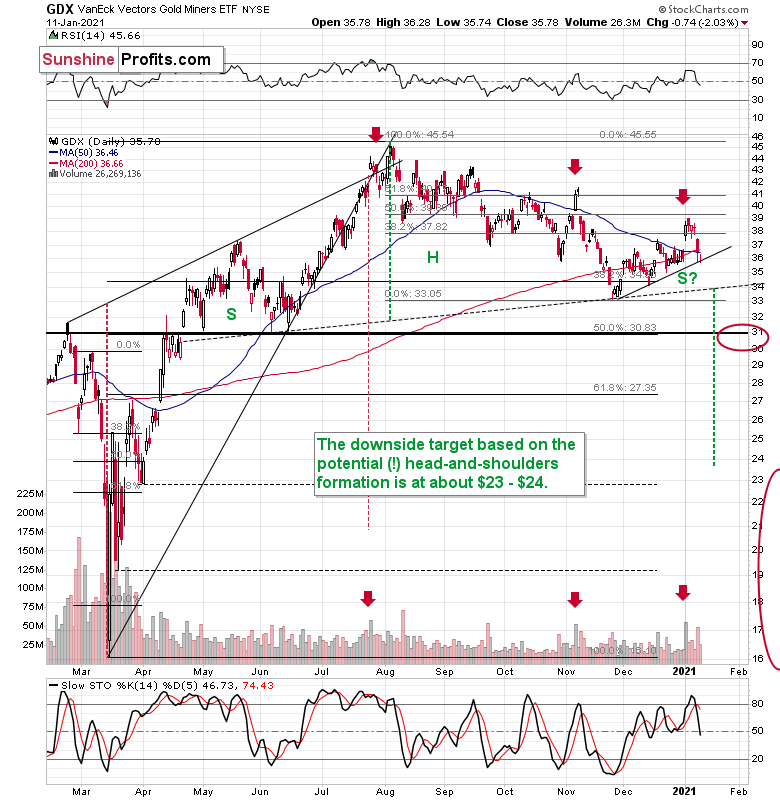
Figure 4
Miners declined yesterday, despite gold’s comeback. They haven’t declined enough on Friday, so it’s only natural that they are trying to catch up. Plus, this is yet another indication that what we saw in gold was not a major reversal, but rather a breather.
The sell signal from the stochastic indicator remains in place, and so does the sell signal coming from the volume spike in the first session of the year (analogy to July and November tops).
Please note that, based on the analogy to the November top, a small, two-day corrective upswing, would be quite normal here. It wouldn’t change the bearish outlook at all.
In addition, the GDX is on the cusp of forming a head and shoulders pattern. If you analyze the chart above, the area on the left (marked S) represents the first shoulder, while the area in the middle (H) represents the head and the area on the right (second S) represents the potential second shoulder.
Right now, $33.7-$34 is the do-or-die area. If the GDX breaks below this (where the right shoulder forms) it could trigger a decline back to the $24 to $23 range (measured by the spread between the head and the neckline; marked with green).
Since there’s a significant support at about $31 in the form of the 50% retracement based on the 2020 rally, and the February 2020 high, it seems that we might see the miners pause there. In fact, it wouldn’t be surprising to see a pullback from these levels to about $33, which could serve as the verification of the completion of the head-and-shoulder pattern. This might take place at the same time, when gold corrects the decline to $1,700, but it’s too early to say with certainty.
Also, let’s not forget that the GDX ETF has recently invalidated the breakout above the 61.8% Fibonacci retracement based on the 2011 – 2016 decline.
Don’t Call It a Comeback
With more asset managers shorting the U.S. dollar than at any point since 2006, I warned on Dec. 29 that a violent short-covering rally could be on the horizon. I wrote:
We may be on the cusp of one of the biggest short-squeezes ever.
For weeks, I’ve been warning about the excessive bearishness across the speculative futures market (non-commercial traders). And after another update, USD net-short positions are now at their highest level since 2006.
Please see the chart below:
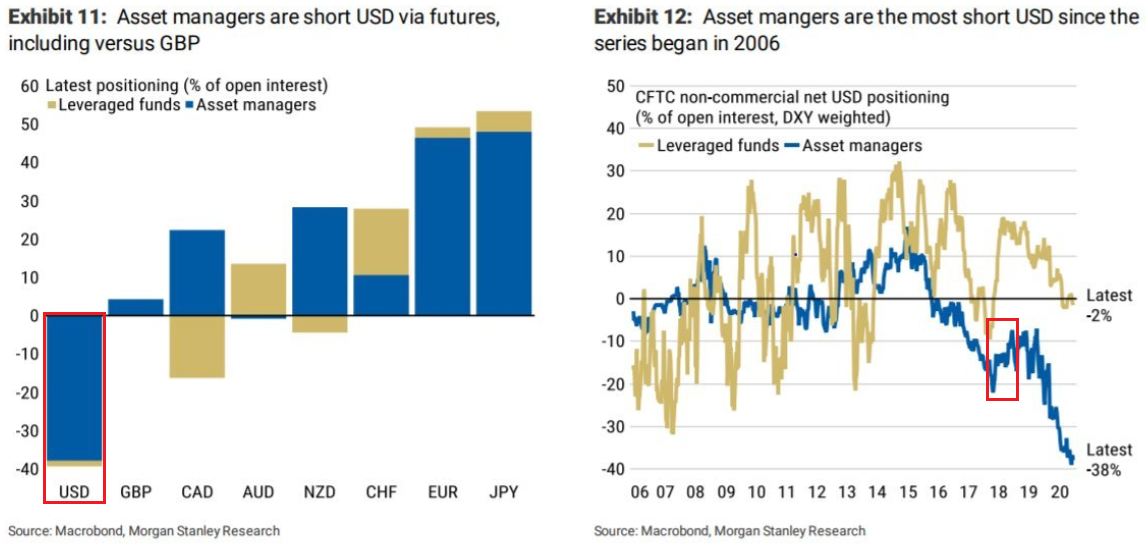
Figure 5 - Net-short futures positions
If you analyze the second red box (Figure 5 - on the right side), you can see that the 2018 top in net-short futures positions ended with a violent short-covering rally, which propelled the USDX nearly 11% higher from trough to peak.
And beginning the New Year in style, the USD Index’s four-day rally is starting to shift sentiment.
I wrote previosuly that the EUR/USD is ground zero in the USDX’s battle for redemption. And whether its retail sales, consumer inflation, monetary spending (relative to GDP) or alternative economic indicators, the euro is inching ever-closer to surrender.
Please see below:
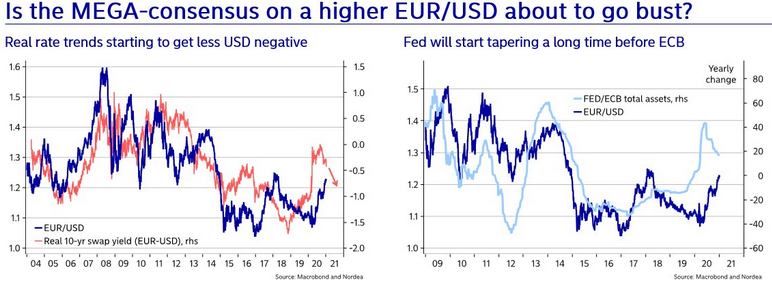
Figure 6
If you analyze the first chart (Figure 6 - on the left), it highlights another issue that I’ve been discussing for some time. On Monday (Jan. 11), the U.S. 10-Year real yield rose to an intraday high of – 0.912%, delivering a 0.168% spread increase in just five trading days. And if you look at the orange line on the chart, you can see that EUR/USD (the dark blue line) tends to follow the direction of real interest rate differentials (the orange line). Thus, if U.S. real yields keep rising (relative to Europe), EUR/USD’s four-day losing streak will likely continue.
Turning to the second chart (Figure 6 - on the right), notice how the EUR/USD tracks the FED/ECB ratio? To explain, the ratio (the light blue line) is calculated by dividing the U.S. Federal Reserve’s (FED) balance sheet by the European Central Bank’s (ECB) balance sheet. Essentially, its direction tells you which monetary authority is printing more money. If you analyze the EUR/USD (the dark blue line), it trades higher when the FED is out-printing the ECB (the light blue line is rising) and trades lower when the ECB is out-printing the FED (the light blue line is falling). The key takeaway? With the light blue line falling, it means that the ECB is outprinting the FED. And if this dynamic continues, the EUR/USD (the dark blue line) should move lower as well.
Making three of a kind, (and like I mentioned at the beginning), futures positioning could be the scream that starts the avalanche.
Please see below:
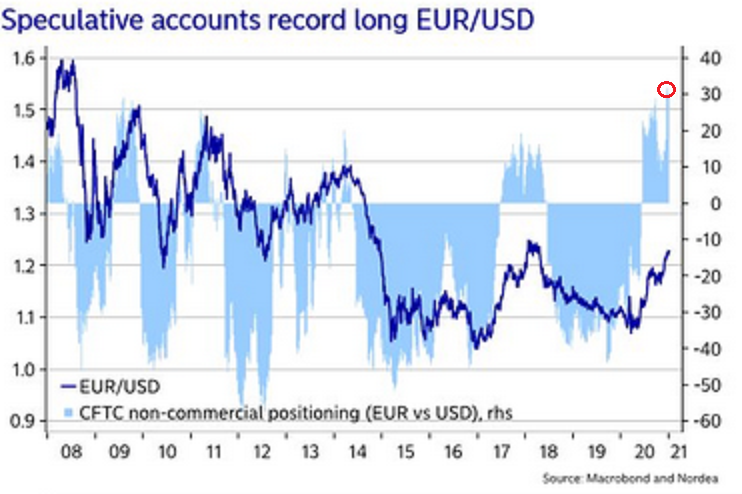
Figure 7
To explain, the light blue bars (Figure 7) represent the net-positioning of non-commercial futures traders (speculators), while the dark blue line is the movement of EUR/USD. Please focus on the red circle at the top-right of the chart: right now, bullish futures bets on EUR/USD are at their highest level since before the financial crisis.
More importantly, notice how one-sided positioning (in both directions) often leads to a sharp reversal?
If you analyze the 2009 to 2011 period, you can see that the EUR/USD plunged almost immediately after speculative futures positioning approached (or hit) the 30-level (using the vertical scale on the right side of the chart). And with today’s positioning already exceeding 30 (the red circle), there is plenty of room for the EUR/USD to move lower.
The Bigger They Are, the Harder They Fall
On Jan. 5, I warned that options activity was mirroring the frenzy (and subsequent crash) we witnessed at the start of September:
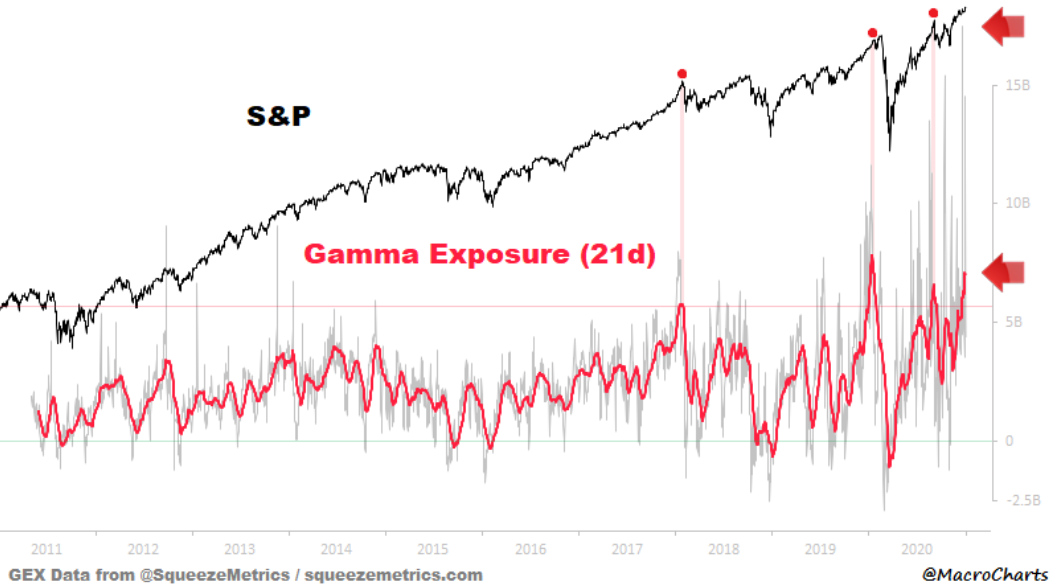
Figure 8 – (Source: MacroCharts)
To explain, the gray bars represent investors’ current Gamma exposure, while the red line represents its 21-day moving average. Right now, the 21-day MA is in the top 0.37% of all-time readings, and only nine days in history have either equalled or exceeded the current value.
And summing up the current market mania, when the U.S. Capitol building was raided (on Jan. 6), more than 29 million call options – the fourth-highest daily total in history – exchanged hands.
Please see below:
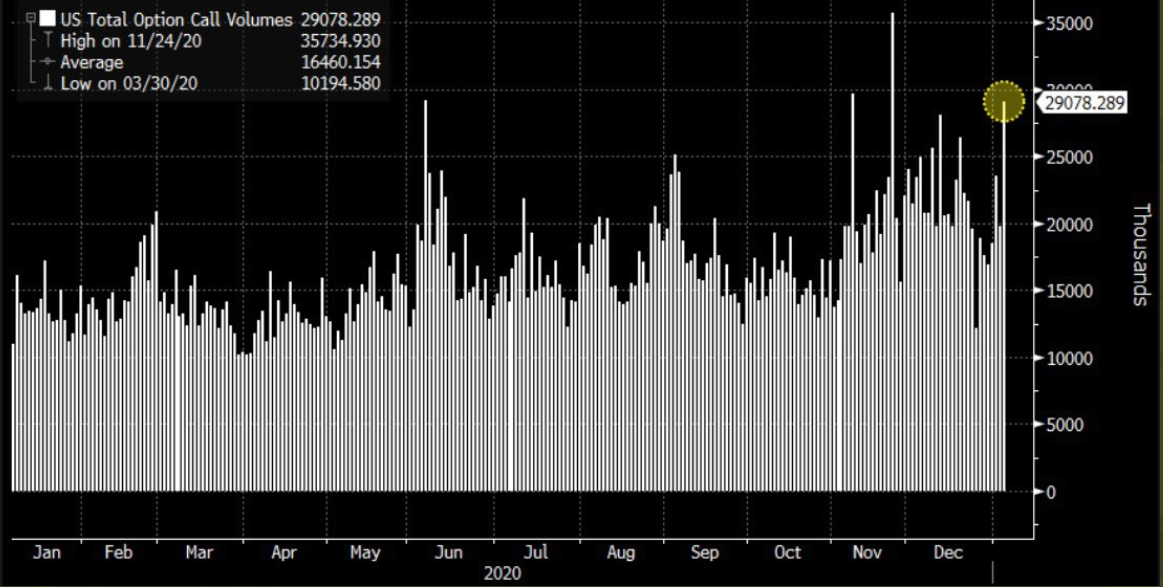
Figure 9 – (Source: Bloomberg/ Sarah Ponczek)
If that wasn’t enough, Citigroup’s Panic/Euphoria model just hit its highest level in ~33 years (the red circle).
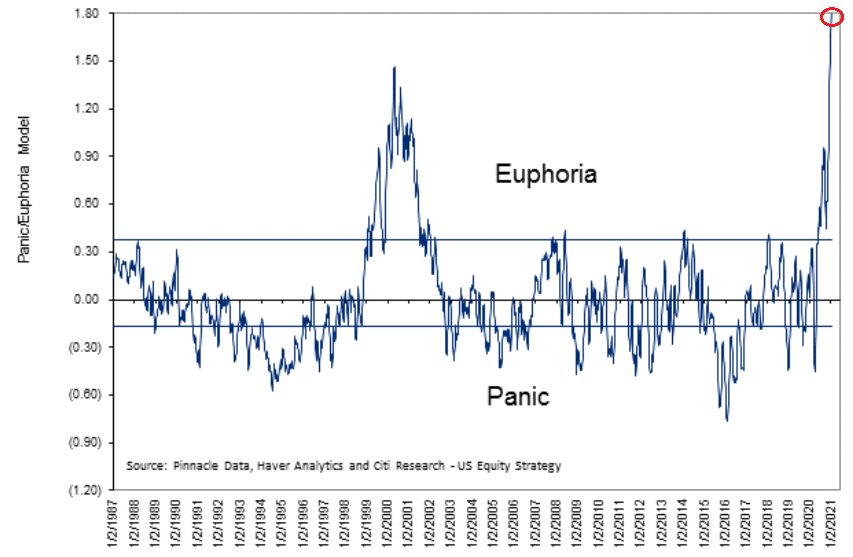
Figure 10
For context, when the indicator hit 1.10, Tobias Levkovich, Citigroup’s chief U.S. equity strategist said that the models’ historical patterns imply a “100% probability of losing money in the coming 12 months.”
Continuing our walk through the real-time museum of record valuations, please take a look at total U.S. market cap relative to Gross Domestic Product (GDP).
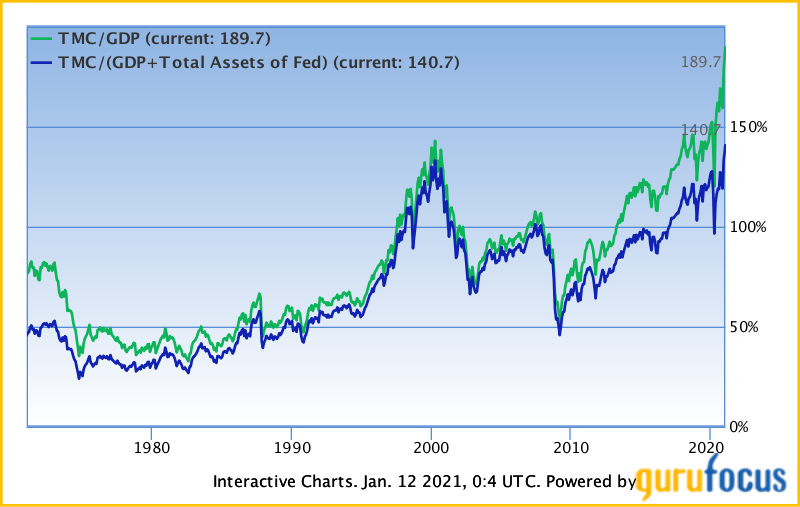
Figure 11
Coined the Buffett Indicator, the green line above divides the Wilshire 5000 Total Market Index (the market value of all actively traded U.S. stocks) by the latest quarterly GDP (Note, the blue line is similar, but adds the value of the FED’s balance sheet.)
Analyzing the data, the current ratio is 189.7%. For context, Mr. Buffett considers the stock market overvalued when the ratio exceeds 100%.
And globally?
Well, it’s more of the same. After the recent run-up, euphoria has pushed the ratio back to the same level (121.09%) that preceded the 2008 crash (As a point of reference, the all-time high was 121.45% in Oct. 2007.)
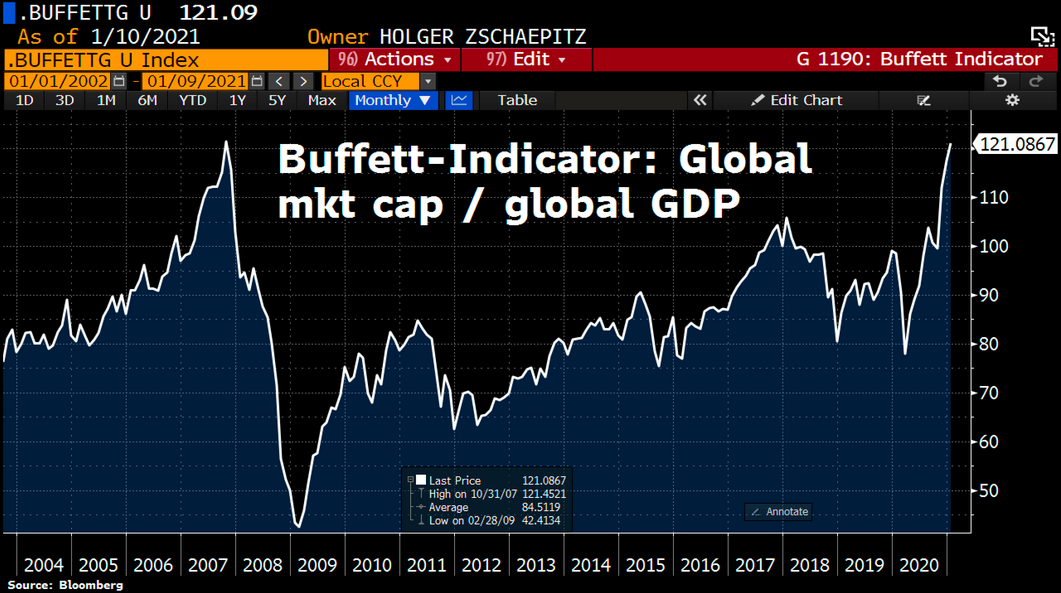
Figure 12
Thus, with equity sentiment, positioning, derivatives activity and valuations going where no man has gone before, investors may need the starship Enterprise to get back down to earth.
And the potential catalyst?
Well, just like the USD Index’s ability to scare the precious metals, a rally in the greenback could also drop the guillotine on equities.
And like a string of dominoes, the negativity will cascade across asset classes and could push the precious metals into a deeper correction or even a short-term bear market.
To clarify, in the long- or even medium-term, trouble for the U.S. economy is a bullish factor for gold. However, initially, just as what we saw in 2008 and in March 2020, gold and especially silver and mining stocks are likely to slide along with the stock market. At some point they would bottom even though stock continue to slide. But at this time, it seems that we’re still early in the slide.
Letters to the Editor
Q: I want to get your opinion and see what your recommendation will be for us if, in the next 10 days, Trump declares the Insurrection Act, the military takes over the country, the Emergency Broadcast System is activated, and possible phone/TV/Internet shutdowns. I don't know how likely this is, but Trump has not officially conceded and there are things at play which are not being reported by the mainstream media. I'd really like to know if you're considering this drastic possibility as I'm sure it would affect gold in a positive way. One question... looking forward, where do you see gold bottoming and beginning the next leg upwards --- or are we looking at an extended down trend beyond the $1700 level you have been talking about as a potential floor?
A: IF the above happens, then after it happens, it will already be too late to prepare in terms of buying gold. One would need to be prepared in advance.
One would also need to be prepared in advance for the above not taking place. In this case, gold might decline as some of the remaining uncertainty would be gone.
Based on how probable the scenario is, one should determine how much capital one wants to dedicate to the hedge in the form of physical gold and silver. In the past years, gold served as a better hedge against geopolitical turmoil than silver, so I’d focus on gold in this case.
BUT.
Simply outlining a scenario doesn’t make it probable. In my opinion, there is an extremely low probability of the above happening. It’s not only because it’s a very radical outcome, and something that happens very rarely in general – especially in the developed countries and especially in the last couple of decades.
It’s also because of how the current U.S. President – Donald Trump – handled many other things during this time whilst holding office. Remember meeting North Korea’s threats with “fire and fury”? Or dismissing the pandemic for a long time? Or any threats regarding Iran? I don’t want to judge those – and other similar – decisions as good or bad, but I do want to emphasize that Donald Trump is very good at talking and creating an impression that something is happening or about to happen, but not necessarily at taking big risks through aggressive, bold actions.
Most people seem to agree that it’s a good thing with regard to military conflicts, but not necessarily good with regard to handling a pandemic. But, again, I’m not the one to judge the rightfulness of the decisions. My point is that the above scenario would require taking an enormous risk from Donald Trump, when he already showed disinterest in taking smaller risks. He would have a lot to lose and not that much to gain (he already was the president of the most powerful country on the planet, after all). Given what we saw in the last few years, given what I read about his approach in one of his books, and given what people that know Donald Trump write about his personality in general, I see an extremely low chance for the materialization of the scenario that was outlined above.
So, how do we prepare for that? By having some gold in physical form. So, what does it change? If one has been following our thoughts on portfolio management it changes absolutely nothing, as we have already been fully invested in the case of “insurance capital” (see the part below summary for details). I don’t think that the possibility of seeing the above scenario should change the allocation in the investment or trading capital. So, to make a long story short, have some physical gold, but don’t overdo it just because of the extremely tiny possibility of seeing something epic in the following weeks.
As far as gold’s downside is concerned, right now it seems most likely to me that we’ll get a rebound from $1,700 but that would not be the final bottom. Gold – after a correction – would be likely to slide again, perhaps for weeks and or even months. It’s not clear at this time. My best guesstimate with regard to time is not more than three months, but this too could be extended. In all cases, I think the decline will end in 2021.
As I’ve been writing previously, I think it’s best to look at the way gold reacts to the USD Index’s performance. The reactions to the stock market’s movement would also be useful. If gold reverses despite the USD’s rally and it happens close to $1,500, it will likely be THE bottom.
Overview of the Upcoming Decline
- As far as the current overview of the upcoming decline is concerned, I think it has already begun.
- During the final part of the slide (which could end within the next 1-12 weeks or so), I expect silver to decline more than miners. That would align with how the markets initially reacted to the COVID-19 threat.
- The impact of all the new rounds of money printing in the U.S. and Europe on the precious metals prices is incredibly positive in the long run, which does not make the short-term decline improbable. Markets can and will get ahead of themselves and decline afterward – sometimes very profoundly – before continuing with their upward climb.
- The plan is to exit the current short positions in miners after they decline far and fast, but at the same time, silver drops just “significantly” (we expect this to happen in 0 – 5 weeks ). In other words, the decline in silver should be severe, but the decline in the miners should look “ridiculous”. That’s what we did in March when we bought practically right at the bottom . It is a soft, but simultaneously broad instruction, so additional confirmations are necessary.
- As a point of reference, given that the inverse pattern above mirrors today’s price action, the duration of the precious metals’ decline could last longer than my initial forecast. Keep in mind though, a prolonged bear market is not my base case; I’m merely indicating that the possibility exists.
- The final bottom in gold could form close to $1,500, after a temporary rebound from about $1,700. The $1,700 is likely to correspond to a move to about $31 in the GDX ETF. We will likely exit the short positions at that time, and we might even open quick long positions. During the next move lower silver might decline more than gold and miners, so we might focus on shorting that market at that time.
- The precious metals market's final bottom is likely to take shape when gold shows significant strength relative to the USD Index . It could take the form of a gold’s rally or a bullish reversal, despite the ongoing USD Index rally.
Summary
Summing up, the outlook for gold and the rest of the precious metals market is bearish for at least the next few weeks. After topping at its triangle-vertex-based reversal, gold moved sharply lower and it just invalidated the breakout above its declining resistance line, while breaking below the rising support line. All this happened as the USD Index rallied visibly above its declining resistance lines and invalidated the breakdown below the 2020 lows. This creates a strongly bearish combination for the precious metals market.
The USD Index and cryptocurrencies suggest that we’re seeing the repeat of early 2018, when the USD Index bottomed. Given the current correlations between PMs and the USD Index, the rally in the USDX is likely to have very bearish implications for the precious metals market.
Despite a recent decline, it seems that the USD Index is going to move higher in the following months and weeks, in turn causing gold to decline. At some point gold is likely to stop responding to dollar’s bearish indications, and based on the above analysis, it seems that this is already taking place.
Naturally, everyone's trading is their responsibility. But in our opinion, if there ever was a time to either enter a short position in the miners or increase its size if it was not already sizable, it's now. We made money on the March decline, and on the March rebound, with another massive slide already underway.
After the sell-off (that takes gold to about $1,500), we expect the precious metals to rally significantly. The final part of the decline might take as little as 1-5 weeks, so it's important to stay alert to any changes.
Most importantly, please stay healthy and safe. We made a lot of money on the March decline and the subsequent rebound (its initial part) price moves (and we'll likely earn much more in the following weeks and months), but you have to be healthy to enjoy the results.
As always, we'll keep you - our subscribers - informed.
To summarize:
Trading capital (supplementary part of the portfolio; our opinion): Full speculative short positions (300% of the full position) in mining stocks is justified from the risk to reward point of view with the following binding exit profit-take price levels:
Senior mining stocks (price levels for the GDX ETF): binding profit-take exit price: $32.02; stop-loss: none (the volatility is too big to justify a SL order in case of this particular trade); binding profit-take level for the DUST ETF: $28.73; stop-loss for the DUST ETF: none (the volatility is too big to justify a SL order in case of this particular trade)
Junior mining stocks (price levels for the GDXJ ETF): binding profit-take exit price: $42.72; stop-loss: none (the volatility is too big to justify a SL order in case of this particular trade); binding profit-take level for the JDST ETF: $21.22; stop-loss for the JDST ETF: none (the volatility is too big to justify a SL order in case of this particular trade)
For-your-information targets (our opinion; we continue to think that mining stocks are the preferred way of taking advantage of the upcoming price move, but if for whatever reason one wants / has to use silver or gold for this trade, we are providing the details anyway. In our view, silver has greater potential than gold does):
Silver futures downside profit-take exit price: unclear at this time - initially, it might be a good idea to exit, when gold moves to $1,703.
Gold futures downside profit-take exit price: $1,703
Long-term capital (core part of the portfolio; our opinion): No positions (in other words: cash
Insurance capital (core part of the portfolio; our opinion): Full position
Whether you already subscribed or not, we encourage you to find out how to make the most of our alerts and read our replies to the most common alert-and-gold-trading-related-questions.
Please note that we describe the situation for the day that the alert is posted in the trading section. In other words, if we are writing about a speculative position, it means that it is up-to-date on the day it was posted. We are also featuring the initial target prices to decide whether keeping a position on a given day is in tune with your approach (some moves are too small for medium-term traders, and some might appear too big for day-traders).
Additionally, you might want to read why our stop-loss orders are usually relatively far from the current price.
Please note that a full position doesn't mean using all of the capital for a given trade. You will find details on our thoughts on gold portfolio structuring in the Key Insights section on our website.
As a reminder - "initial target price" means exactly that - an "initial" one. It's not a price level at which we suggest closing positions. If this becomes the case (like it did in the previous trade), we will refer to these levels as levels of exit orders (exactly as we've done previously). Stop-loss levels, however, are naturally not "initial", but something that, in our opinion, might be entered as an order.
Since it is impossible to synchronize target prices and stop-loss levels for all the ETFs and ETNs with the main markets that we provide these levels for (gold, silver and mining stocks - the GDX ETF), the stop-loss levels and target prices for other ETNs and ETF (among other: UGL, GLL, AGQ, ZSL, NUGT, DUST, JNUG, JDST) are provided as supplementary, and not as "final". This means that if a stop-loss or a target level is reached for any of the "additional instruments" (GLL for instance), but not for the "main instrument" (gold in this case), we will view positions in both gold and GLL as still open and the stop-loss for GLL would have to be moved lower. On the other hand, if gold moves to a stop-loss level but GLL doesn't, then we will view both positions (in gold and GLL) as closed. In other words, since it's not possible to be 100% certain that each related instrument moves to a given level when the underlying instrument does, we can't provide levels that would be binding. The levels that we do provide are our best estimate of the levels that will correspond to the levels in the underlying assets, but it will be the underlying assets that one will need to focus on regarding the signs pointing to closing a given position or keeping it open. We might adjust the levels in the "additional instruments" without adjusting the levels in the "main instruments", which will simply mean that we have improved our estimation of these levels, not that we changed our outlook on the markets. We are already working on a tool that would update these levels daily for the most popular ETFs, ETNs and individual mining stocks.
Our preferred ways to invest in and to trade gold along with the reasoning can be found in the how to buy gold section. Furthermore, our preferred ETFs and ETNs can be found in our Gold & Silver ETF Ranking.
As a reminder, Gold & Silver Trading Alerts are posted before or on each trading day (we usually post them before the opening bell, but we don't promise doing that each day). If there's anything urgent, we will send you an additional small alert before posting the main one.
Thank you.
Przemyslaw Radomski, CFA
Founder, Editor-in-chief

