

Briefly: in our opinion, full (300% of the regular position size) speculative short positions in mining stocks are justified from the risk/reward point of view at the moment of publishing this Alert.
Over the last 24 hours, the precious metals market did more or less nothing, despite the new daily decline in the USD Index. The latter is now testing its monthly and yearly lows, while the PMs are not. PMs – as a group – are not reacting to what should make them rally, and this is yet another bearish sign for the precious metals market.
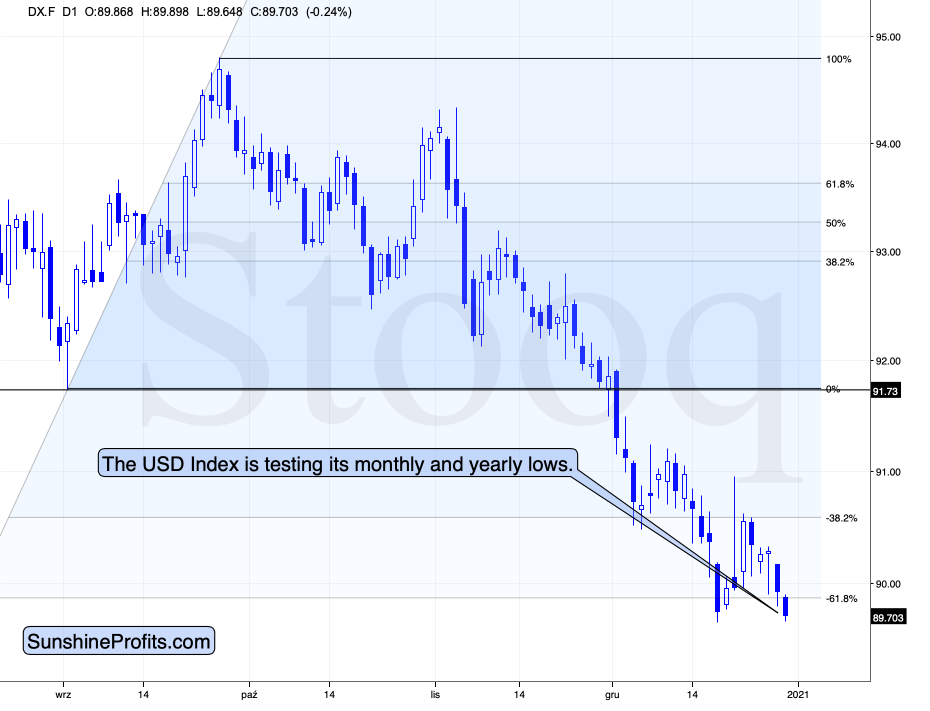
Figure 1 - USD Index (Sept – Dec 2020)
The USDX is at its monthly and yearly lows and at the same time…
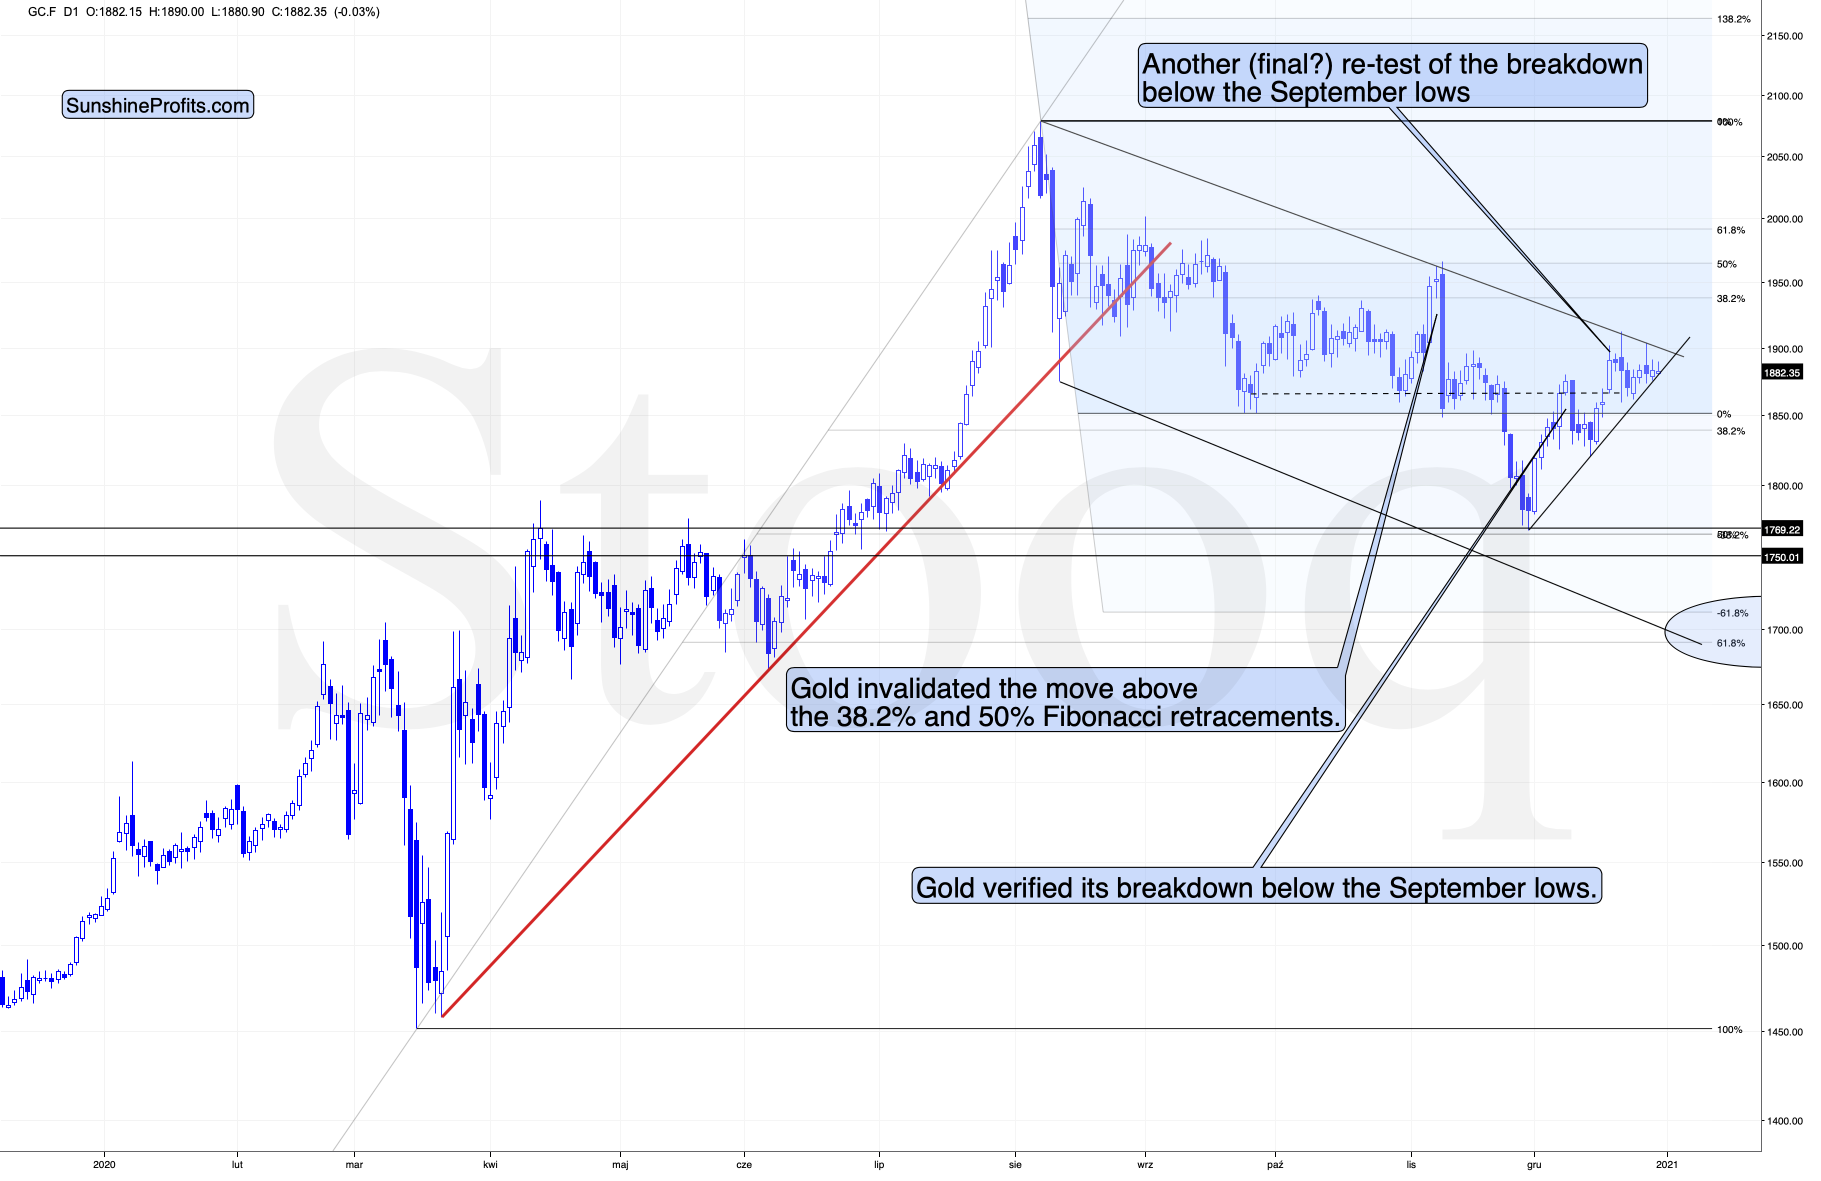
Figure 2 - COMEX Gold Futures (Jan – Dec 2020)
Gold is about $30 below its monthly high, and about $200 below the yearly low.
After a temporary breakout, gold is back below its 2011 high. The breakout above the latter was clearly invalidated.
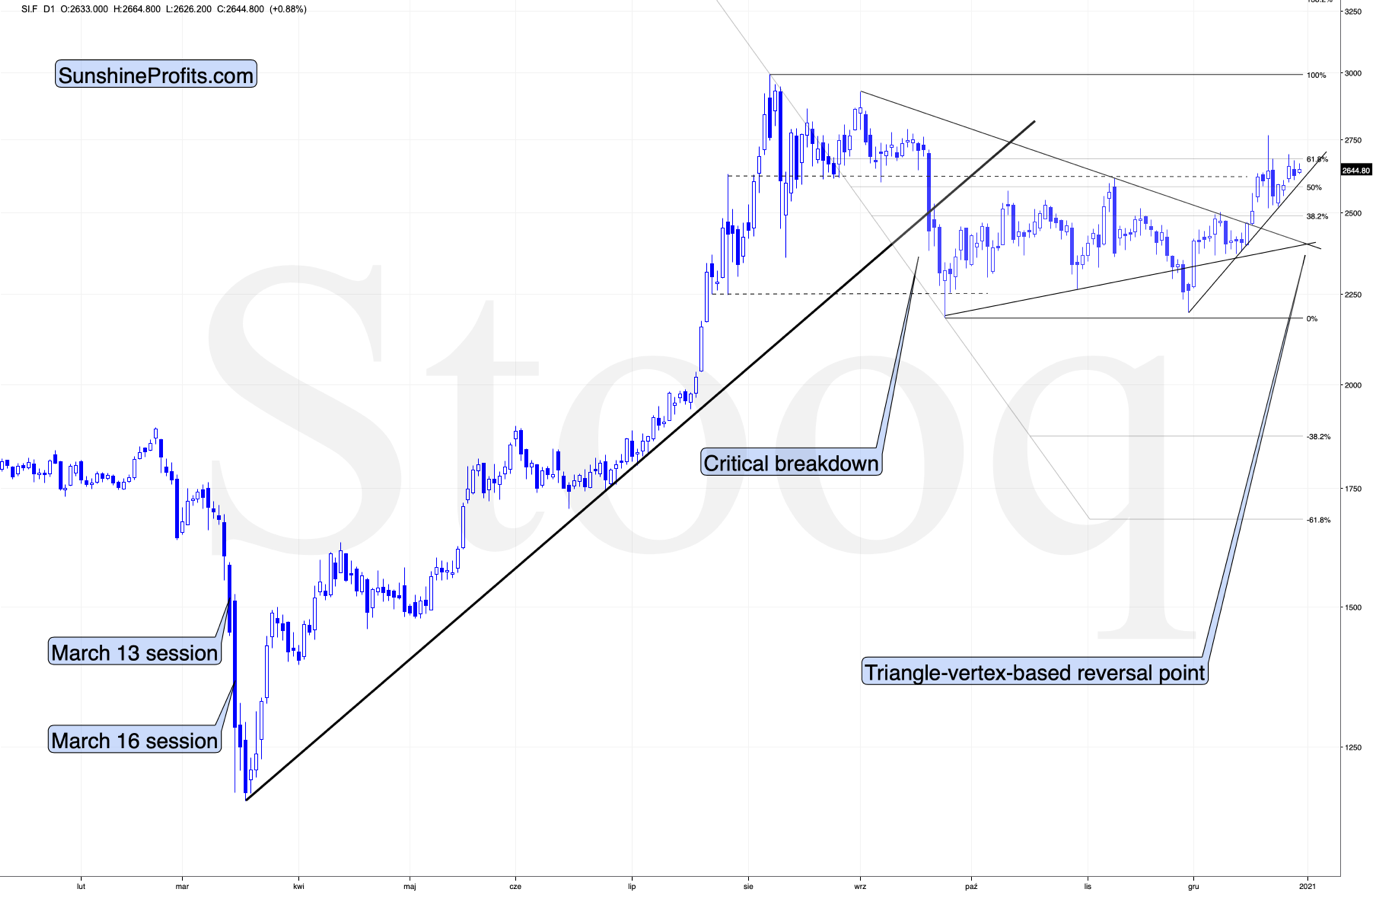
Figure 3 - COMEX Silver Futures (Jan – Dec 2020)
Silver is not even close to its 2011 high, and while it’s relatively strong compared to gold and miners on a short-term basis, it’s not at its December high right now. It’s also a few dollars below its yearly high.
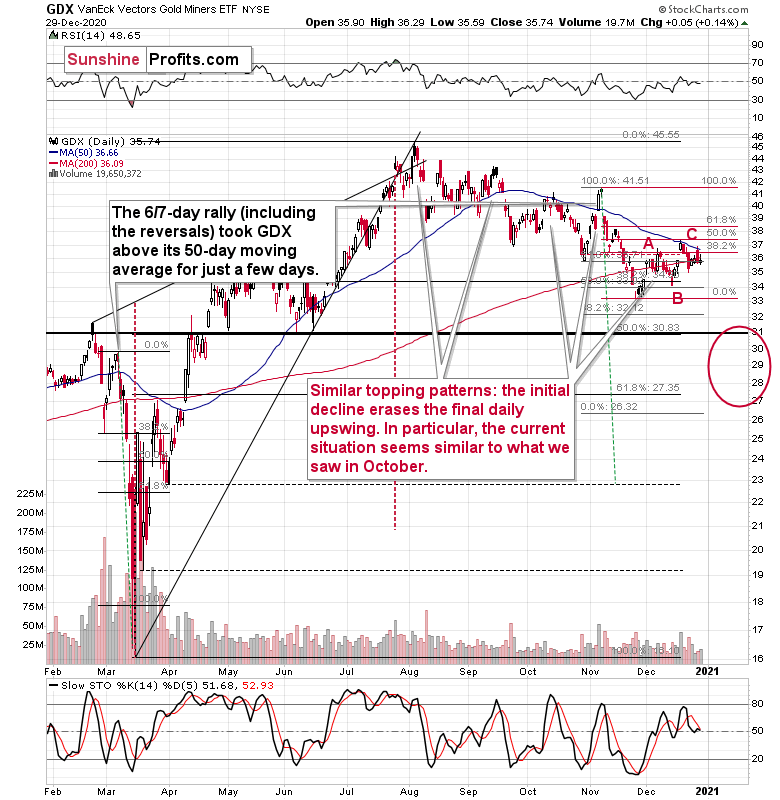
Figure 4 - GDX VanEck Vectors Gold Miners ETF (Feb – Dec 2020)
Miners did almost nothing yesterday, so practically all of yesterday’s comments on their performance remain up-to-date:
We see that the GDX ETF moved lower once again despite the intraday attempt to rally. During yesterday’s session, miners once again moved back to their 50-day moving average and… Once again verified it as resistance. The implications are bearish.
Let’s get back to silver once again. On its chart, you can see a triangle-vertex-based reversal at the end of the year. Before the price moves close to the reversal, it’s relatively unclear what kind of implications a given reversal is likely to have. Well, including today’s session, there remain only three sessions until the end of the year, so we’re likely to see the reversal shortly.
Based on the likelihood that the next big move is going to be to the downside, it would fit the overall picture more if the upcoming reversal was a top, not a bottom. A bottom would imply a rally in the following days or weeks, and the relative performance (as described above and yesterday) along with other factors (as described yesterday) continues to favor a bigger decline.
This means that we might not see a meaningful decline for a few more days, and we might even see one final move higher before the top is formed. This could be something that takes place in silver only, or something that we see in gold and miners as well. Still, I don’t expect it to be really significant in case of the latter. They are underperforming the metals, after all.
Before summarizing, let’s discuss the USD Index’s main part – the EUR/USD currency pair in greater detail. After all, this pair often moves in tandem with gold.
EUR/USD Decouples from Fundamentals
John Maynard Keynes once said, “Markets can remain irrational longer than you can remain solvent.”
And right now, EUR/USD is putting his theory to the test.
Because the euro accounts for nearly 58% of the movement in the USD Index, its rise (and likely fall) will determine if/when the war is won.
But brimming with confidence and unwilling to wave the white flag, the EUR/USD has been green for five straight days and has rallied during nine of the last 12 trading days. And while sentiment and momentum are warriors that don’t die easy, the euro is losing fundamental soldiers left and right.
Please see the chart below:
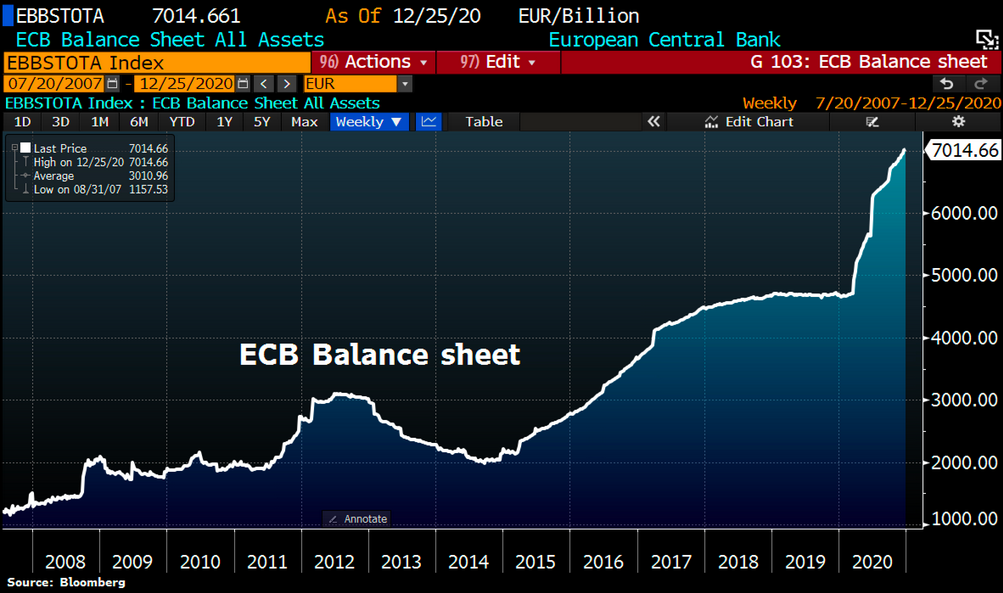
Figure 5 - European Central Bank (ECB) Balance Sheet
Another weekly update shows the European Central Bank’s (ECB) money printer continues to work overtime. And as I mentioned on Monday (Dec. 28), the ECB’s total assets now equal 69% of Eurozone GDP – nearly double the U.S. Federal Reserve’s (FED) 35%.
And why is this necessary?
Because the Eurozone economy is in free-fall.
Remember, currencies trade on a relative basis. Thus, a less-bad U.S. economy is good news for the U.S. dollar.
Please see below:
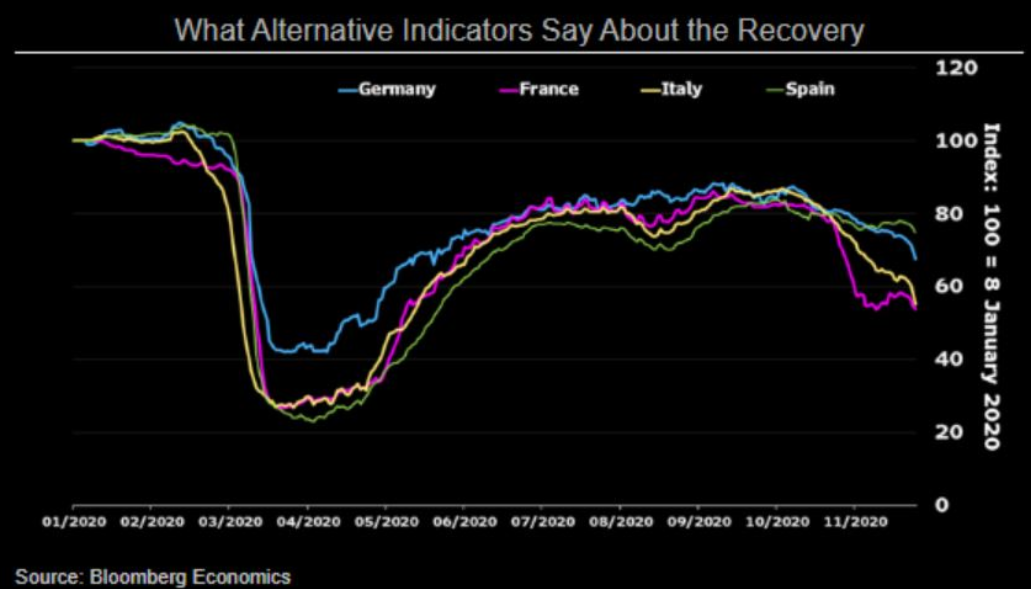
Figure 6 - 2020 Economic Indicators for Germany, France, Italy, Spain
Across Europe’s largest economies – Germany, France, Italy and Spain – economic activity is rolling over (To explain the chart, alternative economic indicators are high-frequency data like credit card spending, indoor dining traffic, travel activity and location information.)
And underpinning the irrationality, the deceleration is happening as the euro is strengthening.
Makes sense?
Well, considering Spain’s retail sales dipped further into negative territory on Monday (Dec. 28) – coming in at – 5.8% vs. – 5.3% expected – the data speaks for itself.
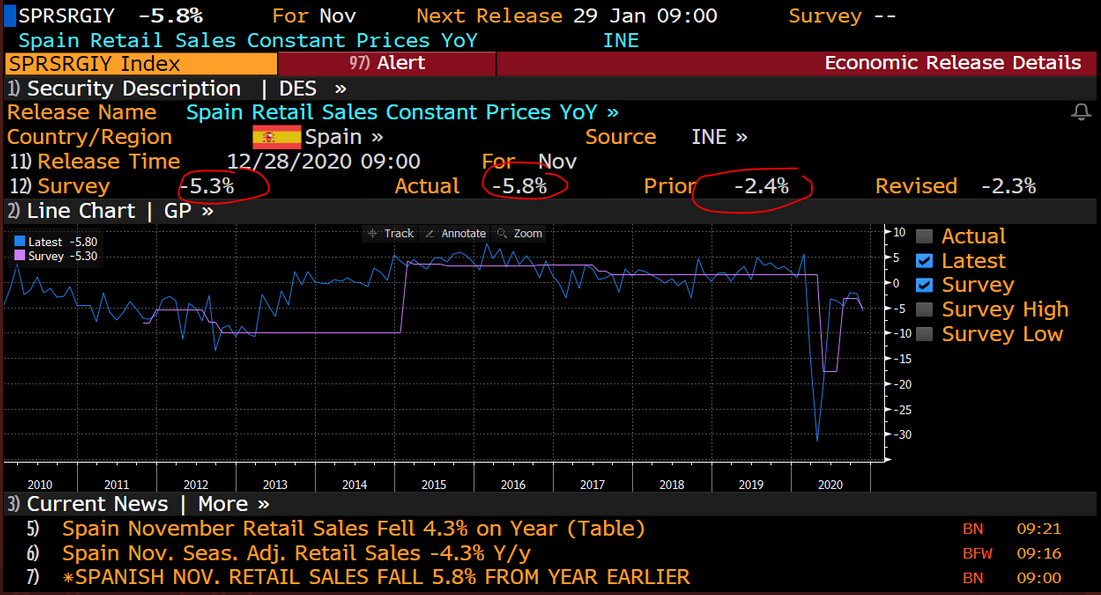
Figure 7 - Spain Retail Sales Constant Prices (Source: Bloomberg/Daniel Lacalle)
The bottom line is: the euro bulls are fighting a war they’re unlikely to win. And as the fundamental data worsens, it’s analogous to a platoon losing more and more soldiers. Eventually, the infantry runs out of reserves and it’s time to wave the white flag.
And then what happens?
Well, then history tries to explain how it all went wrong.
No Margin of Safety
Expanding on the margin frenzy I highlighted yesterday (with FINRA reporting that monthly margin debt sits at a five-year high), retail investors continue to party like it’s 1999 (which was exactly the year before the final decline took place in gold, silver and mining stocks – the HUI Index declined about 65% from its 1999 high to its 2000 bottom).
Despite lessons learned (or not) from the dot-com bubble’s rags-to-riches-to-rags story, today’s speculation makes 1999 look like an appetizer.
Right now, money flowing into leveraged-long ETFs is either near or exceeds all-time highs. To explain, leveraged-long ETFs are often advertised as 2x (50% margin) or 3x (67% margin) a particular asset (can be the S&P 500, crude oil or the FAANG index). And just like an individual investor borrowing money to buy stocks, a fund uses debt to increase its total assets. In turn, investors increase their gains when the underlying asset appreciates and increase their losses when the underlying asset declines (As an example, a 3x leveraged-long ETF loses 100% of its equity after a ~33% decline – assuming that it happened over one day – in case of longer periods it would look different, but the losses would be huge anyway.)
Please see the chart below:
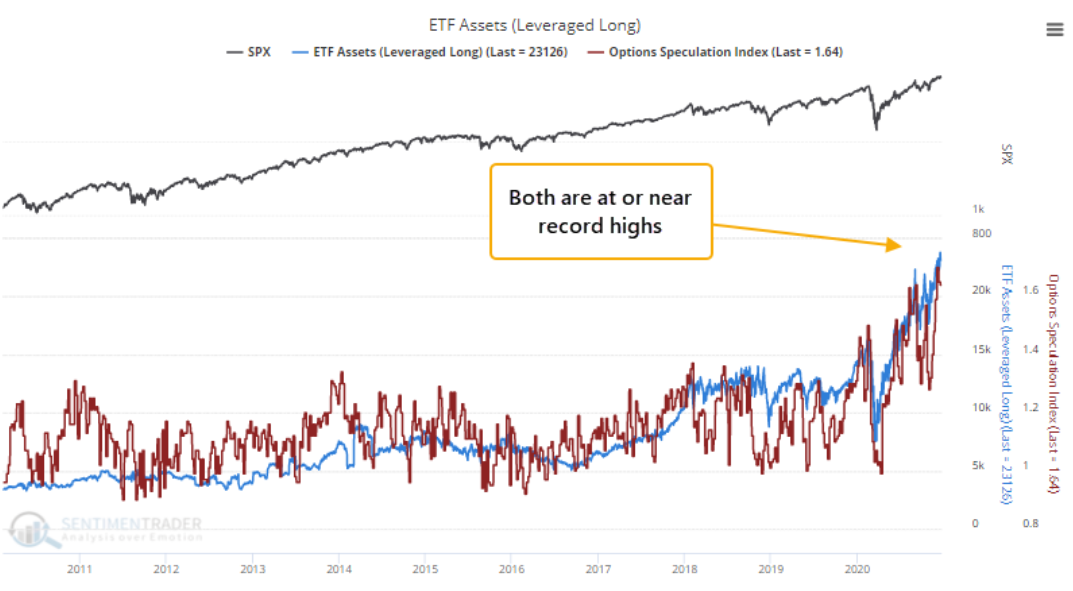
Figure 8 - ETF Assets (Source: SentimenTrader)
If you analyze the bottom-half of the chart, the blue line represents the total assets (money under management) of leveraged-long ETFs. And why the vertical move higher in 2020? Well, with investors betting that the FED will morph into The Dark Knight at the first sign of trouble, they believe excessive risk is risk-free.
But as the mania unfolds and U.S. equities make new all-time highs, insiders aren’t joining the party. For context, insiders are executives of S&P 500 companies who periodically buy and sell their own stock. Because ‘insiders’ possess inside information about their companies’ fundamentals, their buying/selling activity is a relatively reliable indicator of the markets’ future prospects.
Please see below:
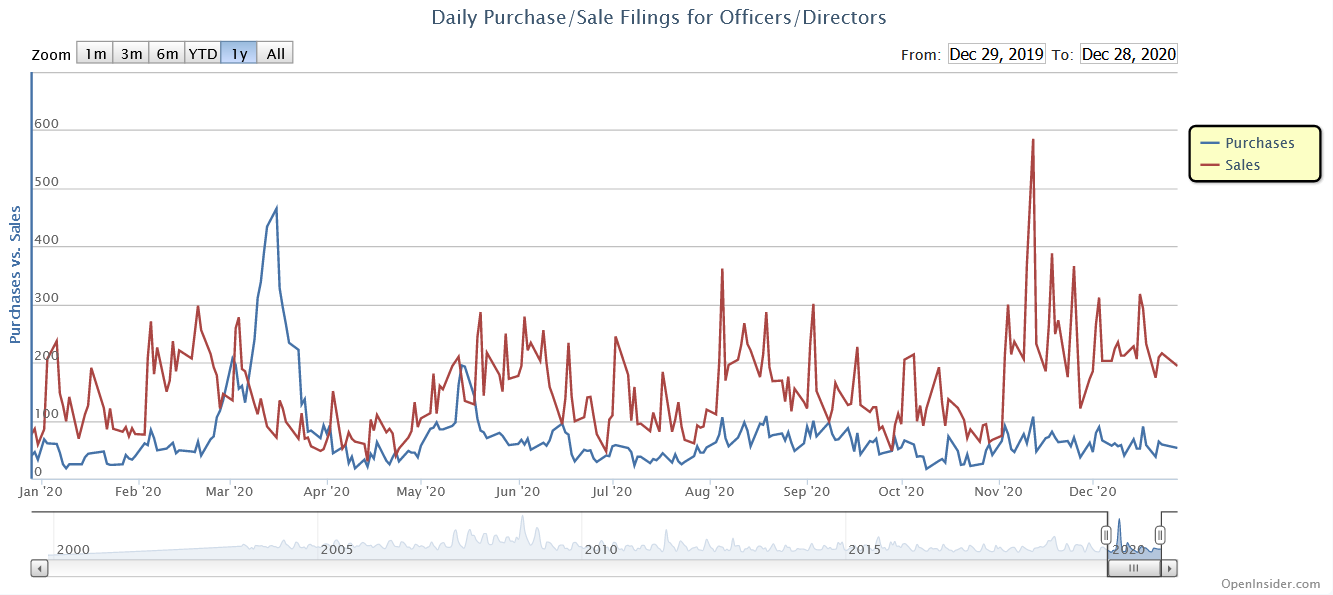
Figure 9 - Daily Purchase/Sale Filings for Officers/Directors (Source: OpenInsider)
To explain, the blue line at the bottom represents insider purchases, while the red line represents insider sales. As you can see (given the flat-to-declining blue line) company executives aren’t hitting the bid.
And because leverage is the engine that’s driven this entire rally, the slightest shift in sentiment could lead to a massive derailment.
Furthermore, like a feather on a fencepost, if a gust of wind tears the roof off equities, the precious metals will feel the blow – at least initially. Thus, while the daily price action implies clear skies ahead, remember, this weatherman (Mr. Market) is wrong more often than he’s right.
Letters to the Editor
Q: Hi, Is it good time to short Silver? We are at 26.40 at the time of writing this email. If yes, what should be the stop loss and expected target price?
Re: DXY > is it now time to go long? It is currently trading at 89.96. Any levels to bear in mind?
A: Silver looks to be topping here, but the second question almost explains itself as to why I’m not featuring a silver trade at this time. It’s because close to the tops silver could outperform and soar above previous resistance levels only to then slide back down. The problem is with telling how high silver can get on a temporary basis, and how “high” is “really too high”. This means that in such times, it’s very difficult to place a stop-loss level. The latter are usually placed slightly above resistance levels, so that only a visible breakout above the resistance would trigger it.
The underlying assumption here is that a breakout changes the short-term outlook for a given asset. And this assumption is true in the vast majority of cases, but not necessarily in case of silver. And definitely not in the case of silver if mining stocks are underperforming, as it all suggests that the silver breakouts should be either ignored or even viewed as a sell sign. Is there a level that silver is almost certainly not going to break before plunging? Sure, but it’s $35, or higher. Placing it so high means that one has to be able to bear a lot of losses (in percentage terms) on a certain position, which in turn means that the position itself has to be very small, so that the possible losses in dollar terms are not huge. This greatly decreases the profit potential that theoretically a short position in silver should have right now.
Instead, I think that it’s much better to focus on the part of the precious metals market that is likely to be much more predictable, that is already after many weeks and months of underperformance and that is unlikely to rally far even if gold does, while it’s likely to fall far when gold does. Of course, I’m referring to mining stocks. The above is why instead of having a regular (or relatively big) position in gold, silver, and mining stocks, I prefer to have a very large one, but just in the mining stocks.
Normally, diversification decreases risk, but in the current circumstances, this might not be the case – especially with regard to silver.
As far as the USD Index is concerned, this (at about 90) could be the final bottom for months, but it’s also possible that the USD Index first moves to its 2018 lows and then soars with vengeance. Consequently, if one wants to trade the USDX, I would place the stop-loss level below the 2018 low. My focus remains on the mining stocks as I think the risk to reward ratio in case of miners’ decline is much better than in case of silver’s decline or the USD Index’s rally from these levels. If I had to choose, I’d still go with the USDX trade instead of the silver one. The downside of the trade seems more predictable and the markets (miners and silver or USDX) are more different in case of the miners-USD combo than in case of the miners-silver combo, which means that the benefits from diversification would be greater as well. Again, I’m sticking with a short position in the miners only.
Overview of the Upcoming Decline
- As far as the current overview of the upcoming decline is concerned, I think it has already begun.
- During the final part of the slide (which could end within the next 1-10 weeks or so), I expect silver to decline more than miners. That would align with how the markets initially reacted to the COVID-19 threat.
- The impact of all the new rounds of money printing in the U.S. and Europe on the precious metals prices is incredibly positive in the long run, which does not make the short-term decline improbable. Markets can and will get ahead of themselves and decline afterward – sometimes very profoundly – before continuing with their upward climb.
- The plan is to exit the current short positions in miners after they decline far and fast, but at the same time, silver drops just “significantly” (we expect this to happen in 1 – 5 weeks ). In other words, the decline in silver should be severe, but the decline in the miners should look “ridiculous”. That’s what we did in March when we bought practically right at the bottom . It is a soft, but simultaneously broad instruction, so additional confirmations are necessary.
- I expect this confirmation to come from gold, reaching about $1,700 - $1,750 . If – at the same time – gold moves to about $1,700 - $1,750 and miners are already after a ridiculously big drop (say, to $31 - $32 in the GDX ETF – or lower), we will probably exit the short positions in the miners and at the same time enter short positions in silver. However, it could also be the case that we’ll wait for a rebound before re-entering short position in silver – it’s too early to say at this time. It’s also possible that we’ll enter very quick long positions between those short positions.
- The precious metals market's final bottom is likely to take shape when gold shows significant strength relative to the USD Index . It could take the form of a gold’s rally or a bullish reversal, despite the ongoing USD Index rally.
Summary
While Christmas came early for the precious metals last week, the holiday cheer isn’t likely to last very long. Despite doing its best Santa Clause impersonation, silver’s gift-giving isn’t rubbing off on gold or the gold miners. And given its relative outperformance, it’s most likely only a matter of time before silver’s sleigh crashes.
The divergent price action signals that the next move lower in the precious metals market is already underway. It will likely take another 1-5 weeks to play out (or perhaps even longer), with gold falling to or below $1,700 and with a substantial decline in silver (downside target is unclear) and miners ($1,700 in gold is likely to correspond to about $31 in GDX).
Remember, the recent upswing is a relatively normal bounce within a bigger decline. And after last week’s drawdown, this corrective upswing might have already ended.
Despite a recent decline, it seems that the USD Index is going to move higher in the following months and weeks, in turn causing gold to decline. At some point gold is likely to stop responding to dollar’s bearish indications, and based on the above analysis, it seems that this is already taking place.
Naturally, everyone's trading is their responsibility. But in our opinion, if there ever was a time to either enter a short position in the miners or increase its size if it was not already sizable, it's now. We made money on the March decline, and on the March rebound, with another massive slide already underway.
After the sell-off (that takes gold to about$1,700 or lower), we expect the precious metals to rally significantly. The final decline might take as little as 1-5 weeks, so it's important to stay alert to any changes.
Most importantly, please stay healthy and safe. We made a lot of money on the March decline and the subsequent rebound (its initial part) price moves (and we'll likely earn much more in the following weeks and months), but you have to be healthy to enjoy the results.
As always, we'll keep you - our subscribers - informed.
To summarize:
Trading capital (supplementary part of the portfolio; our opinion): Full speculative short positions (300% of the full position) in mining stocks is justified from the risk to reward point of view with the following binding exit profit-take price levels:
Senior mining stocks (price levels for the GDX ETF): binding profit-take exit price: $32.02; stop-loss: none (the volatility is too big to justify a SL order in case of this particular trade); binding profit-take level for the DUST ETF: $28.73; stop-loss for the DUST ETF: none (the volatility is too big to justify a SL order in case of this particular trade)
Junior mining stocks (price levels for the GDXJ ETF): binding profit-take exit price: $42.72; stop-loss: none (the volatility is too big to justify a SL order in case of this particular trade); binding profit-take level for the JDST ETF: $21.22; stop-loss for the JDST ETF: none (the volatility is too big to justify a SL order in case of this particular trade)
For-your-information targets (our opinion; we continue to think that mining stocks are the preferred way of taking advantage of the upcoming price move, but if for whatever reason one wants / has to use silver or gold for this trade, we are providing the details anyway. In our view, silver has greater potential than gold does):
Silver futures downside profit-take exit price: unclear at this time - initially, it might be a good idea to exit, when gold moves to $1,703.
Gold futures downside profit-take exit price: $1,703
Long-term capital (core part of the portfolio; our opinion): No positions (in other words: cash
Insurance capital (core part of the portfolio; our opinion): Full position
Whether you already subscribed or not, we encourage you to find out how to make the most of our alerts and read our replies to the most common alert-and-gold-trading-related-questions.
Please note that we describe the situation for the day that the alert is posted in the trading section. In other words, if we are writing about a speculative position, it means that it is up-to-date on the day it was posted. We are also featuring the initial target prices to decide whether keeping a position on a given day is in tune with your approach (some moves are too small for medium-term traders, and some might appear too big for day-traders).
Additionally, you might want to read why our stop-loss orders are usually relatively far from the current price.
Please note that a full position doesn't mean using all of the capital for a given trade. You will find details on our thoughts on gold portfolio structuring in the Key Insights section on our website.
As a reminder - "initial target price" means exactly that - an "initial" one. It's not a price level at which we suggest closing positions. If this becomes the case (like it did in the previous trade), we will refer to these levels as levels of exit orders (exactly as we've done previously). Stop-loss levels, however, are naturally not "initial", but something that, in our opinion, might be entered as an order.
Since it is impossible to synchronize target prices and stop-loss levels for all the ETFs and ETNs with the main markets that we provide these levels for (gold, silver and mining stocks - the GDX ETF), the stop-loss levels and target prices for other ETNs and ETF (among other: UGL, GLL, AGQ, ZSL, NUGT, DUST, JNUG, JDST) are provided as supplementary, and not as "final". This means that if a stop-loss or a target level is reached for any of the "additional instruments" (GLL for instance), but not for the "main instrument" (gold in this case), we will view positions in both gold and GLL as still open and the stop-loss for GLL would have to be moved lower. On the other hand, if gold moves to a stop-loss level but GLL doesn't, then we will view both positions (in gold and GLL) as closed. In other words, since it's not possible to be 100% certain that each related instrument moves to a given level when the underlying instrument does, we can't provide levels that would be binding. The levels that we do provide are our best estimate of the levels that will correspond to the levels in the underlying assets, but it will be the underlying assets that one will need to focus on regarding the signs pointing to closing a given position or keeping it open. We might adjust the levels in the "additional instruments" without adjusting the levels in the "main instruments", which will simply mean that we have improved our estimation of these levels, not that we changed our outlook on the markets. We are already working on a tool that would update these levels daily for the most popular ETFs, ETNs and individual mining stocks.
Our preferred ways to invest in and to trade gold along with the reasoning can be found in the how to buy gold section. Furthermore, our preferred ETFs and ETNs can be found in our Gold & Silver ETF Ranking.
As a reminder, Gold & Silver Trading Alerts are posted before or on each trading day (we usually post them before the opening bell, but we don't promise doing that each day). If there's anything urgent, we will send you an additional small alert before posting the main one.
Thank you.
Przemyslaw Radomski, CFAFounder, Editor-in-chief

