

Briefly: in our opinion, full (300% of the regular position size) speculative short positions in mining stocks are justified from the risk/reward point of view at the moment of publishing this Alert.
Today’s technical part of the analysis is going to be very brief, because of two reasons. First, very little happened during yesterday’s (Mar. 24) session. Second, what occurred simply confirmed what I had written earlier. There are two important things that happened yesterday, which can be considered signs. They both confirm the bearish outlook for the short term and they both indicate that our profitable short positions are likely to become much more profitable in the near future.
The first sign – just like yesterday – came from the mining stocks. Let’s start with a quote from yesterday’s comments on the 4-hour GDX ETF chart:
If you’ve been waiting for a high-quality sign that the next big move in the precious metals sector is underway – you just got it.
There are days on the markets when nothing happens, there are days when what happens is visible only to some (like Monday’s session), and there are days when the market’s signals are crystal-clear – as if the charts were practically screaming at the person examining them. Yesterday, was one of the latter kind of days.
Without further ado, let’s take a look at the key development that we just saw in the precious metals’ world – the big decline in the GDX ETF – proxy for mining stocks.
[NOTE: THE CHART BELOW IS JUST LIKE YOU SAW IT YESTERDAY]
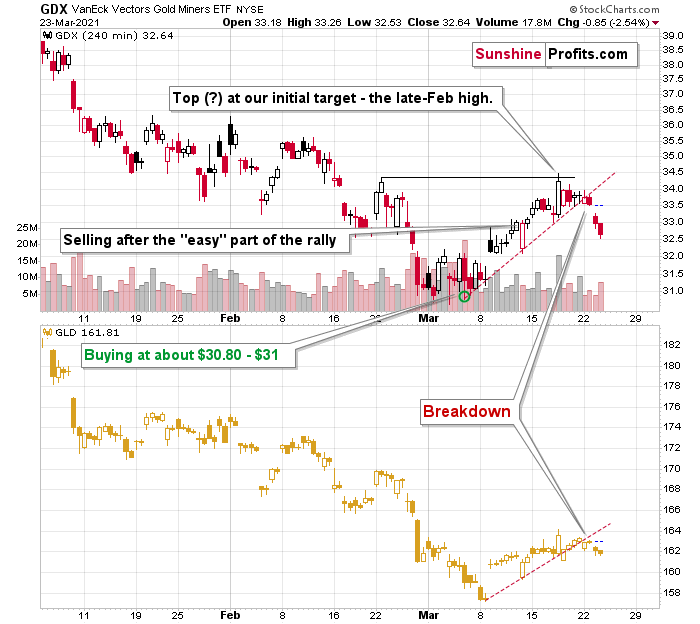
After the tiny breakdown that I described yesterday (Mar. 24), the GDX ETF declined significantly, and it even opened the session with a price gap. If you look at the left side of the chart, you’ll see that this is the way in which the big January decline started. In the next 2 months, the value of the GDX ETF declined by over $8.
The reason that I left the chart without yesterday’s price changes is that I want you to be able to easily compare both of them and the changes that took place.
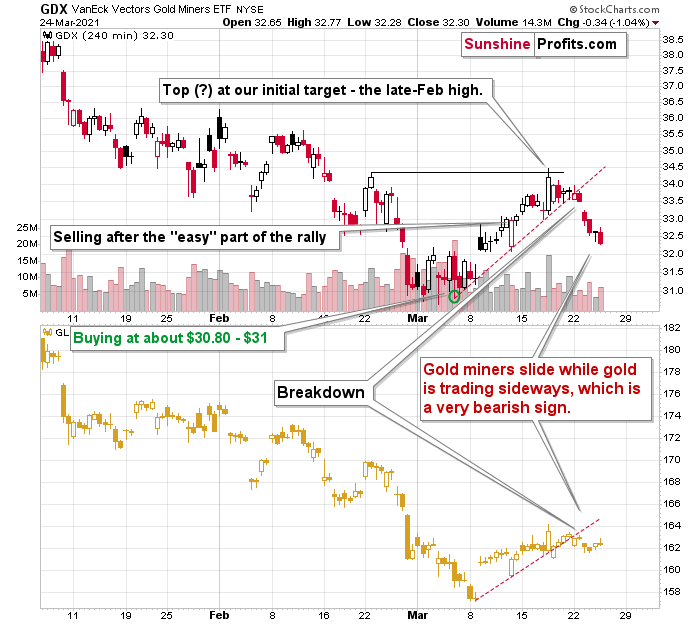
Gold (here: GLD) ended the session higher (precisely: $0.56 or 0.35% higher) while the GDX ended the day lower ($0.34 or 1.04% lower).
In other words, miners want to decline so badly that they ignored the move higher in gold and declined anyway! Seeing this after a bearish price gap and a breakdown is practically as bearish as this chart could get in the short run.
The second sign: At the moment of writing these words, the USD Index is breaking to new yearly highs.
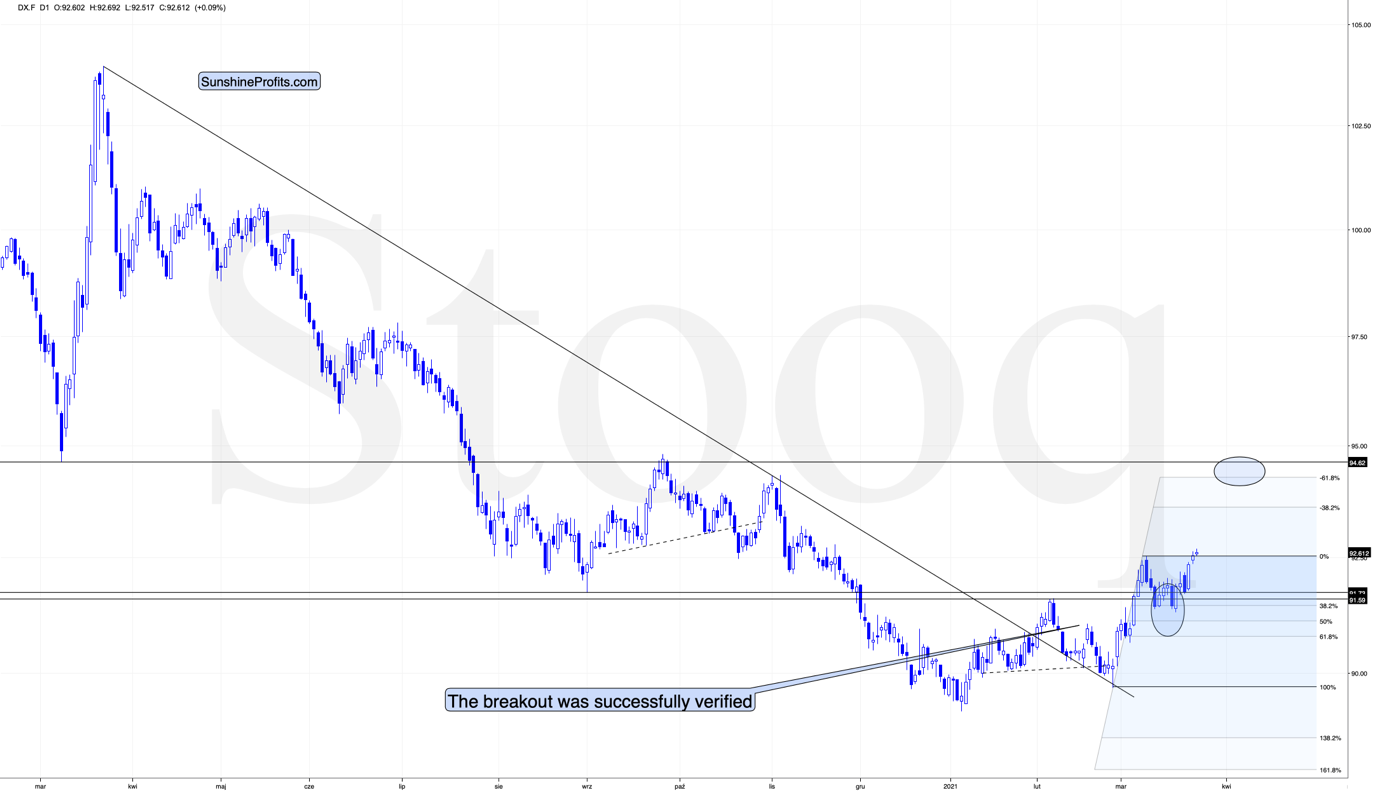
In yesterday’s analysis, I commented on the USDX chart in the following way:
Right now, traders are likely taking the wait-and-see approach with regard to the USD Index. The latter just moved to its previous yearly highs. It’s already after verification of the breakout above the February highs, so it seems that it’s ready to break higher any day – or hour – now. When that happens, I expect the rally to take the USDX to at least 94, perhaps to 94.5 or 95. The September 2020 high is 94.8, so this level is the most likely upside target for the short term. I don’t think that the rally in the USD Index would end once it reaches the proximity of 95, but that’s when we might see another breather (perhaps after a breakout above this level and perhaps before the breakout, it’s too early to tell at this time).
The situation is developing as I outlined above. The breakout in the USD Index is not yet confirmed, but it seems quite likely that it will be confirmed shortly. I would not be surprised to see a weekly close near the previous yearly highs (the February highs) and then a powerful rally next week. This – if it happens in the above-mentioned way – would be likely to result in a major slide in the PMs next week.
Having said that, let’s take a look at the market from a more fundamental angle.
Increasingly Unwelcome
On Jan. 15, I warned that Jerome Powell, Chairman of the U.S. Federal Reserve (FED), was wrong when he claimed that he didn’t see any “unwelcome” inflation.
I wrote:
While the FED Chair doesn’t see any “unwelcome” inflation, commodities aren’t exactly supporting his vision. For goods and services that we use/need on a daily basis, inflation is abundant. And because higher inflation is a precursor to higher interest rates, Powell’s own polices (and their impact on real and financial assets) actually eliminate his ability to determine when interest rates rise.
Thus, while rising inflation is a long-term positive for gold, the short-term effect of higher interest rates should pressure the yellow metal in the near future.
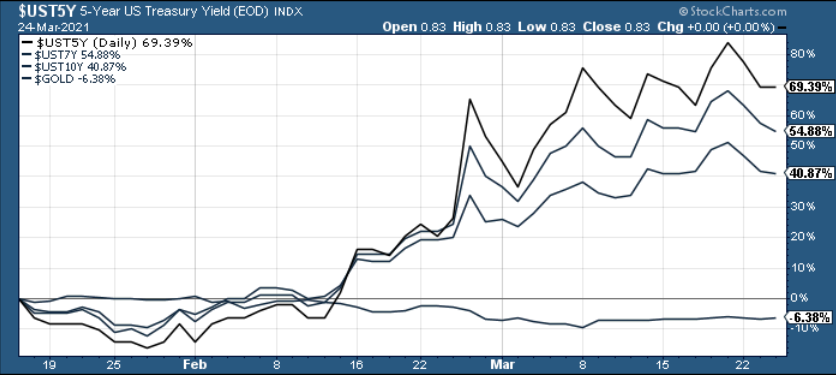
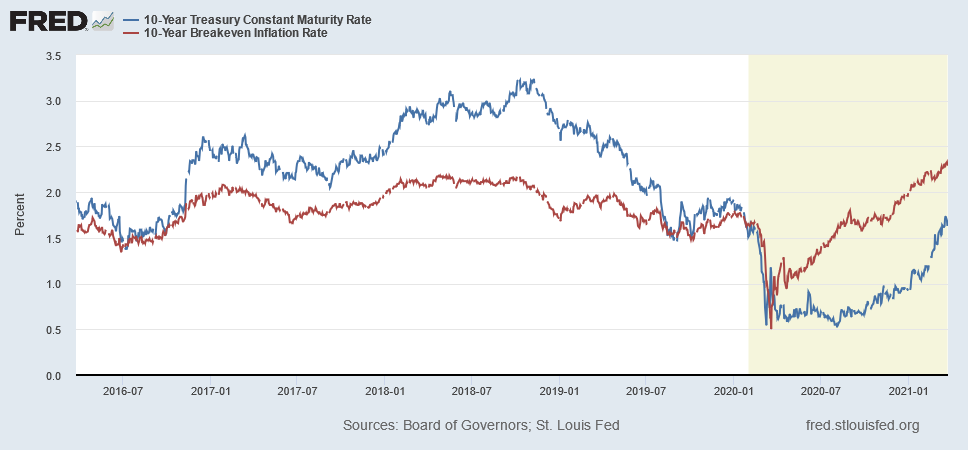
Since then, U.S. Treasury yields have been on a warpath, while gold has been a major casualty.
Please see below:
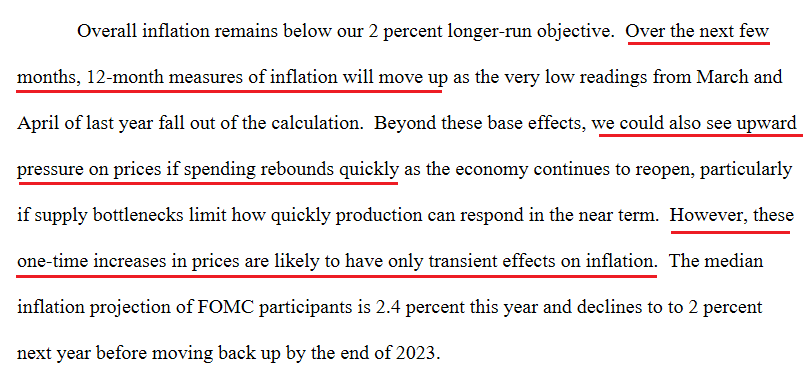
And with visible inflation now glaringly obvious, on Mar. 17, Powell struck a decisively different tone.
 Source: U.S. FED
However, in what’s becoming a case of ‘too little, too late,’ Powell remains materially behind the curve.
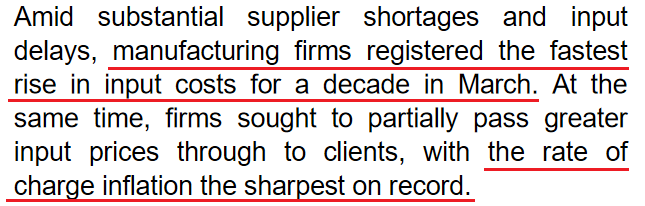
On Mar. 24, despite a mixed reading from IHS Markit’s Flash U.S. Composite PMI – with the U.S. Services Business Activity Index hitting an 80-month high and the U.S. Manufacturing Output Index hitting a five-month low – the report read: “the rate of input price inflation was the sharpest since data collection began in late-2009.”
Please see below:
 Source: IHS Markit
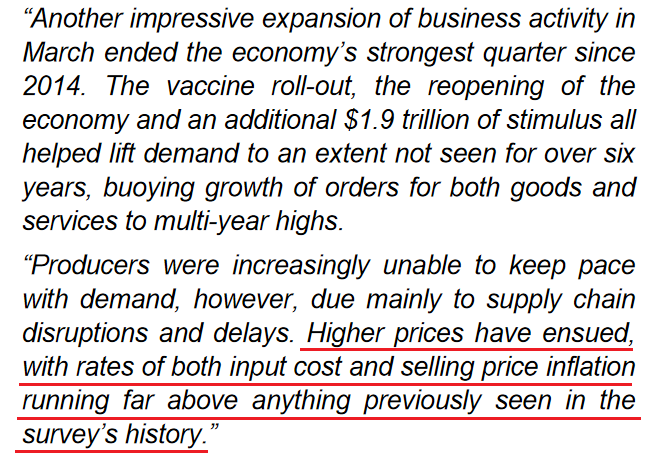
As further evidence, Chris Williamson, Chief Business Economist at IHS Markit, said:
 Source: IHS Markit
The bottom line?
Because gold topped exactly one day after the U.S. 10-Year Treasury yield bottomed, a continuation of the ‘rising inflation expectations, rising U.S. Treasury yields’ theme is profoundly bearish for the PMs. Case in point: notice how higher inflation is a precursor to higher interest rates?
In addition, despite the U.S. 10-Year Treasury yields’ recent pause – a function of equity-market jitters and the underlying bond being materially oversold – historical precedent implies that the surge is far from over. If you analyze the chart below, you can see that trough-to-peak rallies in the U.S. 10-Year-2-Year Treasury yield spread often max out north of 250 basis points (2.50%).

To explain, the U.S. 10-Year-2-Year Treasury yield spread is calculated by subtracting the U.S. 2-Year Treasury yield from the U.S. 10-Year Treasury yield. When the dark blue line above is rising, it means that the U.S. 10-Year Treasury yield is increasing at a faster pace than the U.S. 2-Year Treasury yield. Thus, if you focus your attention on the right side of the chart, you can see that we’re still far from a likely peak.
If the yields are approximately halfway done rallying (assuming that the yields would not rally more), then perhaps gold is halfway done declining. Gold topped at $2,089 and it just closed at $1,733. Doubling this decline would imply gold at $1,377. Please note that in 2 out of the past 3 cases, the rally in yields first lost its momentum, but kept on rising. If this happens again, perhaps gold would react to the decline in momentum without waiting for the exact top and it could then bottom above $1,377 – perhaps in the $1,450 - $1,500 area that I’ve been writing about.
It’s also important to understand the impact of the U.S. equity market. If stocks suffer a substantial swoon, a safe-haven bid for Treasuries will likely suppress the U.S. 10-Year Treasury yield (and the 10-2 spread). However, even if this occurs, the effect is still profoundly bearish for the PMs. A catch-22, an equity-market-induced suppression of U.S. Treasury yields likely coincides with a surge in the USD Index. And because the PMs have a strong negative correlation with the U.S. dollar, this pathway to lower yields is unlikely to be celebrated.
Speaking of the USD Index, the basket rallied by another 0.20% on Mar. 24. And underpinning the recent strength, the EUR/USD – which accounts for nearly 58% of the movement of the USD Index – ended the day at its lowest level since Nov. 12.
Please see below:
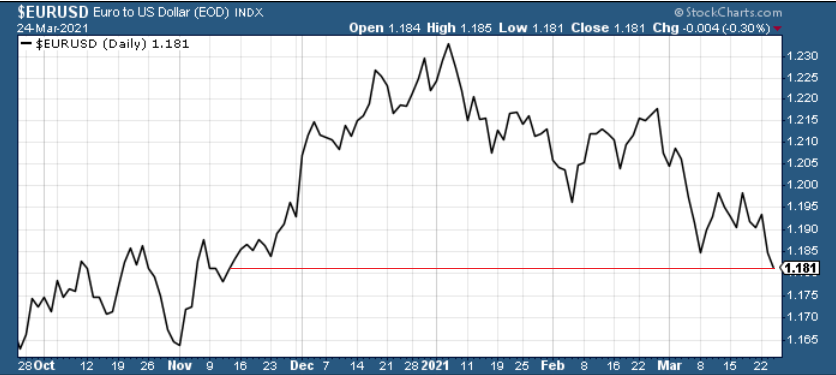
For some time, I’ve warned that the Eurozone’s fundamental underperformance of the U.S. justified a material rerating of the EUR/USD.
For context, I wrote on Dec. 30:
John Maynard Keynes once said, “Markets can remain irrational longer than you can remain solvent.” And right now, the EUR/USD is putting his theory to the test.
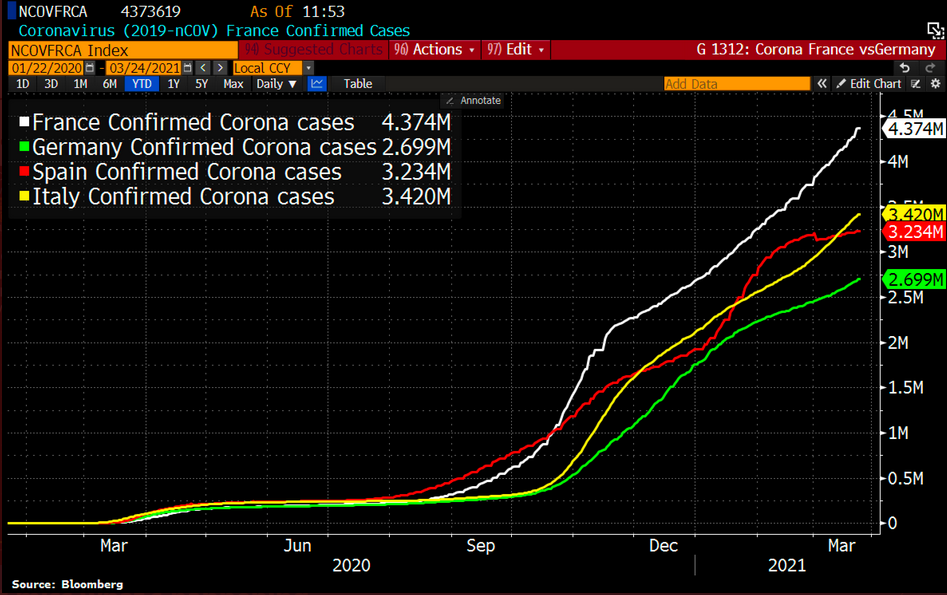
Across Europe’s largest economies – Germany, France, Italy and Spain – economic activity is rolling over. And underpinning the irrationality, the deceleration is happening as the euro is strengthening. Remember, currencies trade on a relative basis. Thus, a less-bad U.S. economy is good news for the U.S. dollar.
The bottom line is: euro bulls are fighting a war they’re unlikely to win. And as the fundamental data worsens, it’s analogous to a platoon losing more and more soldiers. Eventually, the infantry runs out of reserves and it’s time to wave the white flag.
And despite the inclination to take a victory lap, it’s important to remember that the EUR/USD still does not reflect fundamental value.
Case in point: Capital Economics – an independent analysis, research and consulting firm – cut its 2021 Eurozone GDP growth estimate on Mar. 24. The report read: "We now think euro-zone GDP will regain its pre-pandemic level in Q3 2022, whereas the UK should get there by Q1 next year and the US economy will get there in Q2 this year."
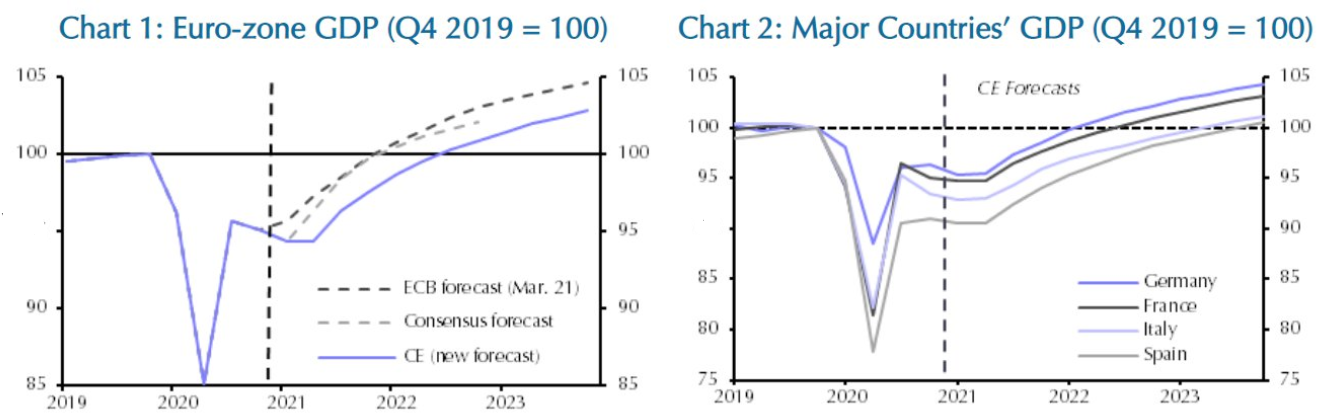 Source: Capital Economics
Also noteworthy, if you analyze the first chart on the left, you can see that the European Central Bank (ECB) and private economists’ consensus GDP growth estimates predict a Eurozone bounce in the first and second quarters of 2021. In stark contrast, Capital Economics expects – 0.8% Eurozone GDP growth in Q1 and 0% growth in Q2.
Underpinning the bearish about face, coronavirus cases continue to rise across Europe’s four-largest economies.
Please see below:
And after suspending the use of AstraZeneca's COVID-19 vaccine, the Eurozone’s vaccination lag (vaccinating its population relative to the U.S.) has widened even further.
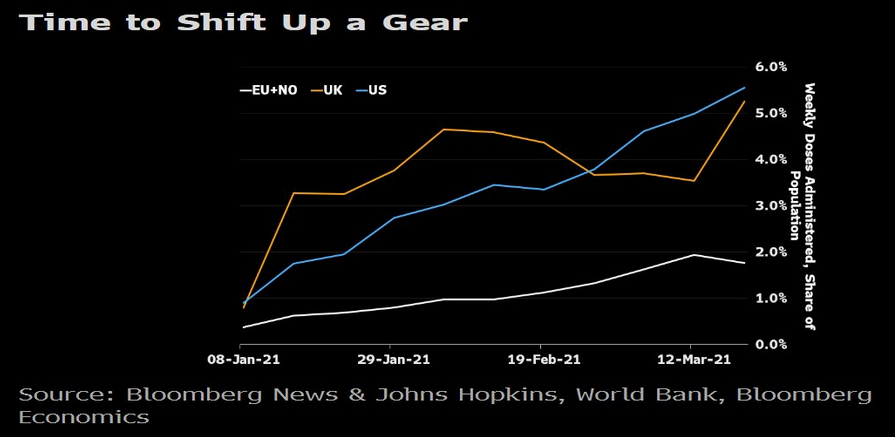
If you analyze the chart above, you can see that the U.S. (the blue line) is vaccinating its population at a much faster pace than the Eurozone (the white line). But even more supportive of a lower EUR/USD, notice how the white line has rolled over on the right side of the chart? In essence, not only are Eurozone vaccinations drastically lagging behind the U.S., but the divergence is also accelerating.
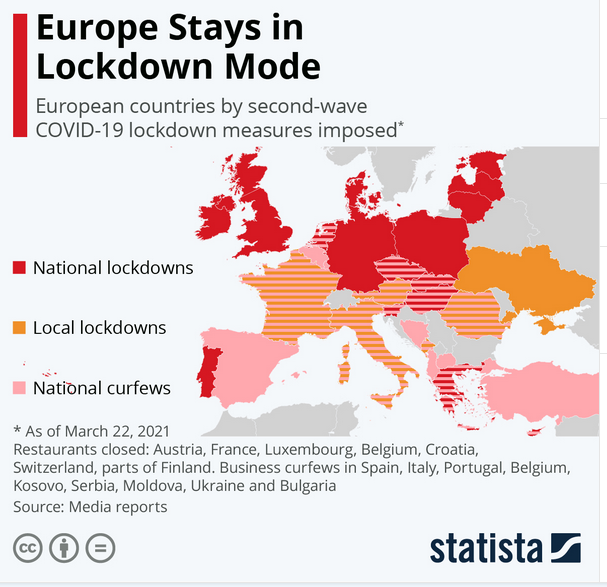
Because of this, the Eurozone GDP growth forecast remain extremely optimistic. Case in point: several sources have France leading the Eurozone’s recovery in 2021. However, “a nightly curfew is currently in force in metropolitan France between 6PM (7 PM from 20 March) and 6AM” where citizens are only allowed to leave their homes for essential activities (Source: Government of France).
Likewise, because the majority of European countries have imposed some form of restrictions and the vaccine rollout continues to move at a snail’s pace, Eurozone economic activity is unlikely to normalize any time soon.
In conclusion, inflation is rising, U.S. Treasury yields are consolidating, and the USD Index remains ripe for a resurgence. And while a surge in all three can occur simultaneously or on their own – depending on the behavior of the U.S. equity market – the most-likely scenarios are profoundly bearish for the PMs. As a result, gold’s hoping-for-higher price action is likely to end in disappointment. Furthermore, with the currency market, the bond market and the stock market exhibiting heightened volatility over the last week, the PMs are unlikely to avoid the damage inflicted during a medium-term shock.
Overview of the Upcoming Part of the Decline
- It seems very likely to me that we are already after the initial bottom and the initial correction. If not, then it seems likely to me that the corrective upswing will be completed within a week. It’s more likely that the next big move lower is already underway, though.
- After miners slide once again in a meaningful and volatile way, but silver doesn’t (and it just declines moderately), I plan to switch from short positions in miners to short positions in silver (this could take another 1-2 weeks to materialize). I plan to exit those short positions when gold shows substantial strength relative to the USD Index, while the latter is still rallying. This might take place with gold close to $1,450 - $1,500 and the entire decline (from above $1,700 to about $1,475) would be likely to take place within 1-12 weeks and I would expect silver to fall hardest in the final part of the move. This moment (when gold performs very strongly against the rallying USD and miners are strong relative to gold – after gold has already declined substantially) is likely to be the best entry point for long-term investments in my view. This might happen with gold close to $1,475, but it’s too early to say with certainty at this time. In other words, the entire decline could take between 1 and 12 weeks, while silver declines occuring particularly fast in the final 1-2 weeks.
- If gold declines even below $1,500 (say, to ~$1350 or so), then it could take another 10 weeks or so for it to bottom, but this is not what I view as a very likely outcome.
- As a confirmation for the above, I will use the (upcoming or perhaps we have already seen it?) top in the general stock market as the starting point for the three-month countdown. The reason is that after the 1929 top, gold miners declined for about three months after the general stock market started to slide. We also saw some confirmations of this theory based on the analogy to 2008. All in all, the precious metals sector would be likely to bottom about three months after the general stock market tops . If the mid-February 2020 top was the final medium-term top, then it seems that we might expect the precious metals sector to bottom in mid-May or close to May’s end.
- The above is based on the information available today and it might change in the following days/weeks.
Letters to the Editor
Q: How does one "profit from the upcoming decline" as you state in today's message? What exactly is the current stock play, in order to profit from the decline? That's a ton of information about gold, will there be more of such in-depth information regarding silver in the future?
A: One could for example take into account my trading ideas from the “Trading” section of the summary of each Gold & Silver Trading Alert. My preferred way of taking advantage of the current decline is through shorting the junior mining stocks (GDXJ). Those, who seek leverage (which might not be appropriate for most) might use a leveraged instrument, for instance, the JDST.
Most of the information that I’m presenting in the analyses applies to the entire precious metals sector (at least its most popular parts: gold, silver, and mining stocks), not only to gold. The trio is likely to move together in case of any major moves and also based on the general stock market movement. In fact, whatever you read in my analyses about the stock market is more about silver and mining stocks than it is about gold as the two former are more connected with stocks. Mining stocks, because they are – well – stocks. And silver due to its multiple industrial uses.
Also, when the time comes when I decide to switch from mining stocks to silver, I will most likely feature more silver charts in the technical part of the analyses.
Q: Last week you called for 39 plus for the JDST and 94 plus for the GDXU, gold levels at 1450-1500, and then a sharp rally for the metals. What are your projections for the GDXD and gold for the next 6-9 months?
A: I think that gold will decline in the next few months, likely to about $1,450 - $1,500 and then I expect it to rally. So, perhaps in 6-9 months gold will get back to the current levels. If that happens, then perhaps the mining stocks would get back to their current levels as well (after a big decline and a rebound). The GDXD (triple-leveraged inverse instrument for mining stocks) would likely rally significantly during the initial decline in the mining stocks, but then it would likely decline much more than it had rallied in the following months, when gold and the mining stocks rally back up. In other words, I definitely don’t recommend holding GDXD for the long run.
Q: Болшоиб спасибо. Thank you very much for your magnificent analysis and guidance. At last, I have joined the right newsletter. I am very happy and very lucky to be able to get your analysis.
My question: do you sell GLD at this stage and what is the target?
A: Thank you very much for your words of appreciation – I’m very happy to read that you enjoy the results of our work. As for your question, I prefer shorting mining stocks than gold, but if I wasn’t able to short mining stocks, I would likely be shorting gold with the plan to switch to shorting silver in the final part of the decline. Since the trading target for gold here is $1,512, and since GLD is trading in a relatively stable manner at 0.0937 of gold’s futures prices, I’d say that the trading target for the GLD would be $1,512 x 0.0937 = $141.67.
Summary
To summarize, the PMs’ medium-term decline is well underway, and based on the recent performance of the USD Index, gold and mining stocks, it seems that the corrective upswing is already over (or about to be over). The next big move lower seems to be already underway or about to start.
In addition, because we’re likely entering the “winter” part of the Kondratiev cycle (just like in 1929 and then the 1930s), the outlook for the precious metals’ sector remains particularly bearishduring the very first part of the cycle, when cash is king.
The confirmed breakout in the USD Index is yet another confirmation of the bearish outlook for the precious metals market.
After the sell-off (that takes gold to about $1,450 - $1,500), we expect the precious metals to rally significantly. The final part of the decline might take as little as 1-5 weeks, so it's important to stay alert to any changes.
Most importantly, please stay healthy and safe. We made a lot of money last March and it seems that we’re about to make much more on this March decline, but you have to be healthy to enjoy the results.
As always, we'll keep you - our subscribers - informed.
By the way, we’re currently providing you with a possibility to extend your subscription by a year, two years or even three years with a special 20% discount. This discount can be applied right away, without the need to wait for your next renewal – if you choose to secure your premium access and complete the payment upfront. The boring time in the PMs is definitely over and the time to pay close attention to the market is here. Naturally, it’s your capital, and the choice is up to you, but it seems that it might be a good idea to secure more premium access now, while saving 20% at the same time. Our support team will be happy to assist you in the above-described upgrade at preferential terms – if you’d like to proceed, please contact us.
To summarize:
Trading capital (supplementary part of the portfolio; our opinion): Full speculative short positions (300% of the full position) in mining stocks are justified from the risk to reward point of view with the following binding exit profit-take price levels:
Mining stocks (price levels for the GDXJ ETF): binding profit-take exit price: $24.12; stop-loss: none (the volatility is too big to justify a stop-loss order in case of this particular trade)
Alternatively, if one seeks leverage, we’re providing the binding profit-take levels for the JDST (2x leveraged) and GDXD (3x leveraged – which is not suggested for most traders/investors due to the significant leverage). The binding profit-take level for the JDST: $39.87; stop-loss for the JDST: none (the volatility is too big to justify a SL order in case of this particular trade); binding profit-take level for the GDXD: $94.87; stop-loss for the GDXD: none (the volatility is too big to justify a SL order in case of this particular trade).
For-your-information targets (our opinion; we continue to think that mining stocks are the preferred way of taking advantage of the upcoming price move, but if for whatever reason one wants / has to use silver or gold for this trade, we are providing the details anyway.):
Silver futures upside profit-take exit price: unclear at this time - initially, it might be a good idea to exit, when gold moves to $1,512.
Gold futures upside profit-take exit price: $1,512.
Long-term capital (core part of the portfolio; our opinion): No positions (in other words: cash
Insurance capital (core part of the portfolio; our opinion): Full position
Whether you already subscribed or not, we encourage you to find out how to make the most of our alerts and read our replies to the most common alert-and-gold-trading-related-questions.
Please note that we describe the situation for the day that the alert is posted in the trading section. In other words, if we are writing about a speculative position, it means that it is up-to-date on the day it was posted. We are also featuring the initial target prices to decide whether keeping a position on a given day is in tune with your approach (some moves are too small for medium-term traders, and some might appear too big for day-traders).
Additionally, you might want to read why our stop-loss orders are usually relatively far from the current price.
Please note that a full position doesn't mean using all of the capital for a given trade. You will find details on our thoughts on gold portfolio structuring in the Key Insights section on our website.
As a reminder - "initial target price" means exactly that - an "initial" one. It's not a price level at which we suggest closing positions. If this becomes the case (like it did in the previous trade), we will refer to these levels as levels of exit orders (exactly as we've done previously). Stop-loss levels, however, are naturally not "initial", but something that, in our opinion, might be entered as an order.
Since it is impossible to synchronize target prices and stop-loss levels for all the ETFs and ETNs with the main markets that we provide these levels for (gold, silver and mining stocks - the GDX ETF), the stop-loss levels and target prices for other ETNs and ETF (among other: UGL, GLL, AGQ, ZSL, NUGT, DUST, JNUG, JDST) are provided as supplementary, and not as "final". This means that if a stop-loss or a target level is reached for any of the "additional instruments" (GLL for instance), but not for the "main instrument" (gold in this case), we will view positions in both gold and GLL as still open and the stop-loss for GLL would have to be moved lower. On the other hand, if gold moves to a stop-loss level but GLL doesn't, then we will view both positions (in gold and GLL) as closed. In other words, since it's not possible to be 100% certain that each related instrument moves to a given level when the underlying instrument does, we can't provide levels that would be binding. The levels that we do provide are our best estimate of the levels that will correspond to the levels in the underlying assets, but it will be the underlying assets that one will need to focus on regarding the signs pointing to closing a given position or keeping it open. We might adjust the levels in the "additional instruments" without adjusting the levels in the "main instruments", which will simply mean that we have improved our estimation of these levels, not that we changed our outlook on the markets. We are already working on a tool that would update these levels daily for the most popular ETFs, ETNs and individual mining stocks.
Our preferred ways to invest in and to trade gold along with the reasoning can be found in the how to buy gold section. Furthermore, our preferred ETFs and ETNs can be found in our Gold & Silver ETF Ranking.
As a reminder, Gold & Silver Trading Alerts are posted before or on each trading day (we usually post them before the opening bell, but we don't promise doing that each day). If there's anything urgent, we will send you an additional small alert before posting the main one.
Thank you.
Przemyslaw Radomski, CFAFounder, Editor-in-chief

