

Briefly: in our opinion, full (100% of the regular position size) speculative long positions in junior mining stocks are justified from the risk/reward point of view at the moment of publishing this Alert.
Junior miners are rallying “slowly but surely”, which means that once again practically everything that I wrote on Monday and yesterday either happened in tune with that or it remains up-to-date; and thus, today’s technical part will be rather brief.
Let’s start with what I ended yesterday’s analysis with – the USD Index.
I previously wrote the following:
The higher of the recent highs is at 103.96 right now, so if the analogy to 2014 is to remain intact, the USD Index could now top at close to 104.5 or even 105.
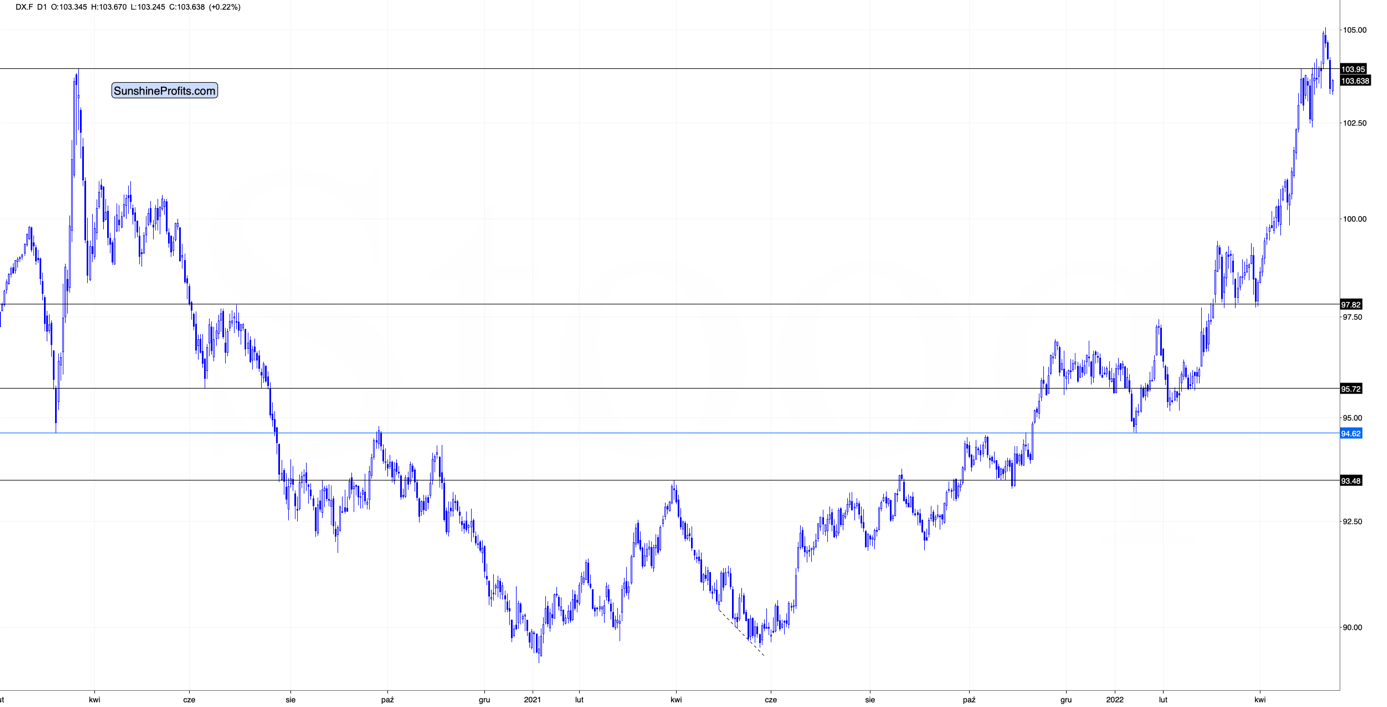
That’s exactly what happened recently. On Thursday, the USD Index moved to 104.96, and in Friday’s trading it rallied above 105 (to 105.065) and it invalidated the breakout above this level - which is in perfect tune with what I wrote above. Consequently, it seems that we could now see a move to about 103-103.5, after which USD’s rally could continue.
The opposite is likely to take place in the precious metals sector. Gold, silver, and mining stocks are likely to rally in the near term, and then – after topping at higher levels – their decline would continue.
The USD Index futures moved to about 103.7 in today’s [May 17] pre-market trading (so far), so you might be wondering if the bottom is in or about to be, and therefore, will gold stop rallying.
Please note that it’s possible that the USD Index bottoms shortly in the 103-103.5 range but then continues to trade sideways for a few days, while gold continues to rally. In fact, that’s what happened in late 2014. Consequently, what we’ve seen so far today doesn’t imply that gold’s, silver’s, or miners’ rallies are over.
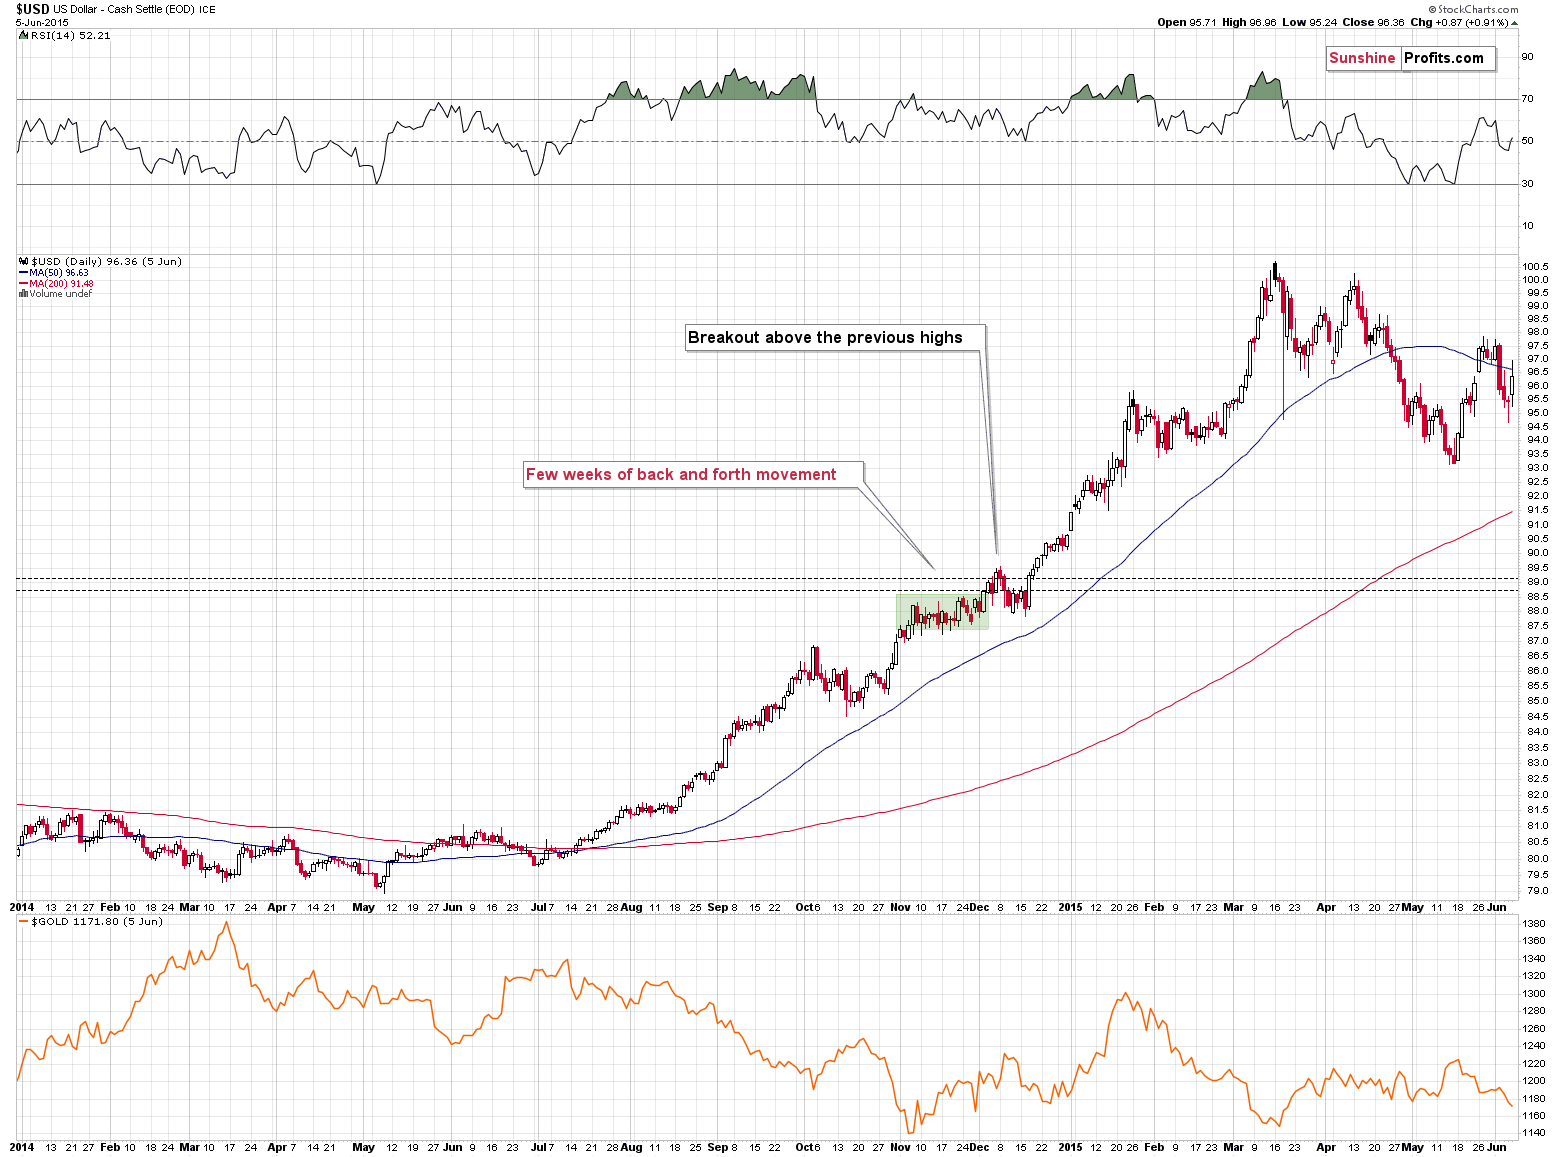
After moving to 103.245, the USD Index futures moved back up, which is in perfect tune with what happened in late 2014, when the USD Index was correcting a breakout above the previous two important highs. Therefore, it’s quite likely that after a few-day-long pause, the USD Index will rally once again. This means that the precious metals market still has room to rally in the next several days.
In yesterday’s trading, gold futures were up by less than $5 (0.27%), so it’s nothing special, but it’s a “notable nothing” as gold didn’t return to its previous decline mode.
In other words, my previous comments on gold remain up-to-date:
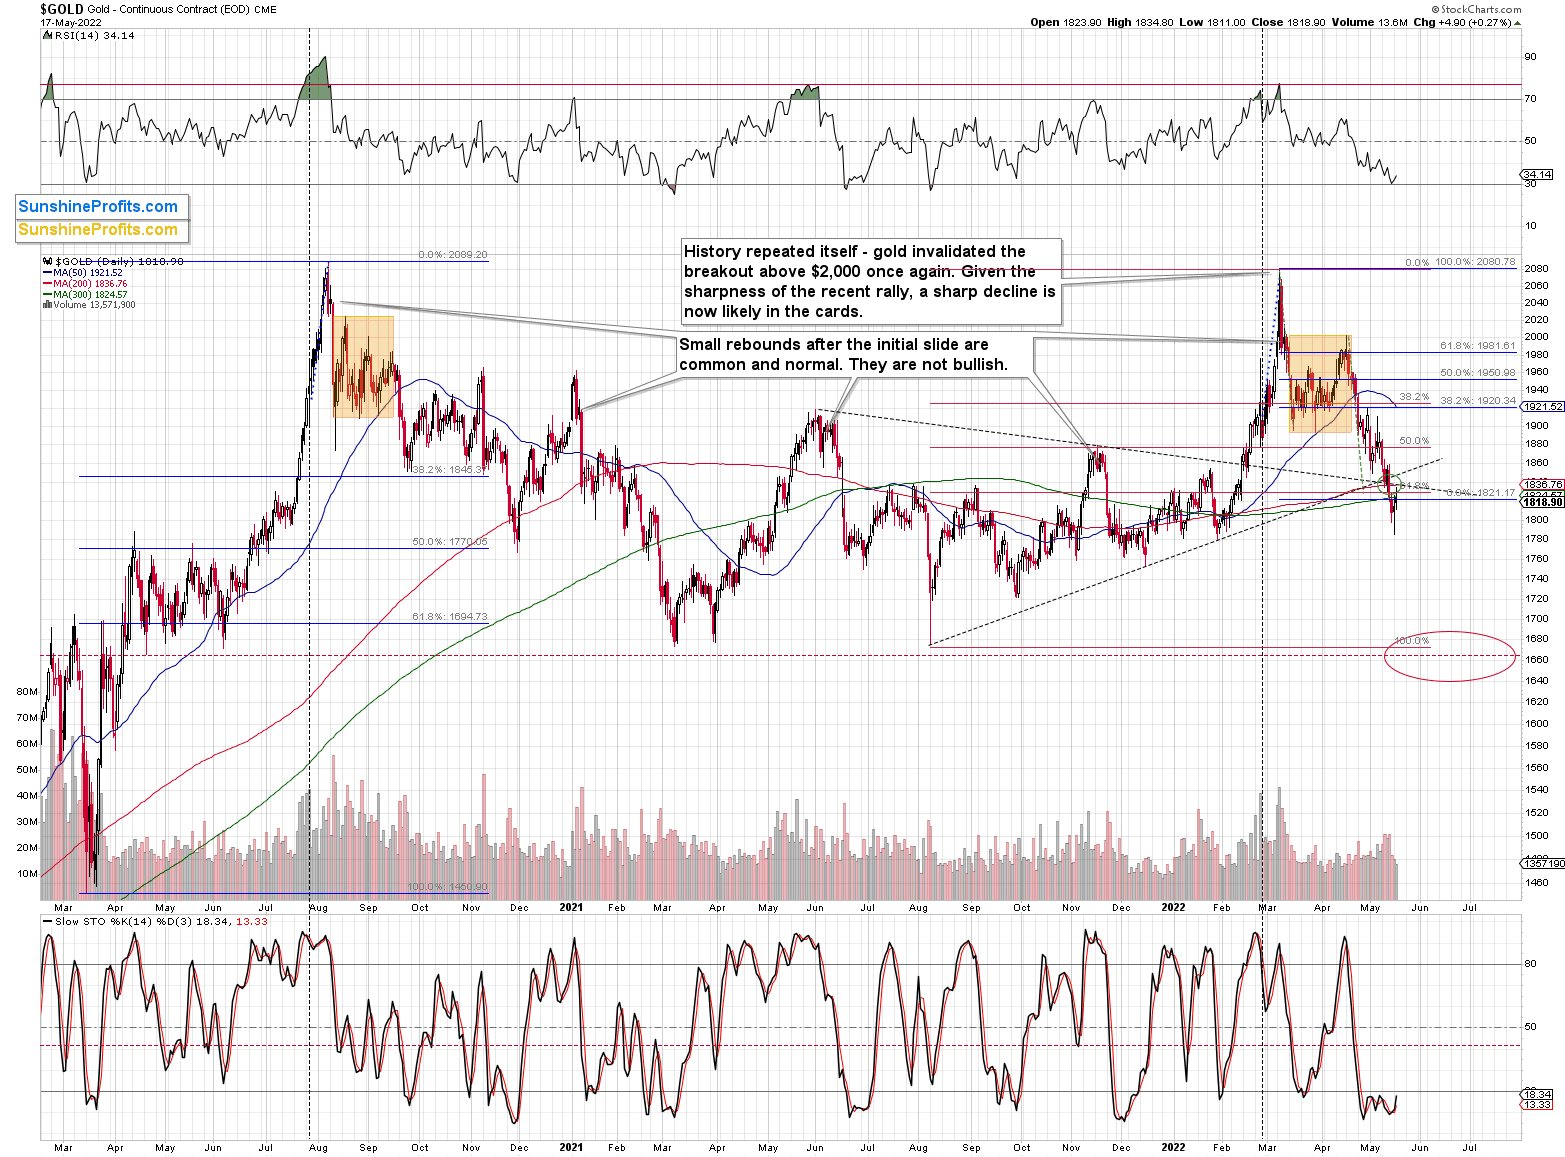
In short, gold reversed yesterday’s decline after almost touching its previous 2022 lows, and at the same time, it practically erased the entire war-tension-based rally – just like it was supposed to.
Gold ended the day only $5.80 higher, but the important thing is that it reversed at all. Gold’s RSI also bounced off the 30 level, which can be viewed as a buy signal on its own.
While gold was up by 0.27% yesterday, GDX was up by 0.19%, and GDXJ was up by 0.85%. It seems that we’re using the right proxy for making money on the rebound as it’s moving up most visibly. No wonder – it’s been the most oversold.
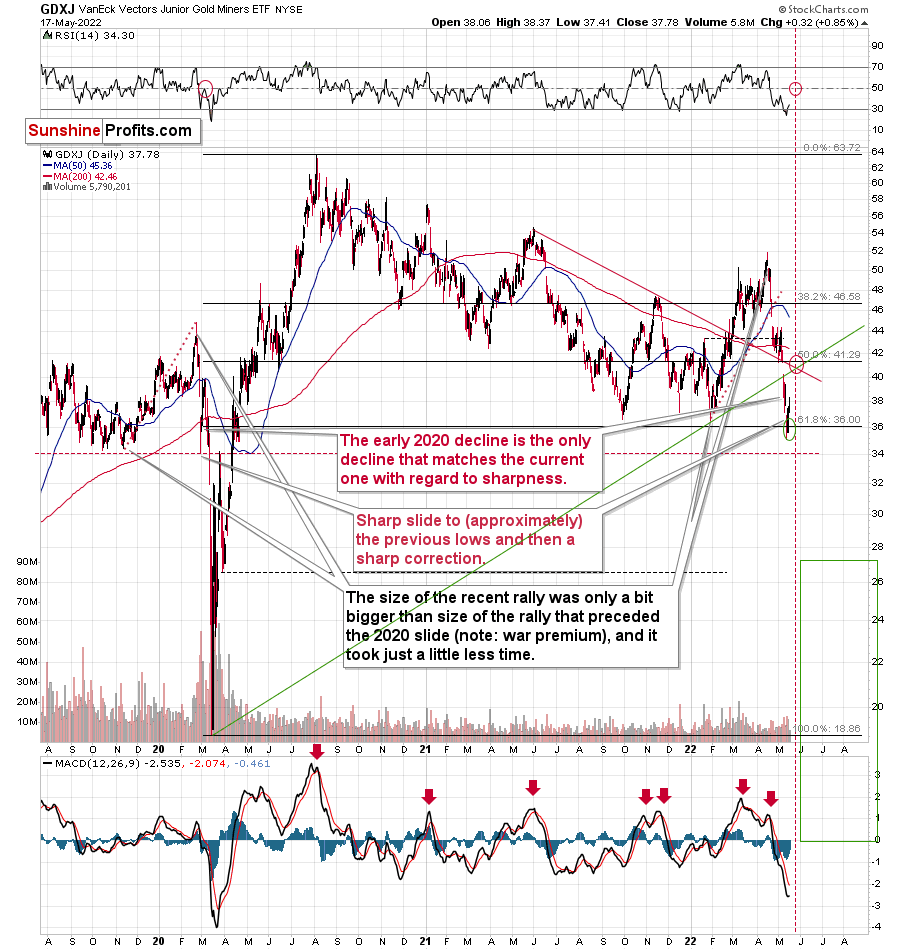
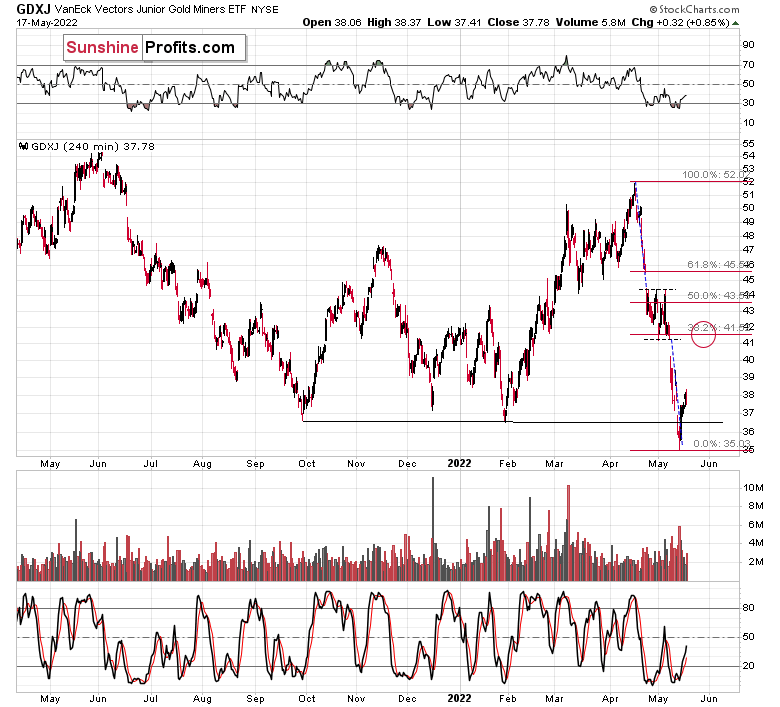
Of course, there will be some back-and-forth movement on an intraday basis, but it doesn’t change anything. Junior miners are likely to rally this week, nonetheless. And perhaps not longer than that, as the next triangle-vertex-based reversal is just around the corner – on Friday/Monday.
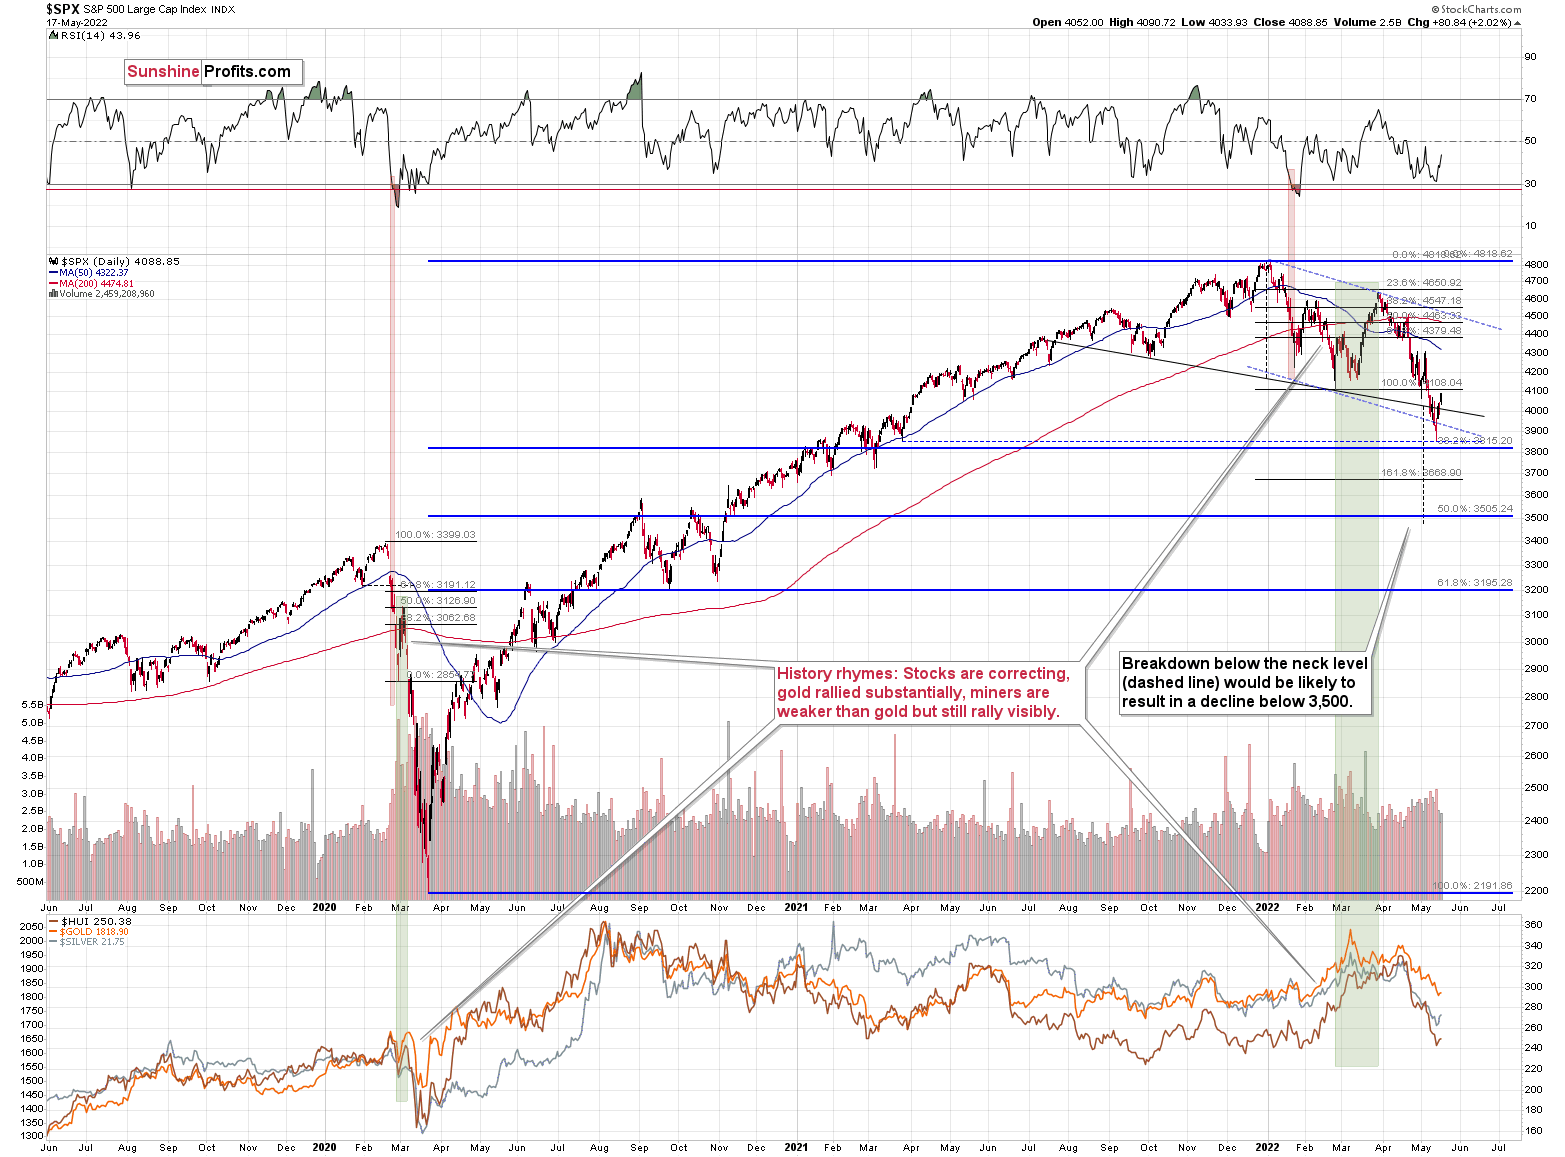
Meanwhile, the S&P 500 Index has clearly invalidated its head-and-shoulders pattern in terms of the daily closing prices, which is a buy signal on its own.
This means that the odds of a short-term rally in the following days have greatly increased. This makes the current long position in junior mining stocks even more justified and it is likely that profits on it will increase shortly.
Having said that, let’s take a look at the markets from a fundamental point of view.
Ignore at Your Own Peril
With another rise in risk appetite helping to boost profits in our long position in the GDXJ ETF, the technicals that I described were nearly perfect in predicting the short-term bottom. However, with the medium-term outlook less rosy, both the fundamentals and technicals signal more downside once the PMs’ bear markets resume.
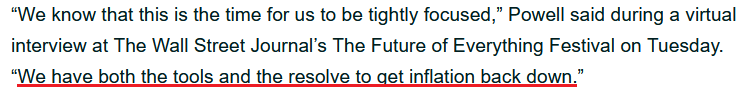
For example, Fed Chairman Jerome Powell was back fanning the hawkish flames on May 17, and he said that the central bank will raise interest rates until there is “clear and convincing evidence” that inflation is coming down. “We will go to that point and there won’t be any hesitation about that,” he said.
Moreover, in repeating his ominous warning from May 12, he added: “There could be some pain involved in restoring price stability, but we think we can sustain a strong labor market.”
As a result, while the bull is back on Wall Street, Powell’s war against inflation should shift sentiment over the medium term. Likewise, with investors’ eagerness to bid up asset prices directly testing Powell’s “resolve,” an epic battle should unfold over the next few months.
Please see below:
 Source: Barron’s
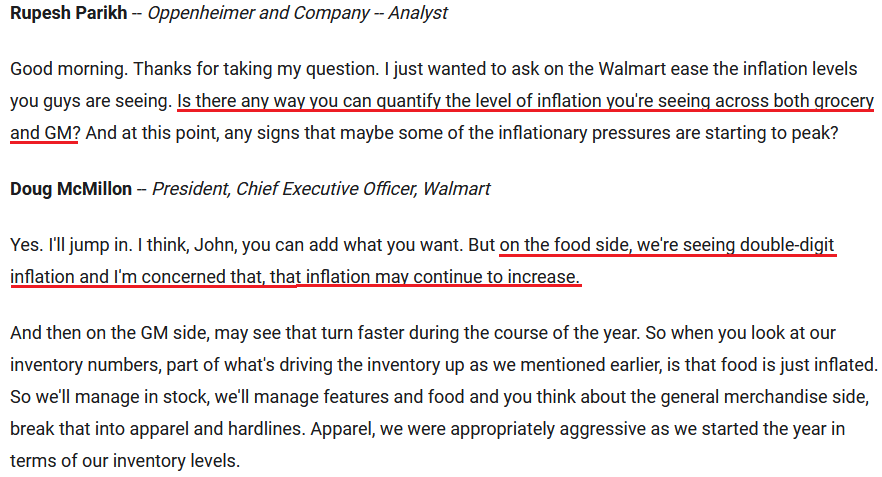
To that point, inflationary pressures remain abundant, and “some pain” should turn into plenty of pain as the hawkish drama unfolds. For example, Walmart released its first-quarter earnings on May 17; and since the company is a value-oriented retailer (lacks pricing power), weakness on the bottom line led to the stock plunging by more than 11%.
CEO Doug McMillon said:
“While we've experienced high levels of inflation in our international markets over the years, U.S. inflation being this high and moving so quickly, both in food and general merchandise is unusual. We'll control what we can control, reduce our inventory level and keep prices as low as we can, especially on opening price point food items while improving our profit performance. Inflation is playing a role in the top and bottom line and the pace of change created a timing issue for us in Q1.”
Moreover, CFO Brett Biggs said: “The first quarter was one of the most challenging periods yet related to supply chain disruptions, increased costs and persistently high inflation.”
In addition, while general merchandise (GM) inflation could subside sooner, McMillon was less optimistic about food inflation.
Please see below:
 Source: Walmart/The Motley Fool
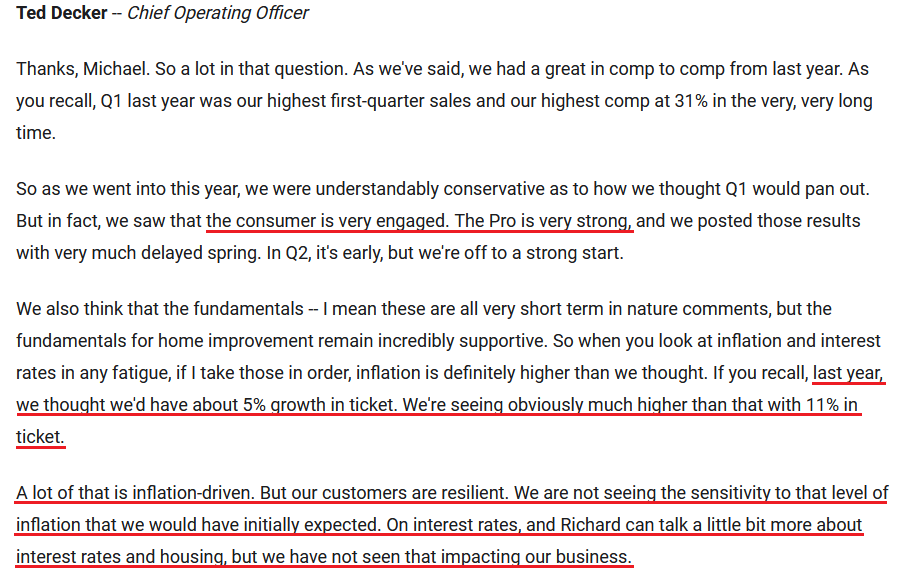
Singing a similar tune, Home Depot released its first-quarter earnings on May 17. CEO Ted Decker said during the Q1 earnings call:
“As I mentioned earlier, inflation is higher than we had expected to the extent about two times. The 11-odd percent ticket, the vast majority of that was inflation-driven…. So we think inflation doesn't go up necessarily from where we are but that it would hold steady at this, call it, double-digit, low 10-ish percent in our product categories through the balance of the year.”
Thus, with both Walmart and Home Depot seeing “double-digit” inflation in their respective businesses, Powell has plenty of work to do to calm the pricing pressures.
Furthermore, I’ve warned on numerous occasions that supply-slide assumptions led investors to miscalculate inflation. As such, they assumed that the demand side was only a small part of the equation. However, with unprecedented stimulus fueling unprecedented demand, U.S. consumers’ propensity to spend keeps inflation uplifted. Therefore, the Fed needs to kill demand with higher interest rates, and the necessity is profoundly bearish for the S&P 500 and the PMs.
Supporting the thesis, Home Depot CFO Richard McPhail said during the Q1 earnings call:
“Over our history, we've seen that home price appreciation is the primary driver of home improvement demand. When your home appreciates in value, you view it as a smart investment and you spend more on it. So let's look at what's happened at home prices. We've seen appreciation of over 30% over the last two years. In fact, home equity values over the last two years have increased by 40% or over $7 billion just in the last two years.”
“So the homeowner has never had a balance sheet that looks like this. They've seen the price appreciation, and they have the means to spend. And in surveys, our customers tell us that their homes have never been more important, and their intent to do projects of all sizes has never been higher. And our Pros say the same thing about their backlogs.”
As a result, since the Fed missed the demand side of the inflation equation, they have to be overly hawkish to restore the imbalance. Moreover, with Home Depot noting that consumers are showing no signs of slowing down, investors don’t realize that the Fed’s war against inflation will be one of attrition.
Please see below:
 Source: Home Depot/The Motley Fool
Continuing the theme, the U.S. Census Bureau released its retail sales report on May 17. Unsurprisingly, U.S. retail sales increased by 0.9% month-over-month (MoM) in April and hit a new all-time high. Moreover, the March figure was revised upward from an increase of 0.7% MoM to an increase of 1.4% MoM. Therefore, U.S. consumers continue to spend, and their splurges only increase the pressure on the Fed.
Please see below:
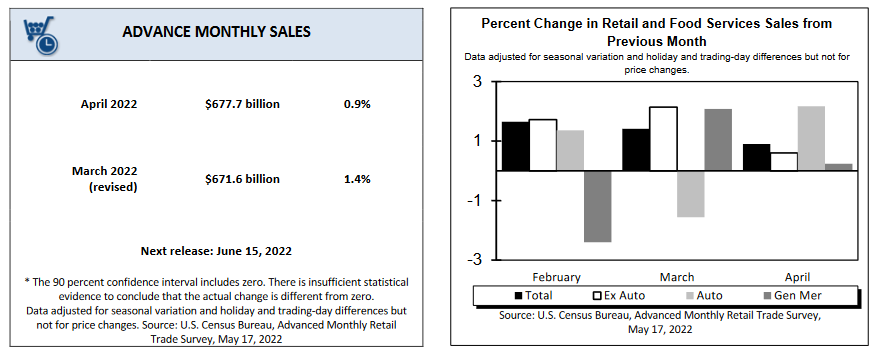
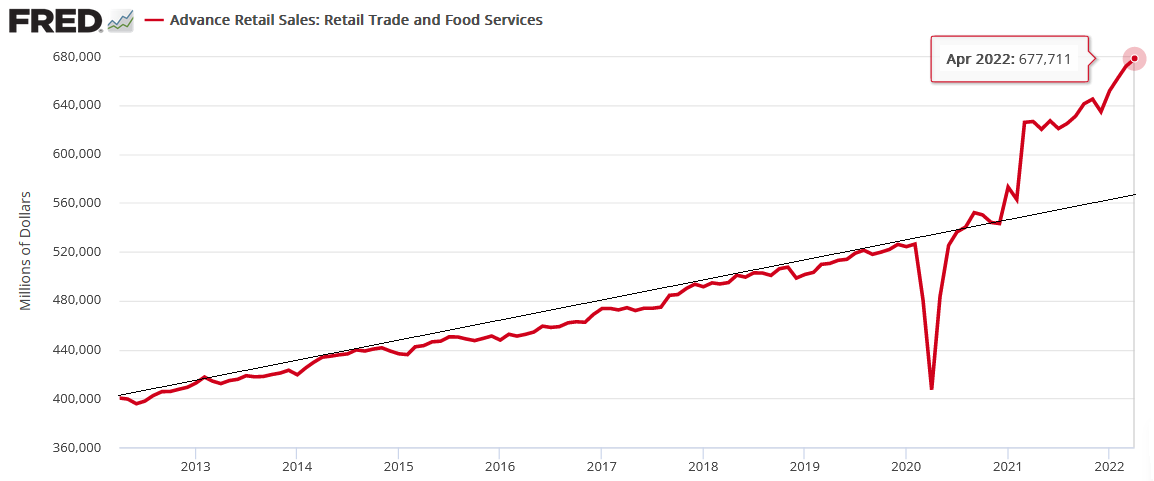
To that point, investors’ lack of foresight can be highlighted in one chart. With U.S. retail sales running well above their pre-pandemic trend (approximated by the black line below), the slope of the coronavirus-induced spending showcases the strength of U.S. consumers.
However, it also showcases the amount of demand destruction that needs to unfold to normalize their spending habits, and therefore, normalize inflation. Thus, while investors still don’t believe that the Fed will follow through with its hawkish promises, hard lessons should be learned over the medium term.
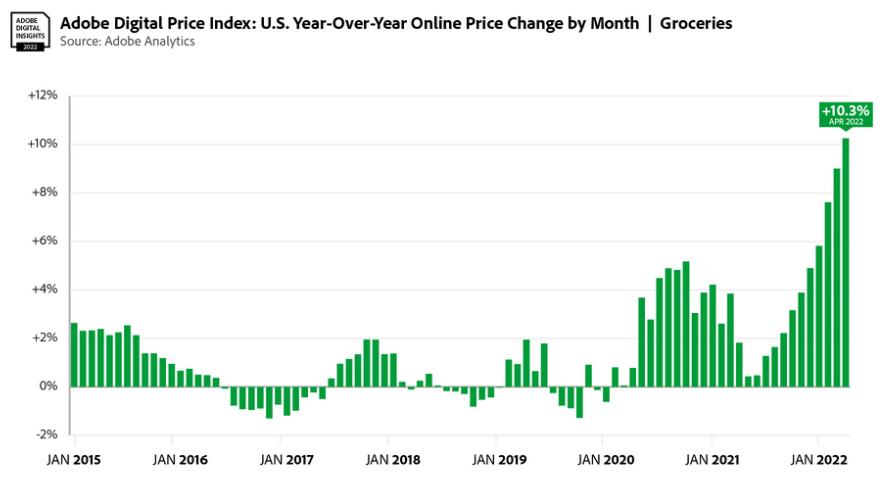
Also relevant, Adobe Analytics released its Digital Price Index (DPI) on May 11. For context, “the DPI is modeled after the Consumer Price Index (CPI), published by the U.S. Bureau of Labor Statistics and uses the Fisher Price Index to track online prices.”
Moreover, with online prices declining by 0.5% MoM, the report stated that “April shows early signs of online price increases beginning to slow. Over half of the categories tracked by the DPI (10 out of 18) saw MoM price decreases in April.”
Conversely, it’s important to remember that digital disinflation has been occurring YoY since 2015. In fact, the DPI has declined YoY in each month since 2015. However, notice the change in trend since the pandemic struck?
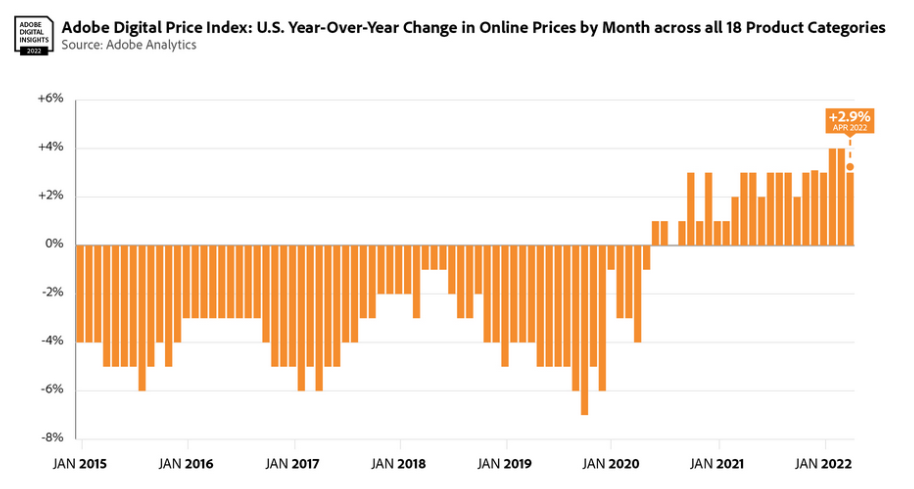
Even more revealing, the YoY percentage change in online grocery prices are much worse. The report stated: “Prices have not eased for groceries, rising 10.3% YoY (up 1.3% MoM) as well as pet products, which rose 8.0% YoY (up 0.9% MoM), record YoY highs for both categories.” As a result, Walmart isn’t the only one noticing “double-digit” food inflation.
Please see below:
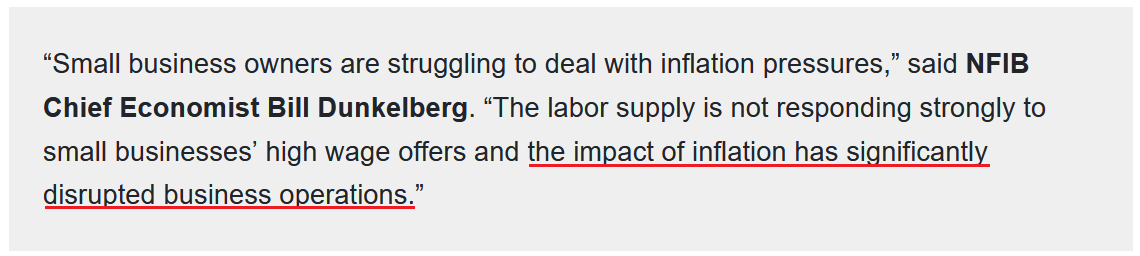
Finally, the NFIB released its Small Business Optimism Index on May 10. The report revealed:
“Small business owners expecting better business conditions over the next six months decreased one point to a net negative 50%, the lowest level recorded in the 48-year-old survey.”
Why is that?
“Inflation continues to be a problem for small businesses with 32% of small business owners reporting it’s their single most important problem in operating their business, the highest reading since the fourth quarter of 1980.”
Please see below:
 Source: NFIB
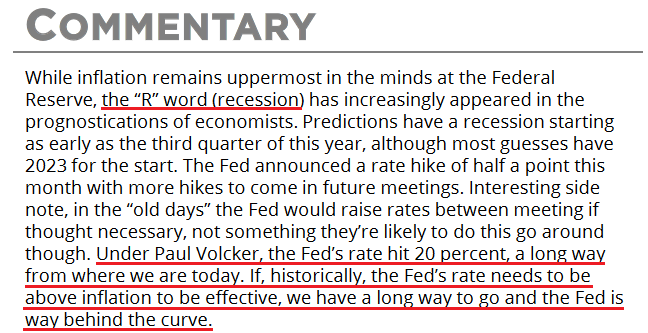
Furthermore, while I don’t expect a Volcker-like federal funds rate to materialize, I’ve been warning for months that the Fed is materially behind the inflation curve. Therefore, while investors assume that it will be smooth sailing from 8%+ to 2%, the reality is that harsh times lie ahead for those that don’t understand history.
 Source: NFIB
The bottom line? With U.S. consumers continuing to stoke inflation, the Fed finally realizes that demand is as much to blame as supply. Moreover, while Powell keeps warning investors of what’s to come, a decade of dovish pivots has left a generation of investors believing that the central bank is all talk and no action. However, with inflation at levels unseen in 40+ years, Powell is not out of ammunition, and the Fed’s followers should suffer profound disappointment as the drama unfolds.
In conclusion, the PMs rallied on May 17, and the GDXJ ETF continues to deliver. Likewise, with the technicals signaling more upside ahead, the bullish short-term environment remains profitable. However, with the PMs still in medium-term downtrends, their outlooks are treacherous over a longer time horizon. As a result, the recent optimism may be short-lived.
Overview of the Upcoming Part of the Decline
- It seems to me that the short-term decline in the precious metals market is over and we’re currently seeing a rebound.
- After the above-mentioned correction, we’re likely to see another big slide, perhaps close to the 2021 lows ($1,650 - $1,700).
- If we see a situation where miners slide in a meaningful and volatile way while silver doesn’t (it just declines moderately), I plan to – once again – switch from short positions in miners to short positions in silver. At this time, it’s too early to say at what price levels this could take place, and if we get this kind of opportunity at all – perhaps with gold close to $1,600.
- I plan to exit all remaining short positions once gold shows substantial strength relative to the USD Index while the latter is still rallying. This may be the case with gold close to $1,400. I expect silver to fall the hardest in the final part of the move. This moment (when gold performs very strongly against the rallying USD and miners are strong relative to gold after its substantial decline) is likely to be the best entry point for long-term investments, in my view. This can also happen with gold close to $1,400, but at the moment it’s too early to say with certainty.
- The above is based on the information available today, and it might change in the following days/weeks.
You will find my general overview of the outlook for gold on the chart below:
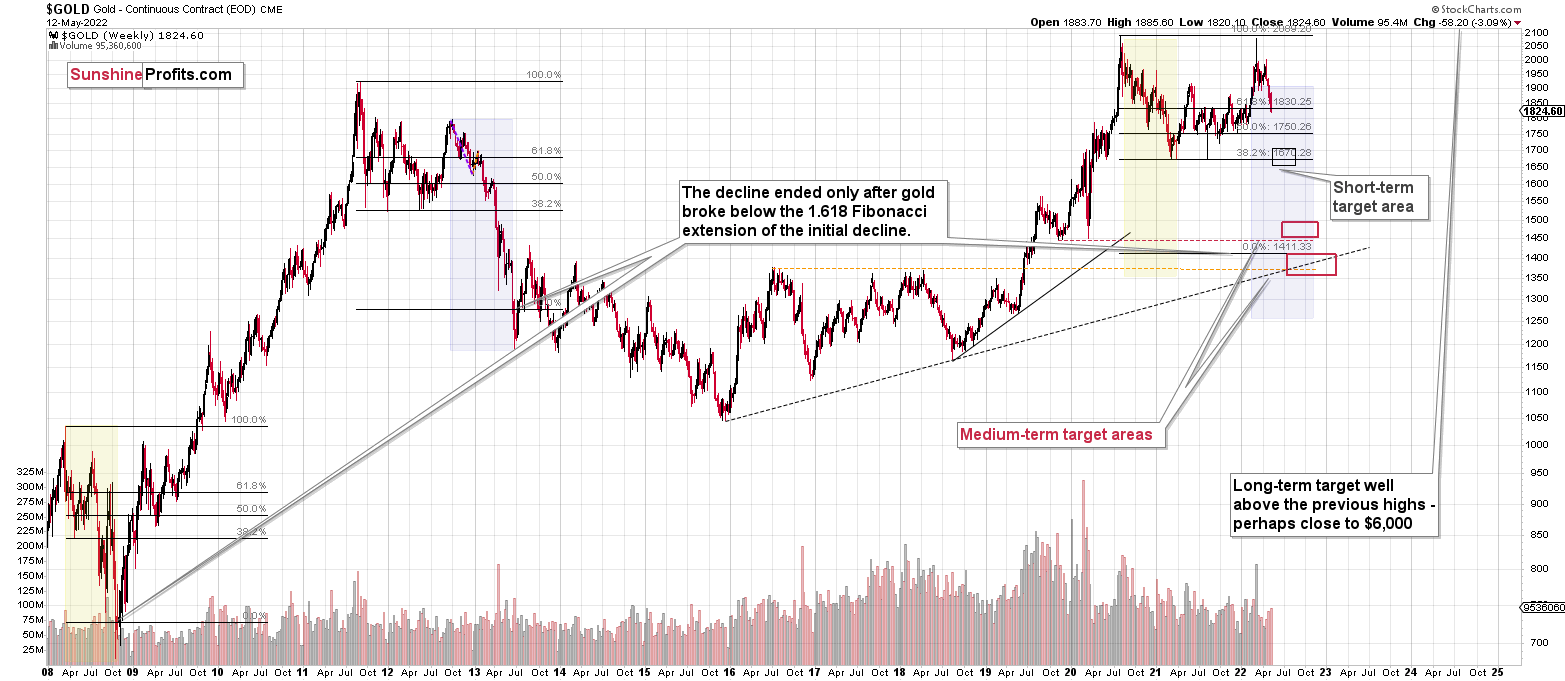
Please note that the above timing details are relatively broad and “for general overview only” – so that you know more or less what I think and how volatile I think the moves are likely to be – on an approximate basis. These time targets are not binding or clear enough for me to think that they should be used for purchasing options, warrants or similar instruments.
Summary
Summing up, it seems that we are about to see a short-term corrective upswing in the precious metals sector (perhaps until the end of this week), even though the medium-term trend remains clearly down.
The medium-term downtrend is likely to continue shortly (perhaps after a weekly or a few-day long correction). As investors are starting to wake up to the reality, the precious metals sector (particularly junior mining stocks) is declining sharply. Here are the key aspects of the reality that market participants have ignored:
- rising real interest rates,
- rising USD Index values.
Both of the aforementioned are the two most important fundamental drivers of the gold price. Since neither the USD Index nor real interest rates are likely to stop rising anytime soon (especially now that inflation has become highly political), the gold price is likely to fall sooner or later. Given the analogy to 2012 in gold, silver, and mining stocks, “sooner” is the more likely outcome.
It seems that our profits from short positions are going to become truly epic in the coming months. And the profits from the current long position are likely to enhance them even further.
After the final sell-off (that takes gold to about $1,350-$1,500), I expect the precious metals to rally significantly. The final part of the decline might take as little as 1-5 weeks, so it's important to stay alert to any changes.
As always, we'll keep you – our subscribers – informed.
To summarize:
Trading capital (supplementary part of the portfolio; our opinion): Full speculative long positions (100% of the full position) in junior mining stocks are justified from the risk to reward point of view with the following binding exit profit-take price levels:
Mining stocks (price levels for the GDXJ ETF): binding profit-take exit price: $40.96; stop-loss: none (the volatility is too big to justify a stop-loss order in case of this particular trade)
Alternatively, if one seeks leverage, we’re providing the binding profit-take levels for the JNUG (2x leveraged). The binding profit-take level for the JNUG: $56.68; stop-loss for the JNUG: none (the volatility is too big to justify a SL order in case of this particular trade).
For-your-information targets (our opinion; we continue to think that mining stocks are the preferred way of taking advantage of the upcoming price move, but if for whatever reason one wants / has to use silver or gold for this trade, we are providing the details anyway.):
Silver futures downside profit-take exit price: $22.88
SLV profit-take exit price: $21.28
AGQ profit-take exit price: $32.18
Gold futures downside profit-take exit price: $1,909
HGU.TO – alternative (Canadian) 2x leveraged gold stocks ETF – the upside profit-take exit price: $19.68
HZU.TO – alternative (Canadian) 2x leveraged silver ETF – the upside profit-take exit price: $12.09
Long-term capital (core part of the portfolio; our opinion): No positions (in other words: cash
Insurance capital (core part of the portfolio; our opinion): Full position
Whether you already subscribed or not, we encourage you to find out how to make the most of our alerts and read our replies to the most common alert-and-gold-trading-related-questions.
Please note that we describe the situation for the day that the alert is posted in the trading section. In other words, if we are writing about a speculative position, it means that it is up-to-date on the day it was posted. We are also featuring the initial target prices to decide whether keeping a position on a given day is in tune with your approach (some moves are too small for medium-term traders, and some might appear too big for day-traders).
Additionally, you might want to read why our stop-loss orders are usually relatively far from the current price.
Please note that a full position doesn't mean using all of the capital for a given trade. You will find details on our thoughts on gold portfolio structuring in the Key Insights section on our website.
As a reminder - "initial target price" means exactly that - an "initial" one. It's not a price level at which we suggest closing positions. If this becomes the case (like it did in the previous trade), we will refer to these levels as levels of exit orders (exactly as we've done previously). Stop-loss levels, however, are naturally not "initial", but something that, in our opinion, might be entered as an order.
Since it is impossible to synchronize target prices and stop-loss levels for all the ETFs and ETNs with the main markets that we provide these levels for (gold, silver and mining stocks - the GDX ETF), the stop-loss levels and target prices for other ETNs and ETF (among other: UGL, GLL, AGQ, ZSL, NUGT, DUST, JNUG, JDST) are provided as supplementary, and not as "final". This means that if a stop-loss or a target level is reached for any of the "additional instruments" (GLL for instance), but not for the "main instrument" (gold in this case), we will view positions in both gold and GLL as still open and the stop-loss for GLL would have to be moved lower. On the other hand, if gold moves to a stop-loss level but GLL doesn't, then we will view both positions (in gold and GLL) as closed. In other words, since it's not possible to be 100% certain that each related instrument moves to a given level when the underlying instrument does, we can't provide levels that would be binding. The levels that we do provide are our best estimate of the levels that will correspond to the levels in the underlying assets, but it will be the underlying assets that one will need to focus on regarding the signs pointing to closing a given position or keeping it open. We might adjust the levels in the "additional instruments" without adjusting the levels in the "main instruments", which will simply mean that we have improved our estimation of these levels, not that we changed our outlook on the markets. We are already working on a tool that would update these levels daily for the most popular ETFs, ETNs and individual mining stocks.
Our preferred ways to invest in and to trade gold along with the reasoning can be found in the how to buy gold section. Furthermore, our preferred ETFs and ETNs can be found in our Gold & Silver ETF Ranking.
As a reminder, Gold & Silver Trading Alerts are posted before or on each trading day (we usually post them before the opening bell, but we don't promise doing that each day). If there's anything urgent, we will send you an additional small alert before posting the main one.
Thank you.
Przemyslaw Radomski, CFA
Founder, Editor-in-chief

