

Briefly: in our opinion, full (100% of the regular position size) speculative long positions in junior mining stocks are justified from the risk/reward point of view at the moment of publishing this Alert.
On Thursday, I wrote that I was going to go long on junior mining stocks, and in the following hours, the GDXJ moved even a bit lower, providing you with a great opportunity to exit short positions and enter long ones in a comfortable manner. Hopefully, you did that, because the GDXJ rallied by almost 4% on Friday and ended the week above $37. The popular leveraged ETF, JNUG, was up by over 7% in a single day.
If you’re long on miners and you reaped those profits - congratulations! If not, let me re-emphasize what I wrote in Friday’s extensive flagship Alert: it seems to me that the short-term rally has only begun, and that quick profits are likely just around the corner.
Looking at gold’s pre-market decline, one might get second thoughts about the above, but please note that we are long on mining stocks, not gold, and there is a good reason why I chose mining stocks as a proxy and not gold or silver. The reason is that miners tend to show strength relative to gold before the bottom and then immediately thereafter.
Consequently, even if gold didn’t bottom last week and we’re seeing a bottom more or less right now, it doesn’t necessarily mean that miners will test their lows too.
Let’s check what’s gold been doing so far this week.
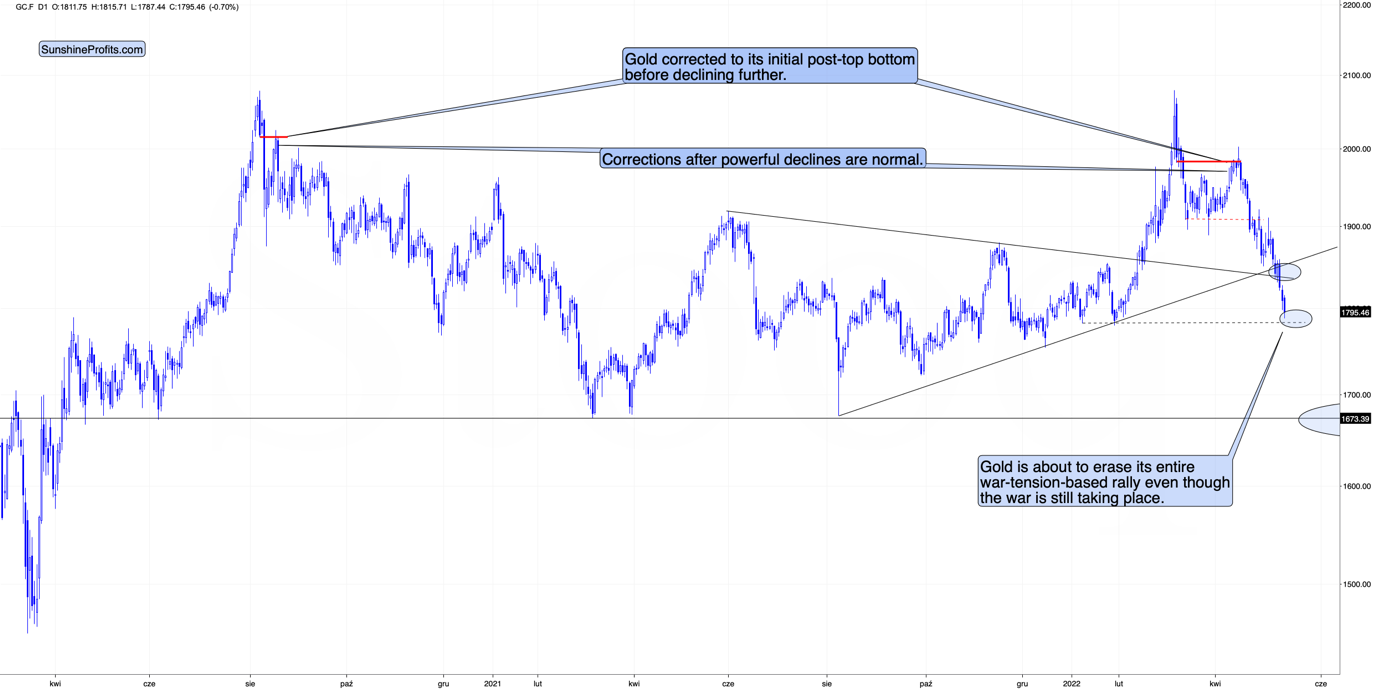
Gold is down to new lows in today’s pre-market trading, and it’s well below my initial target area for it. However, another important support level is just around the corner.
I don’t mean just the psychologically important (being round) $1,800 level. That too, but it’s crucial to note that gold just moved to levels from which the entire war-tension-based rally started. If it wasn’t for those tensions, gold would likely have plunged profoundly in February and perhaps it would be already after or getting close to its final low. However, since the war has indeed started, gold peaked (when the tensions and uncertainty peaked), and it’s been moving lower since that time – despite what most analysts told you.
Here's what I wrote on February 28, 2022, in the Gold & Silver Trading Alert entitled “Since There is a War, Gold Will Rise, Right? Wrong.”:
Let’s keep in mind that for gold to decline, the war doesn’t have to end, it doesn’t have to be won by either side. The only thing that matters with regard to it, is how big the uncertainty and concern is. And the peak uncertainty/concern might be today, as everything is new, and the situation is dramatically changing the geopolitical environment in Europe.
For comparison, remember Covid-19 cases, deaths in early 2020? That was just a tiny fraction of what we saw later. However, it was new and unknown. People were particularly scared then, and the markets moved particularly significantly then – not based on additional millions of cases and thousands of deaths next year.
Investing and trading are difficult. If it was easy, most people would be making money – and they’re not. Right now, it’s most difficult to ignore the urge to “run for cover” if you physically don’t have to. The markets move on rumor and sell the fact. This repeats over and over again in many (all?) markets, and we have direct analogies to similar situations in gold itself. And junior miners are likely to decline the most, also based on the massive declines that are likely to take place (in fact, it already started) in the stock markets.
That wasn’t the peak uncertainty, but the latter peaked about a week later, and the war is still taking place months later, so it seems that one could say that the above proved to be correct.
Since junior miners just moved to new 2022 lows, it was also profitable not to chase the “emotional stampede”, but rather focus on the analogies to the previous situations from the past. Based on how the situation has developed in the markets so far, it seems that the clearest analogy is to how the gold market performed in 2001, based on the U.S.-Afghanistan war. I provided the chart in my Feb. 28, 2022, analysis, but here it is again:
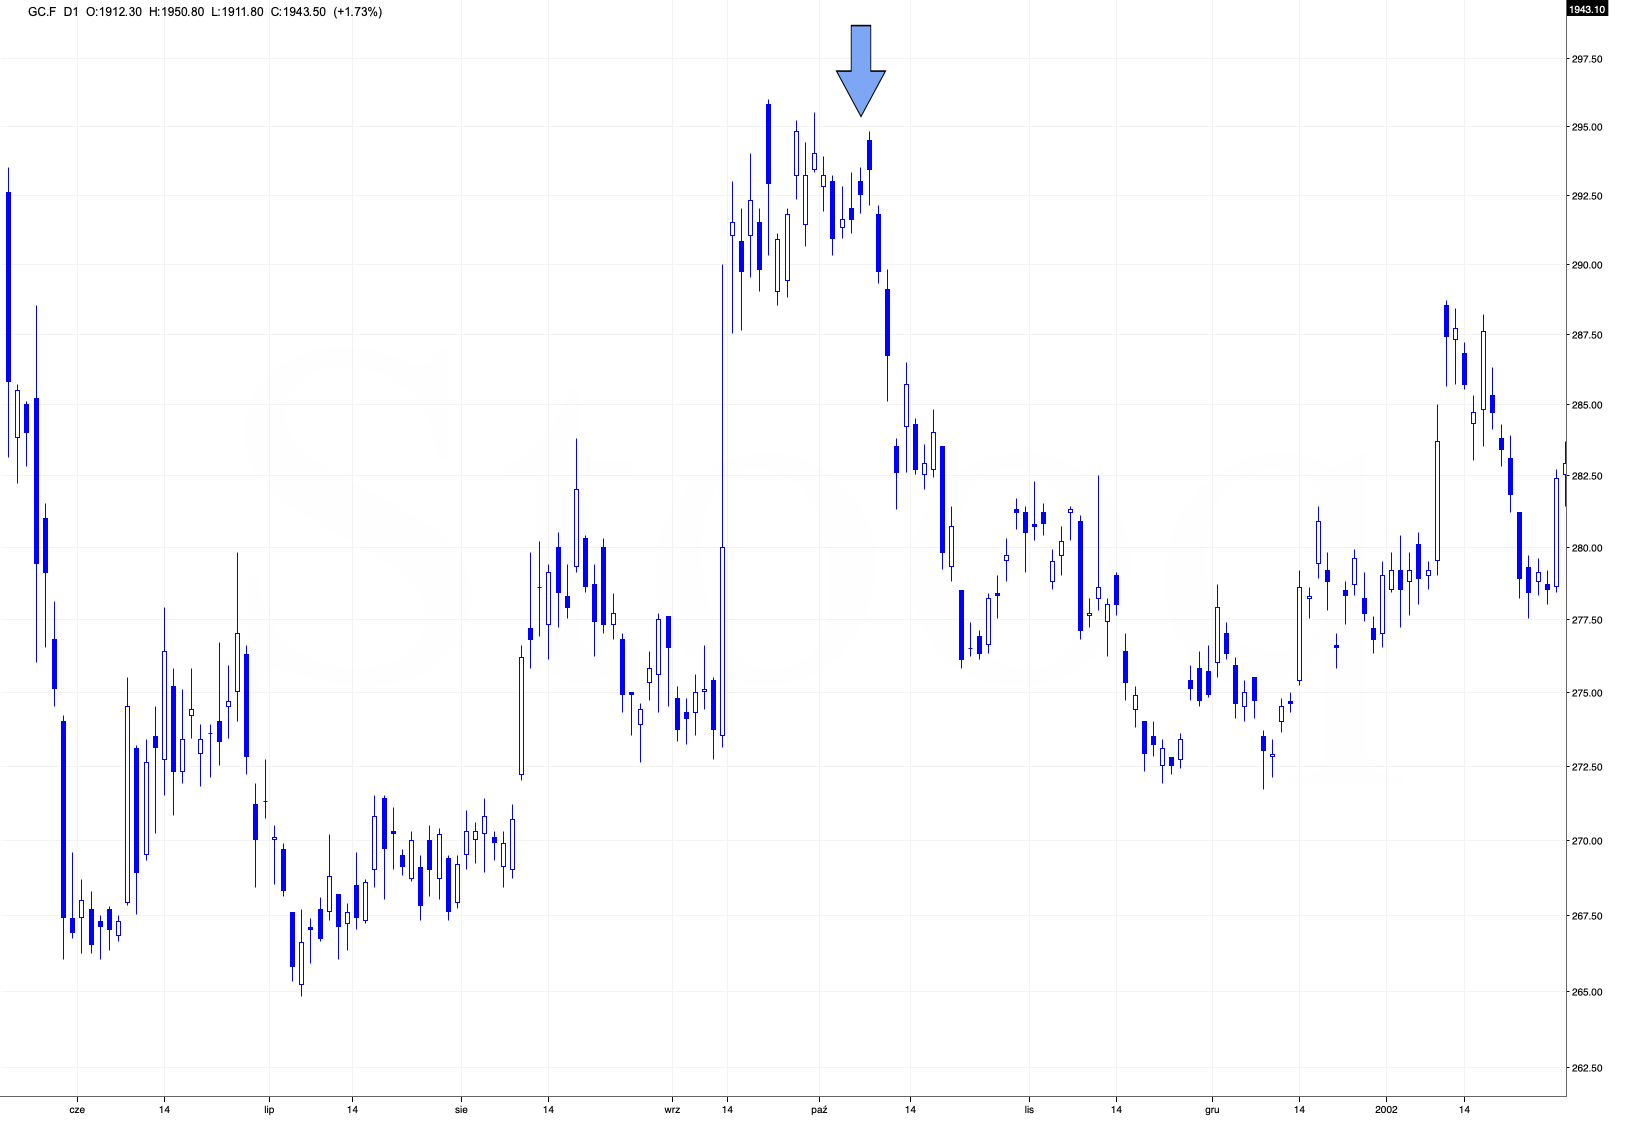
The decline had been big and sharp, but please note when it ended. Gold formed an initial, and then final, short-term bottom, very close to the price levels at which the rally started before the outbreak of the war.
Fast-forward to the current situation – these are the levels that gold is approaching in today’s pre-market trading.
The January 2022 low is $1,781.30 and the February 2022 low (which is also the yearly low) is $1,778.80.
Today’s pre-market low is $1,787.44 (at least so far). That’s less than $10 away from the above-mentioned strong support levels.
All this means is that gold and silver prices might have just bottomed or that they could bottom shortly.
Let’s not forget what miners tend to do before and right after bottoms – they tend to show strength relative to gold. Let’s check what the GDXJ ETF is doing in today’s London trading.
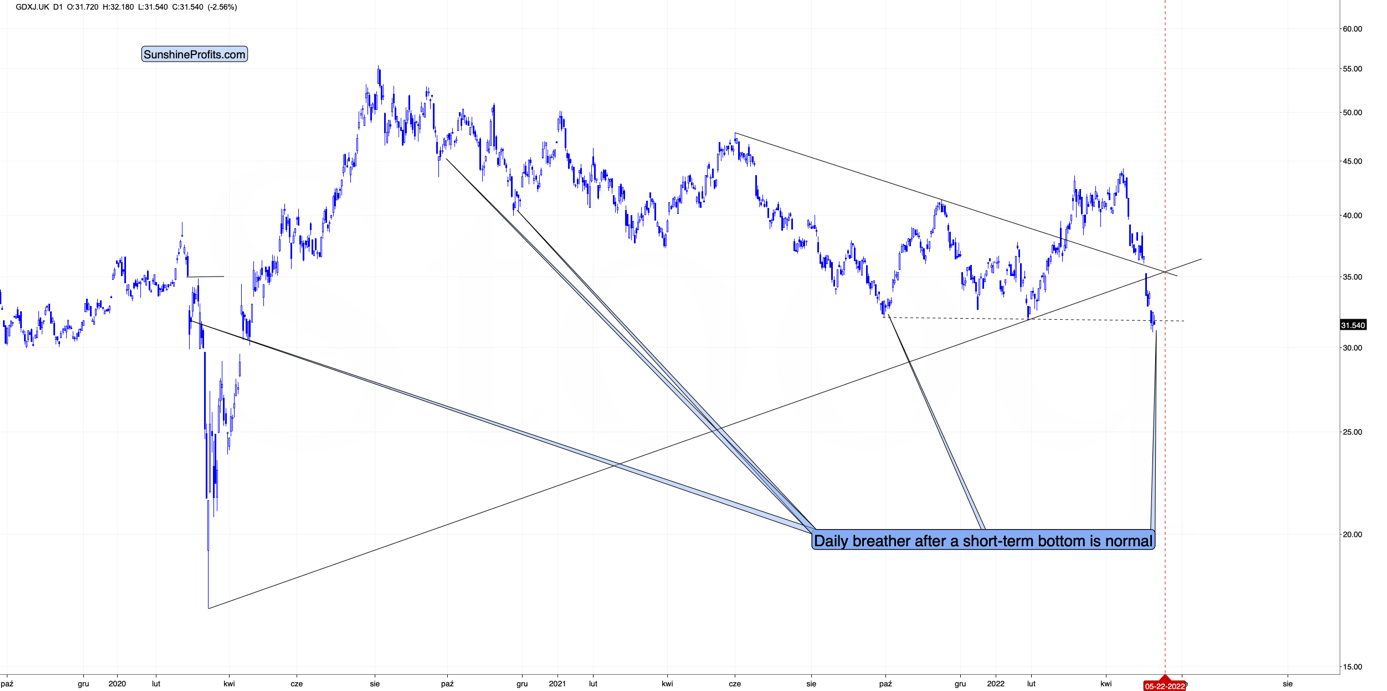
It corrected somewhat, but unlike gold, the GDXJ didn’t move to new lows today. In other words, junior miners are showing strength, just as they are supposed to around the bottoms.
There are three more things on the above chart that I would like to discuss.
- The first is that a daily pause right after the turnaround is common for the GDXJ, and I marked several other occasions where we saw something similar. This includes what we saw after the sharp early-2020 correction.
- The second thing is that it’s clear that the GDXJ just (on Friday) invalidated the small breakdown below its previous (2021 and 2022) lows. This is a huge bullish development (for the short term only!). Invalidations of breakdowns immediately become bullish signals, without the need to wait for confirmation, and that’s what we just saw.
- The third indication is the triangle-vertex-based reversal, which will take place in about a week. It points to some kind of reversal taking place on May 22. That’s Sunday, so based on the above, we might expect a turnaround on Friday or next Monday.
This serves as an indication that we might want to prepare ourselves to close the current long position and go back on the short side of the trade before the end of the week – perhaps on Friday. Geopolitically, a lot can happen over the weekend, so I’d prefer to be positioned along with the medium-term trend beforehand.
The invalidation described as the “second thing” is also something that we saw from the U.S. perspective, so it’s definitely important.
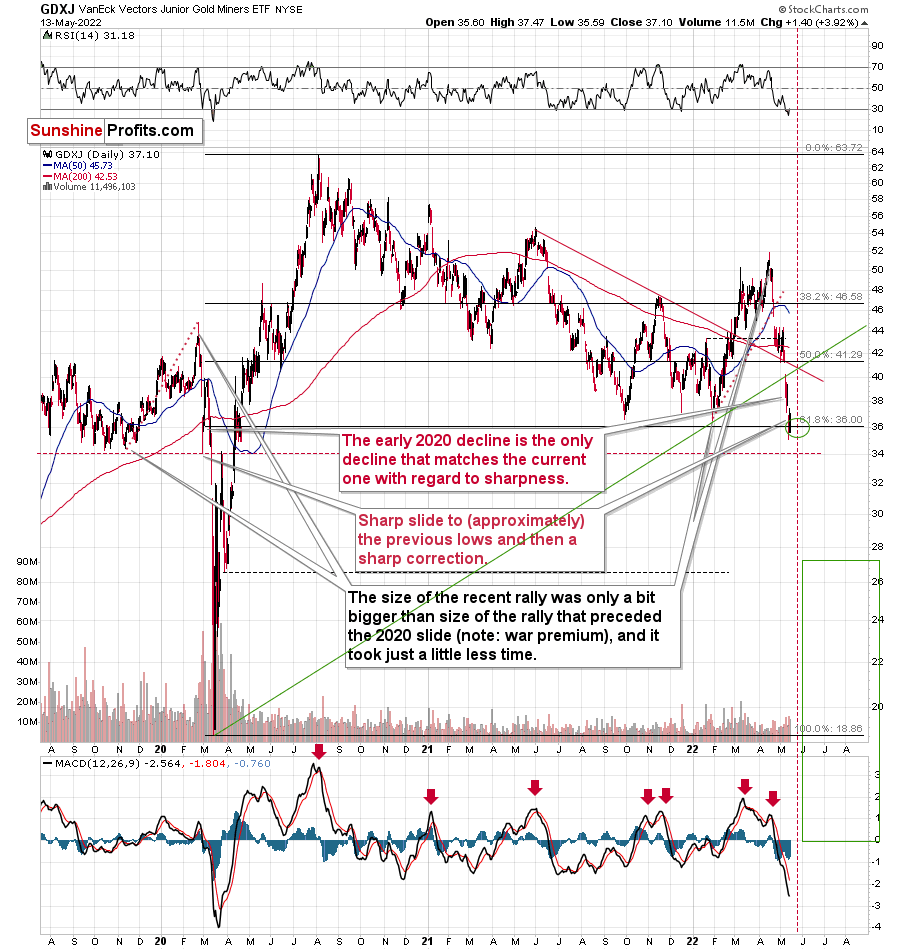
The thing that I’d like to add is that the RSI just moved back above 30 after being below it, which is a classic buy signal. That’s what marked the end of the 2020 decline, and something very similar to what marked the end of the initial March decline (RSI just touched 30 at that time, but it was enough).
Please note that the triangle-vertex-based reversal point is practically the same from the U.S. point of view, so it adds credibility to the scenario in which junior miners top close to the end of this week.
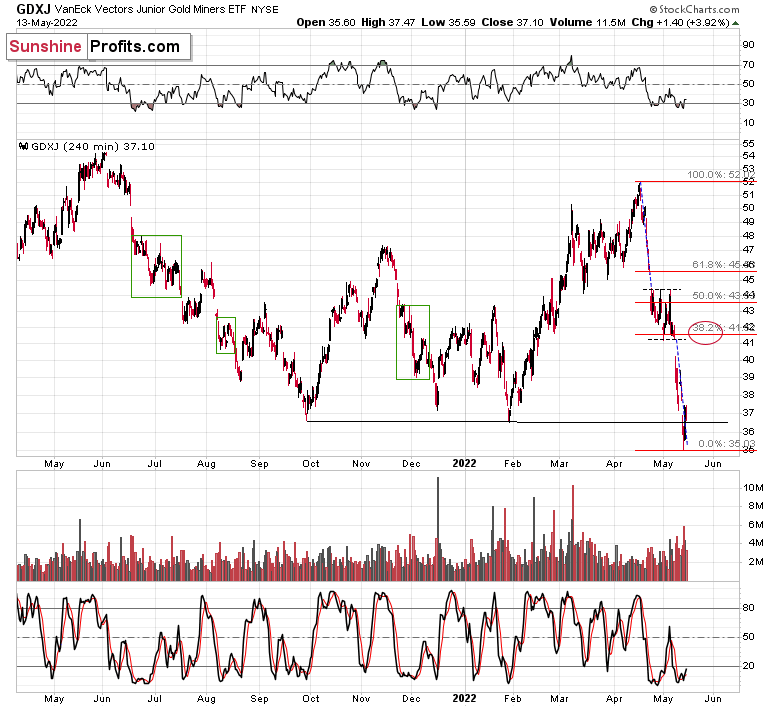
This fits the target area that I provided on Friday on the above 4-hour-candlestick GDXJ chart.
The target would also fit the sharpness of the recent decline. After all, corrections tend to be similarly volatile as the price moves that are being corrected. Of course, let’s keep in mind that the current long position is for trading capital only, not for long-term investments, as I don’t think that the medium-term downtrend in gold, silver, and mining stocks is completely over yet.
The situation in the USD Index and the general stock market developed as per my previous expectations as well.
I’ll quote my Friday’s comments on both and I’ll provide a brief follow-up:
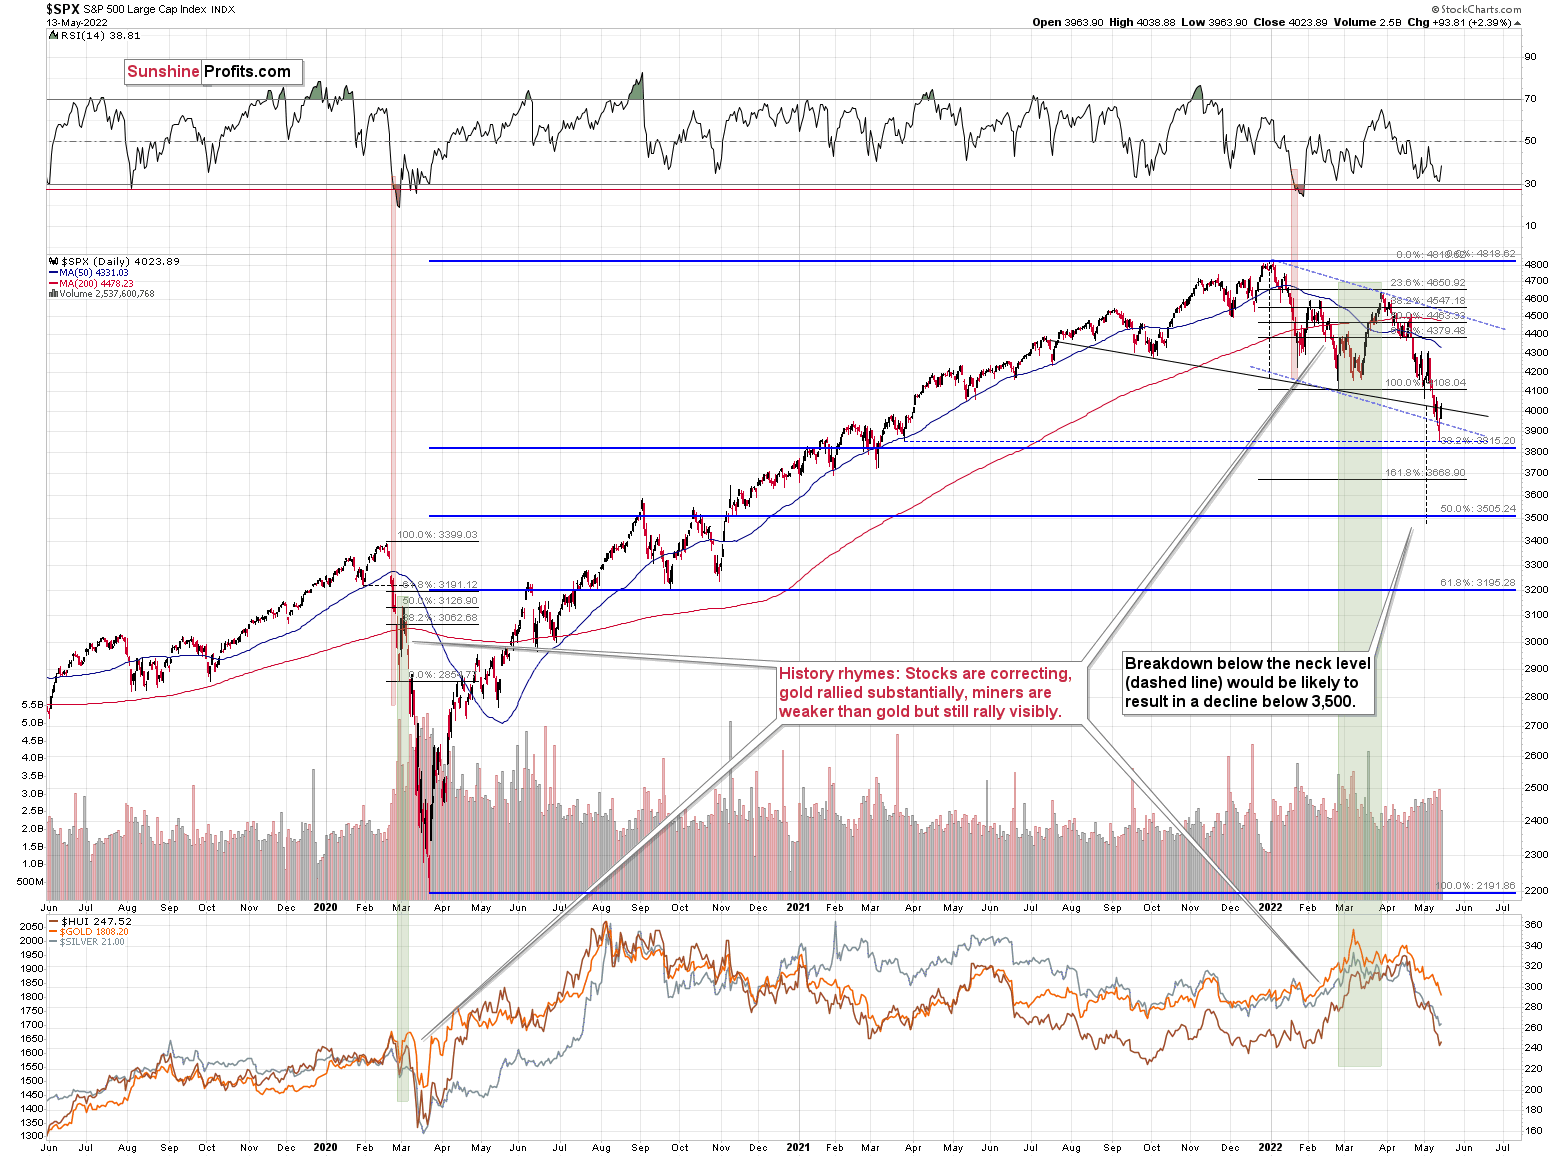
Despite yesterday’s attempt to move higher, stocks closed the day below the neck level of the head and shoulders pattern for the third consecutive day. The bearish H&S pattern was confirmed, just as I expected.
The implications are bearish and while the target based on this formation is slightly below 3,500, it wouldn’t surprise me to see a rebound from about 3,800 – that’s where the 38.2% Fibonacci retracement is located. I previously wrote about it in the following way:
Is there any nearby support level that would be strong enough to stop this short-term decline? Yes: it’s the 38.2% Fibonacci retracement level based on the 2020-2022 rally.
Back in 2020, the very first decline erased 50% of the preceding rally, but back then the market was much more volatile than it is right now, so it’s understandable.
If we see a decline to the 38.2% Fibonacci retracement and then a comeback to the previously broken neck level of the head and shoulders pattern, it would fit practically everything that I wrote above and in the previous days / weeks.
It would trigger another immediate-term decline in silver and mining stocks in the near term that would be followed by a (quite likely tradable) rebound.
So, it seems that the general stock market is quite close to its near-term target area, but not yet at it – another move lower appears likely.
The S&P 500 declined yesterday, but then reversed, and erased almost the entire daily rally. It’s been moving up in today’s pre-market trading as well. So, did stocks already form their short-term bottom? It’s quite likely, but not certain.
The above-mentioned 38.2% Fibonacci retracement is at ~3815, and yesterday’s intraday low was ~3859. This target was not reached, but stocks moved very close to it. However, a different support level was (almost) reached. The late-March 2021 low is at 3853.50, so we could say that stock moved (almost) to it, and this could have triggered the rebound.
This could have been the final (short-term) bottom, but we might see another immediate-term decline that is then followed by a more visible corrective upswing.
Still, given how excessively oversold mining stocks are right now (from the short-term point of view), it didn’t seem justified to keep the short position intact or to wait for opening long positions while waiting on stock to decline even more. After all, the GDXJ repeated its initial part of the decline almost to the letter.
Now, the key technical development that we saw on Friday is that the head and shoulders formation was invalidated as the S&P 500 closed back above the 4,000 level and it moved above the neck level of the pattern on an intraday basis. Only slightly so, but still. If stocks rally here and so does gold, junior miners are almost (well, there are no certainties in any market…) guaranteed to rally too.
Today’s session will be important for stocks, but please note that junior miners are so oversold that they could rally even if the general stock market continues to decline here. That’s exactly what happened at the 2020 bottom (in mid-March).
From a broader point of view, let’s keep in mind what happened in the previous cases when stocks declined profoundly – in early 2020 and in 2008. Miners and silver declined in a truly epic manner, and yes, the same is likely to take place in the following months, as markets wake up to the reality, which is that the USD Index and real interest rates are going up.
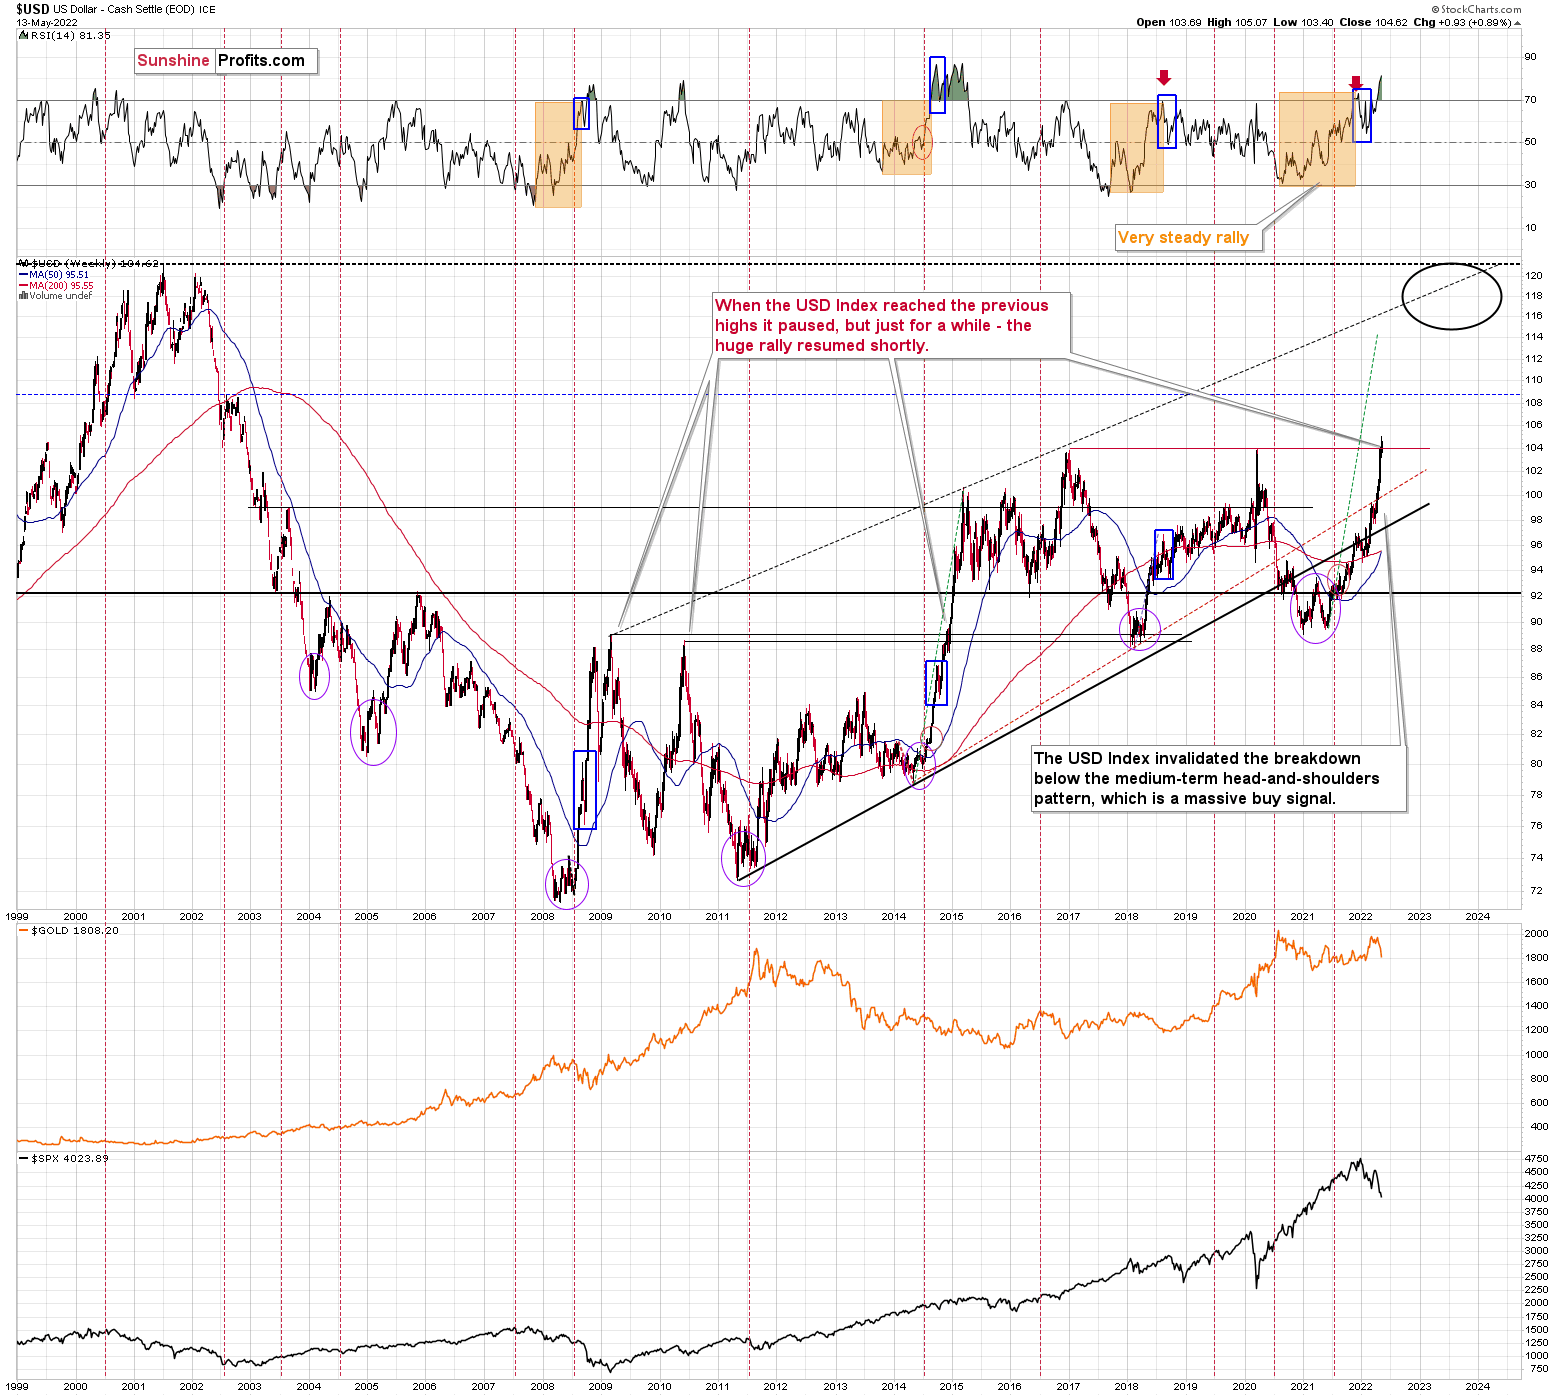
Speaking of the USD Index, after invalidating the breakout below the multi-year head-and-shoulders pattern, the USDX was poised to soar, just like I’ve been expecting it to do for more than a year, and that’s exactly what it did.
The RSI is currently above 70, but since the USDX is in a medium-term rally and is already after a visible correction, it can rally further. Please note that we saw the same thing in 2008 and 2014. I marked the corrections with blue rectangles.
Still, the USD Index is now practically right at its next strong resistance – at about 104.
I previously wrote the following about this target:
It doesn’t mean that the USD Index’s rally is likely to end there. It’s not – but the USDX could take a breather when it reaches 104. Then, after many investors think that the top has been reached as the USDX corrects, the big rally is likely to continue.
The important detail here is that the consolidation close to the 104 level doesn’t have to be really significant (perhaps 1-2 index points of back-and-forth movement?) and it definitely doesn’t have to take long. The interest rates are going higher, and investors appear to have just woken up to this reality – it will take some time before everyone digests what’s going on. Before the late-reality-adopters join in, the USD Index could be trading much, much higher.
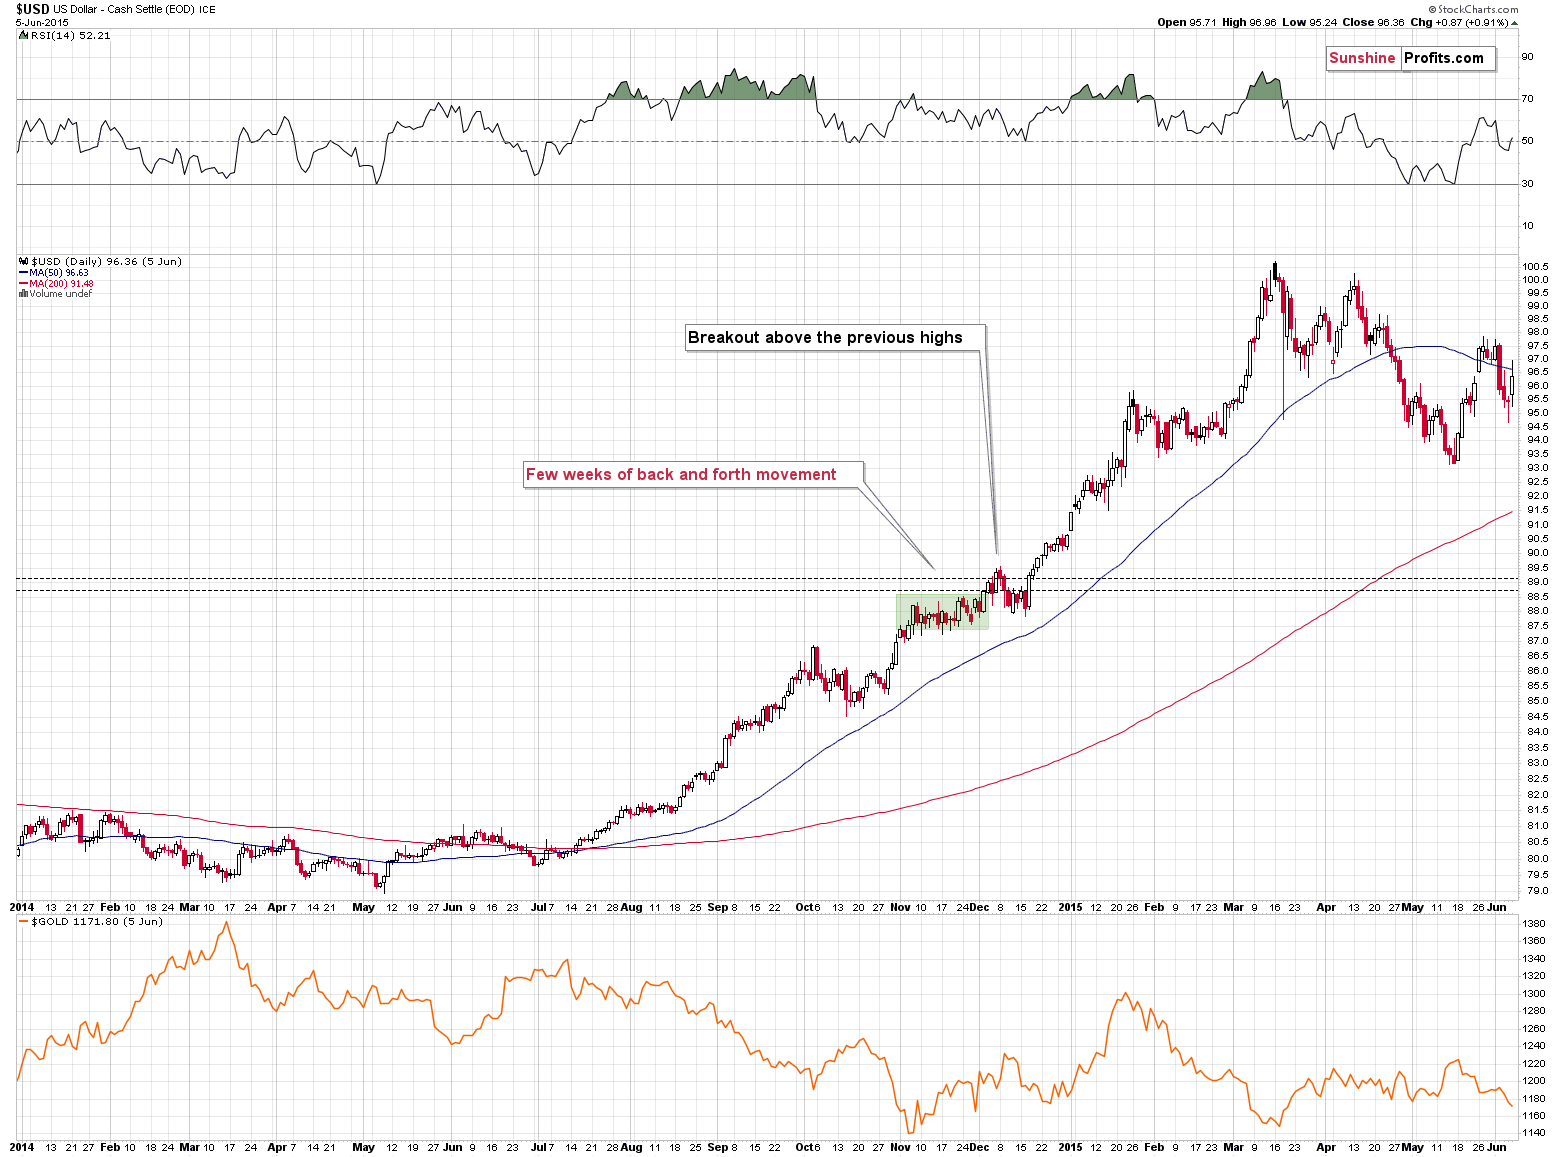
Back in 2014, when the USD Index approached its previous highs (close to 89), it consolidated so quickly that it’s almost not visible on the above chart – it took just a bit more than a week (from Dec. 8, 2014 – 89.56 to Dec. 16, 2014 – 87.83).
I previously wrote the following:
We could see something similar this time – and as the USD Index corrects for about a week, the same thing could take place in other markets as well: stocks and PMs. If junior miners were after a very sharp slide at that time, they would be likely to correct sharply as well.
I would like to add one important detail. Back in 2014, the USD Index didn’t correct after reaching its previous high. It corrected after moving above it. The higher of the highs was the March 2009 high, at 89.11.
The higher of the recent highs is at 103.96 right now, so if the analogy to 2014 is to remain intact, the USD Index could now top at close to 104.5 or even 105.
That’s exactly what happened recently. On Thursday, the USD Index moved to 104.96, and in Friday’s trading it rallied above 105 (to 105.065) and invalidated the breakout above this level - which is in perfect tune with what I wrote above. Consequently, it seems that we could now see a move to about 103-103.5, after which USD’s rally could continue.
The opposite is likely to take place in the precious metals sector. Gold, silver, and mining stocks are likely to rally in the near term, and then – after topping at higher levels – their decline would continue.
Having said that, let’s take a look at the markets from a fundamental point of view.
Powell’s Post-mortem
With the PMs likely to produce short-term rallies, the GDXJ ETF's price action on May 13 has us off to a good start. However, since fundamentals aren't as reliable as technicals for short-term trading, I’ll continue to prioritize the medium-term developments that should impact the PMs' prices when their bear markets resume.
For example, the Fed is hawked up, the USD Index remains in an uptrend, and real yields should also continue their ascent. As a result, the PMs' medium-term fundamental outlooks are profoundly bearish.
To that point, with Fed Chairman Jerome Powell sending ominous messages on May 12, the realities that I've been warning about are coming to fruition. Speaking with Marketplace, Powell said:
“I thought it was important to try to speak directly to the public that we serve and tell them that we understand that inflation is very painful, that the Fed is accountable to get inflation down to 2%, and that we have the tools and we have the, you know, the strong desire to get inflation under control. And we’ll do that.”
He added:
“I will also say that the process of getting inflation down to 2% will also include some pain, but ultimately the most painful thing would be if we were to fail to deal with it and inflation were to get entrenched in the economy at high levels, and we know what that’s like. And that’s just people losing the value of their paycheck to high inflation and, ultimately, we’d have to go through a much deeper downturn. And so we really need to avoid that.”
For context, I noted on Apr. 29 that letting inflation rage would lead to an even larger disaster down the road. Thus, that’s why the Fed won’t do it. I wrote:
While I've warned on numerous occasions that the Fed is in a lose-lose situation, investors still hold out hope for a dovish pivot. However, they fail to understand the consequences. For example, a dovish 180 is extremely unlikely in this environment; but even if officials completely reversed course, the long-term economic damage would be even more paramount.
Therefore, with Powell highlighting that “inflation is just way too high here in the United States” and that “some pain” should materialize as the policy normalization unfolds, he’s finally acknowledging reality.
Please see below:
 Source: Marketplace
Furthermore, I’ve been warning for months that investors’ misunderstanding of the drivers of inflation led to short-sighted compliancy. However, now, the realities of sticky inflation are more pronounced, and the longer the pricing pressures persist, the longer investors have to wait for the Fed to bail them out. As a result, investors fail to realize that Powell is not coming to the rescue. For context, I wrote on May 13:
The Commodity Producer Price Index (PPI) soared by more than 2% month-over-month (MoM) on May 12. Moreover, with the data mirroring the 1970s on a year-over-year (YoY) basis, the post-GFC crowd has no idea that the Fed's hands are tied.
Please see below:
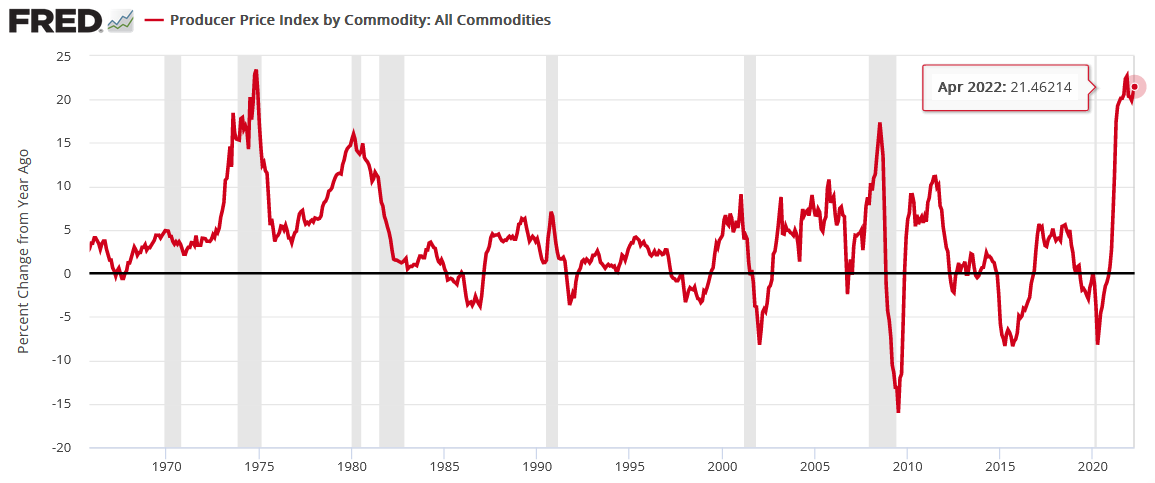
To explain, the red line above tracks the YoY percentage change in the commodity PPI. If you analyze the right side of the chart, you can see that the metric has resumed its ascent and increased by more than 21% YoY. Likewise, the current reading is only rivaled by the unanchored inflation of the 1970s.
Furthermore, if you analyze the vertical gray bars, notice how material YoY spikes in the commodity PPI often coincide with or are followed by recessions? In addition, what do you think will happen to the commodity PPI if the Fed turns dovish and resumes QE? As a result, the investors that assume that the Fed will right the ship don’t realize that the Titanic has already hit the iceberg.
To that point, Powell sounds like a man that realizes his fate. Noting that younger generations “haven’t experienced” rampant inflation or the consequences of taming the beast, he stated that a repeat of the 1970s would be a “very unpleasant phenomenon.”
Please see below:
 Source: Marketplace
Likewise, Powell’s interview essentially covered everything that I warned about since 2021; and with his confidence in a “soft landing” eroding, the medium-term realities should have profound impacts on the S&P 500 and the PMs.
Please see below:
 Source: Marketplace
Thus, while Powell and his crew missed the forest through the trees, I warned on Dec. 23 and updated on Mar. 31 that resilient demand would prove problematic for the inflation bears. I wrote:
There is a misnomer in the financial markets that inflation is a supply-side phenomenon. In a nutshell: COVID-19 restrictions, labor shortages, and manufacturing disruptions are the reasons for inflation’s reign. As such, when these issues are no longer present, inflation will normalize and the U.S. economy will enjoy a “soft landing.”
However, investors’ faith in the narrative will likely lead to plenty of pain over the medium term. For example, I’ve noted for some time that the U.S. economy remains in a healthy position. And with U.S. consumers flush with cash and a red hot labor market helping to bloat their wallets, their propensity to spend keeps economic data elevated. Likewise, while most investors assumed that consumer spending and inflation would fall off a cliff when enhanced unemployment benefits ended in September, the reality is that neither will die easy.
Please see below:
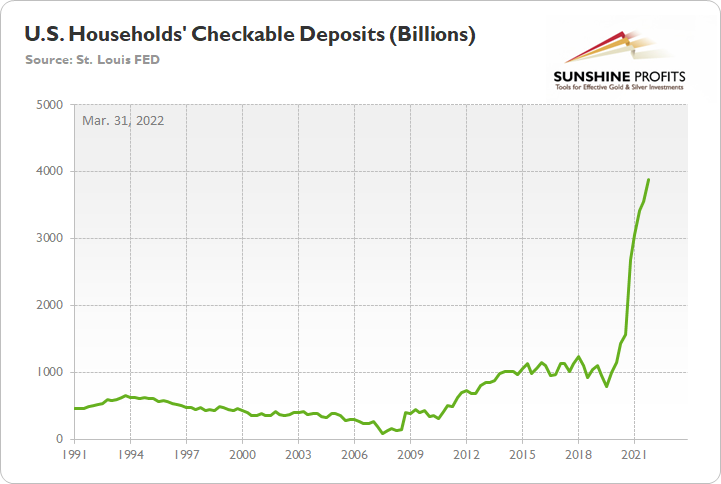
To explain, the green line above tracks U.S. households’ checkable deposits (data released on Mar. 10). For context, it’s the amount of money that U.S. households have in their checking accounts and/or demand deposit accounts.
If you analyze the vertical ascent on the right side of the chart, you can see that U.S. households have nearly $3.89 trillion in their checking accounts. For context, this is 288% more than Q4 2019 (pre-COVID-19). As a result, investors misunderstand the amount of demand that’s driving inflation.
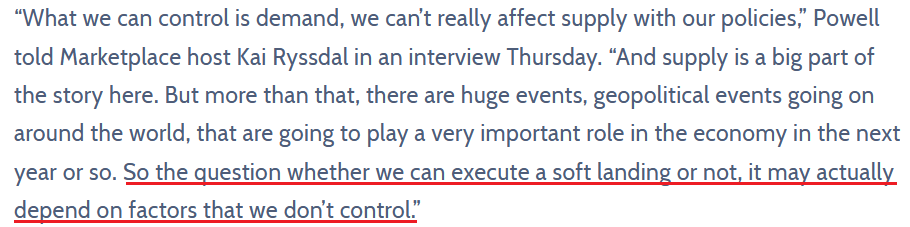
Continuing the monetary autopsy, Powell’s enlightenment highlights inflation’s ability to humble those that dismiss its capabilities. For context, I noted the importance of this statement during Powell’s press conference following the FOMC meeting on May 4. I wrote on May 5:
Referencing a “softish landing” completely lacks confidence, but it’s Powell’s way of recognizing reality without spooking the financial markets. Moreover, as one of the most important quotes of the press conference, he added:
“I do expect that this will be very challenging; it’s not going to be easy; and it may well depend on events that are not in our control. But our job is to use our tools to try to achieve that outcome, and that’s what we’re going to do.”
As such, with Powell noting that a soft landing "may well depend on events that are not in our control," he's essentially telling you that the Fed is past the point of managing this outbreak. In reality, inflation is like cancer. Once it spreads, it reaches a point where too much damage has been done to save the patient.
Therefore, while Powell learned a hard lesson by ignoring inflation, the permabulls should learn a hard lesson if they ignore Powell. As a result, while most market participants liken Powell to Superman, he reiterated on May 12 that the Fed might no longer be in “control” of the medium-term outcome.
Please see below:
 Source: Marketplace
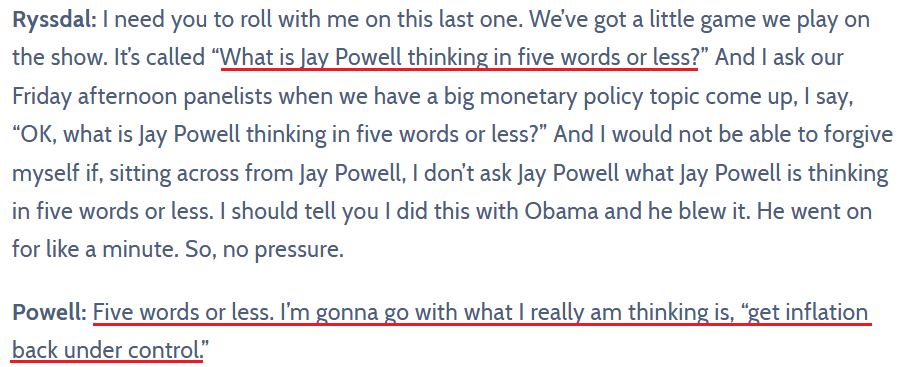
Finally, I warned on Dec. 23 that the ghosts of QE would haunt investors in 2022. I wrote:
When the Fed called inflation “transitory,” I wrote for months that officials were misreading the data. As a result, I don’t have a horse in this race. However, now, they likely have it right. Thus, if investors assume that the Fed won’t tighten, their bets will likely go bust in 2022.
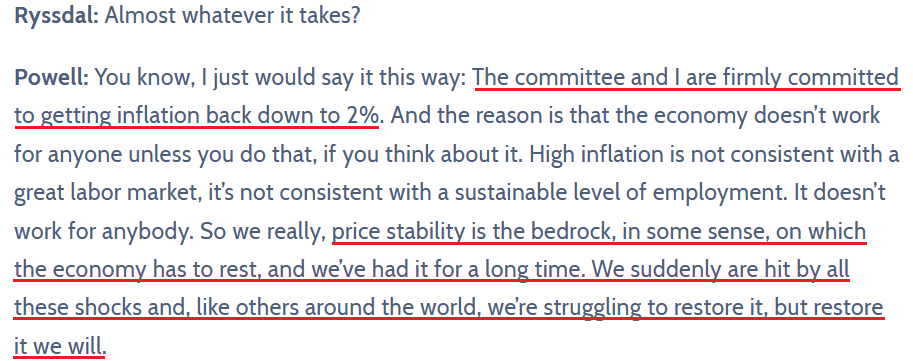
To that point, when asked on May 12 if he will do “whatever it takes” to restore price stability, Powell responded:
 Source: Marketplace
As a result, while I repeatedly warned that Fed officials weren’t bluffing, Powell ended the interview with what may be the most important words uttered in 2022:
 Source: Marketplace
The bottom line? While Powell finally had his come-to-Jesus moment on May 12, the reality is that ignoring inflation does more harm than good. Moreover, it’s ironic that investors continue to pray for a dovish pivot when such a realization would actually sink the U.S. into a deeper and longer recession. Yes, the short-term sugar high may push risk assets higher immediately, but the long-term consequences would be dire. As a result, Powell seems smart enough to understand this.
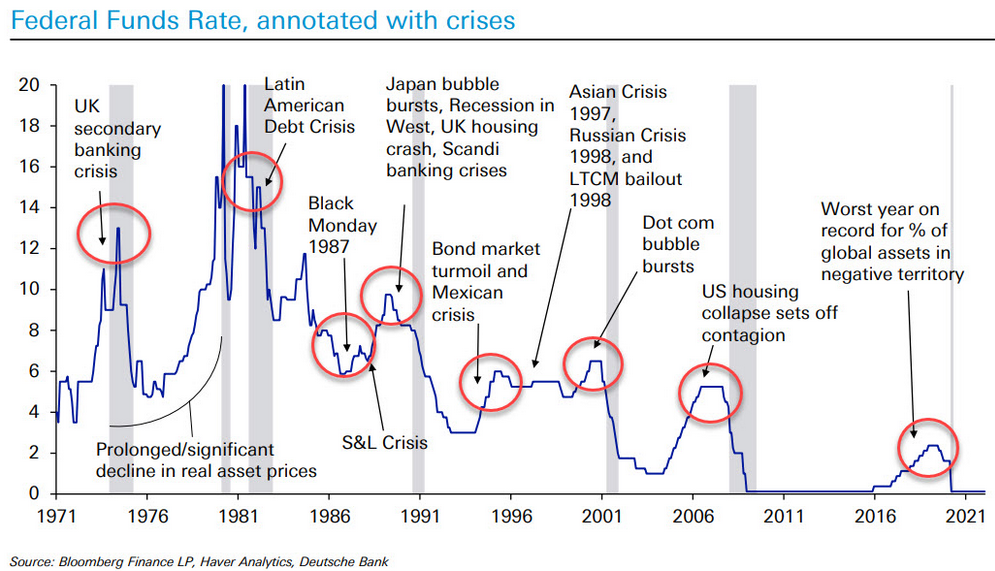
However, the lesser of two evils doesn’t mean that solving the inflation puzzle will be easy. With unprecedented stimulus decoupling consumers’ bank accounts and employment opportunities from their pre-COVID-19 trends, reverting them back to sustainable levels should result in plenty of economic pain over the medium term.
Moreover, with a higher U.S. federal funds rate known to roil the financial markets, it’s important to remember that many of the crises that unfolded below occurred with inflation at much lower starting points. Therefore, good luck with that “soft landing”, Mr. Powell.
In conclusion, the PMs were mixed on May 13, as gold ended the day in the red. However, the GDXJ ETF outperformed and should have further upside. As a result, while the PMs’ medium-term outlooks remain treacherous, we can still reap short-term profits in the interim.
Overview of the Upcoming Part of the Decline
- It seems to me that the short-term decline in the precious metals market is over or about to end, and we’ll see a quick rebound from the current levels soon.
- After the above-mentioned correction, we’re likely to see another big slide, perhaps close to the 2021 lows ($1,650-$1,700).
- If we see a situation where miners slide in a meaningful and volatile way while silver doesn’t (it just declines moderately), I plan to – once again – switch from short positions in miners to short positions in silver. At this time, it’s too early to say at what price levels this could take place, and if we get this kind of opportunity at all – perhaps with gold close to $1,600.
- I plan to exit all remaining short positions once gold shows substantial strength relative to the USD Index while the latter is still rallying. This may be the case with gold close to $1,400. I expect silver to fall the hardest in the final part of the move. This moment (when gold performs very strongly against the rallying USD and miners are strong relative to gold after its substantial decline) is likely to be the best entry point for long-term investments, in my view. This can also happen with gold close to $1,400, but at the moment it’s too early to say with certainty.
- The above is based on the information available today, and it might change in the following days/weeks.
You will find my general overview of the outlook for gold on the chart below:
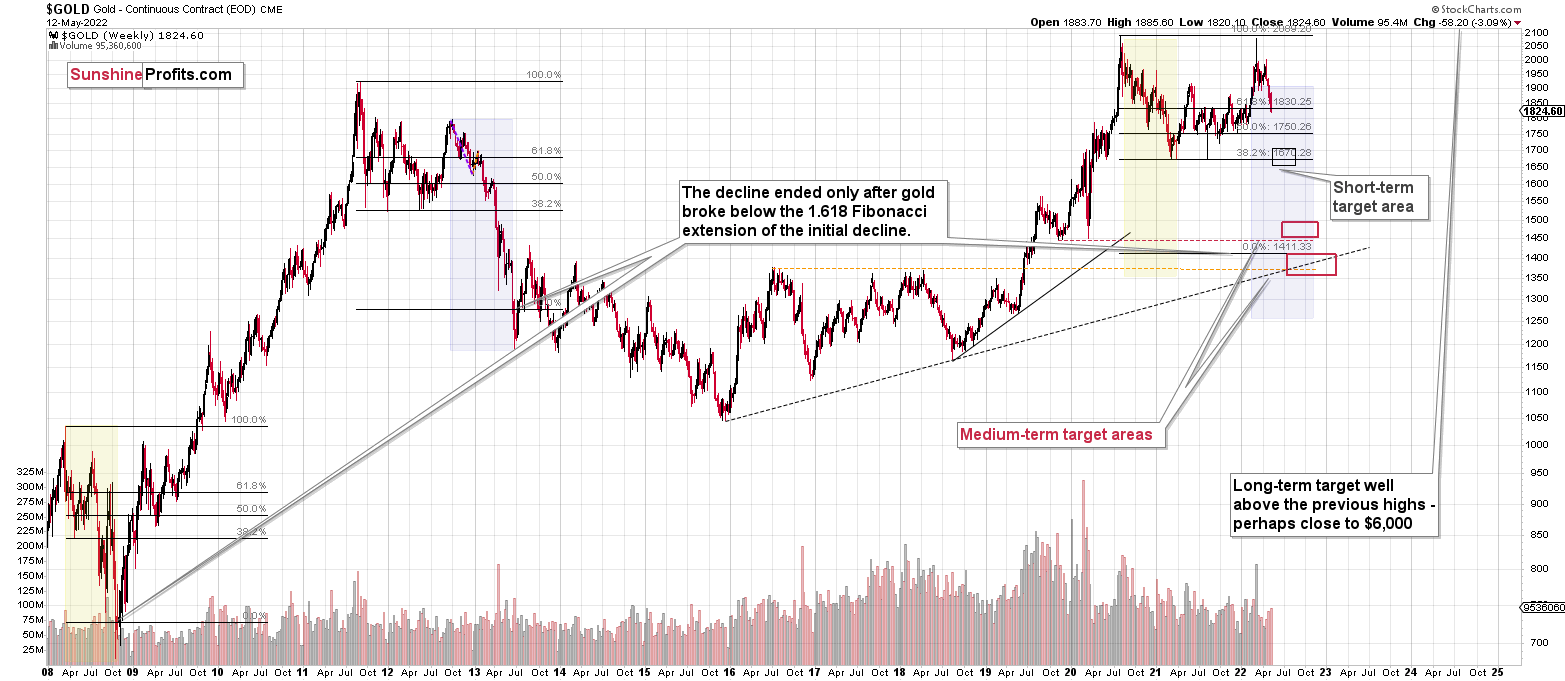
Please note that the above timing details are relatively broad and “for general overview only” – so that you know more or less what I think and how volatile I think the moves are likely to be – on an approximate basis. These time targets are not binding or clear enough for me to think that they should be used for purchasing options, warrants or similar instruments.
Summary
Summing up, it seems that we are about to see a short-term corrective upswing in the precious metals sector (perhaps until the end of this week), even though the medium-term trend remains clearly down.
The medium-term downtrend is likely to continue shortly (perhaps after a weekly or a few-day long correction). As investors are starting to wake up to the reality, the precious metals sector (particularly junior mining stocks) is declining sharply. Here are the key aspects of the reality that market participants have ignored:
- rising real interest rates,
- rising USD Index values.
Both of the aforementioned are the two most important fundamental drivers of the gold price. Since neither the USD Index nor real interest rates are likely to stop rising anytime soon (especially now that inflation has become highly political), the gold price is likely to fall sooner or later. Given the analogy to 2012 in gold, silver, and mining stocks, “sooner” is the more likely outcome.
It seems that our profits from short positions are going to become truly epic in the coming months, and the profits from the current long position are likely to enhance them even further.
After the final sell-off (that takes gold to about $1,350-$1,500), I expect the precious metals to rally significantly. The final part of the decline might take as little as 1-5 weeks, so it's important to stay alert to any changes.
As always, we'll keep you – our subscribers – informed.
To summarize:
Trading capital (supplementary part of the portfolio; our opinion): Full speculative long positions (100% of the full position) in junior mining stocks are justified from the risk to reward point of view with the following binding exit profit-take price levels:
Mining stocks (price levels for the GDXJ ETF): binding profit-take exit price: $40.96; stop-loss: none (the volatility is too big to justify a stop-loss order in case of this particular trade)
Alternatively, if one seeks leverage, we’re providing the binding profit-take levels for the JNUG (2x leveraged). The binding profit-take level for the JNUG: $56.68; stop-loss for the JNUG: none (the volatility is too big to justify a SL order in case of this particular trade).
For-your-information targets (our opinion; we continue to think that mining stocks are the preferred way of taking advantage of the upcoming price move, but if for whatever reason one wants / has to use silver or gold for this trade, we are providing the details anyway.):
Silver futures downside profit-take exit price: $22.88
SLV profit-take exit price: $21.28
AGQ profit-take exit price: $32.18
Gold futures downside profit-take exit price: $1,909
HGU.TO – alternative (Canadian) 2x leveraged gold stocks ETF – the upside profit-take exit price: $19.68
HZU.TO – alternative (Canadian) 2x leveraged silver ETF – the upside profit-take exit price: $12.09
Long-term capital (core part of the portfolio; our opinion): No positions (in other words: cash
Insurance capital (core part of the portfolio; our opinion): Full position
Whether you already subscribed or not, we encourage you to find out how to make the most of our alerts and read our replies to the most common alert-and-gold-trading-related-questions.
Please note that we describe the situation for the day that the alert is posted in the trading section. In other words, if we are writing about a speculative position, it means that it is up-to-date on the day it was posted. We are also featuring the initial target prices to decide whether keeping a position on a given day is in tune with your approach (some moves are too small for medium-term traders, and some might appear too big for day-traders).
Additionally, you might want to read why our stop-loss orders are usually relatively far from the current price.
Please note that a full position doesn't mean using all of the capital for a given trade. You will find details on our thoughts on gold portfolio structuring in the Key Insights section on our website.
As a reminder - "initial target price" means exactly that - an "initial" one. It's not a price level at which we suggest closing positions. If this becomes the case (like it did in the previous trade), we will refer to these levels as levels of exit orders (exactly as we've done previously). Stop-loss levels, however, are naturally not "initial", but something that, in our opinion, might be entered as an order.
Since it is impossible to synchronize target prices and stop-loss levels for all the ETFs and ETNs with the main markets that we provide these levels for (gold, silver and mining stocks - the GDX ETF), the stop-loss levels and target prices for other ETNs and ETF (among other: UGL, GLL, AGQ, ZSL, NUGT, DUST, JNUG, JDST) are provided as supplementary, and not as "final". This means that if a stop-loss or a target level is reached for any of the "additional instruments" (GLL for instance), but not for the "main instrument" (gold in this case), we will view positions in both gold and GLL as still open and the stop-loss for GLL would have to be moved lower. On the other hand, if gold moves to a stop-loss level but GLL doesn't, then we will view both positions (in gold and GLL) as closed. In other words, since it's not possible to be 100% certain that each related instrument moves to a given level when the underlying instrument does, we can't provide levels that would be binding. The levels that we do provide are our best estimate of the levels that will correspond to the levels in the underlying assets, but it will be the underlying assets that one will need to focus on regarding the signs pointing to closing a given position or keeping it open. We might adjust the levels in the "additional instruments" without adjusting the levels in the "main instruments", which will simply mean that we have improved our estimation of these levels, not that we changed our outlook on the markets. We are already working on a tool that would update these levels daily for the most popular ETFs, ETNs and individual mining stocks.
Our preferred ways to invest in and to trade gold along with the reasoning can be found in the how to buy gold section. Furthermore, our preferred ETFs and ETNs can be found in our Gold & Silver ETF Ranking.
As a reminder, Gold & Silver Trading Alerts are posted before or on each trading day (we usually post them before the opening bell, but we don't promise doing that each day). If there's anything urgent, we will send you an additional small alert before posting the main one.
Thank you.
Przemyslaw Radomski, CFA
Founder, Editor-in-chief

