

Briefly: in our opinion, full (300% of the regular position size) speculative short positions in mining stocks are justified from the risk/reward point of view at the moment of publishing this Alert.
On an administrative note: the markets are closed tomorrow (Good Friday), so there is no regular Gold & Silver Trading Alert scheduled for this day. Moreover, due to our Easter Holiday schedule, there will also be no regular Gold & Silver Trading Alert posted on Monday. The next regular Gold & Silver Trading Alert (the flagship issue) will be posted on Tuesday, April 6, 2021. However, just because there will be no regular Alerts posted until Tuesday, it doesn’t mean that I’m stopping monitoring the markets. I’m not – if anything major happens in the meantime (I don’t expect anything major to happen tomorrow, but it’s unclear what happens on Monday), I will keep you updated through the quick intraday Alerts, anyway.
Gold is fighting to stay above its previous 2021 highs, but it doesn’t seem that it’s likely to win this fight. Conversely, it seems ready to sink to new lows any day now, regardless of its temporary, daily shows of strength (e.g., the one that we saw yesterday).
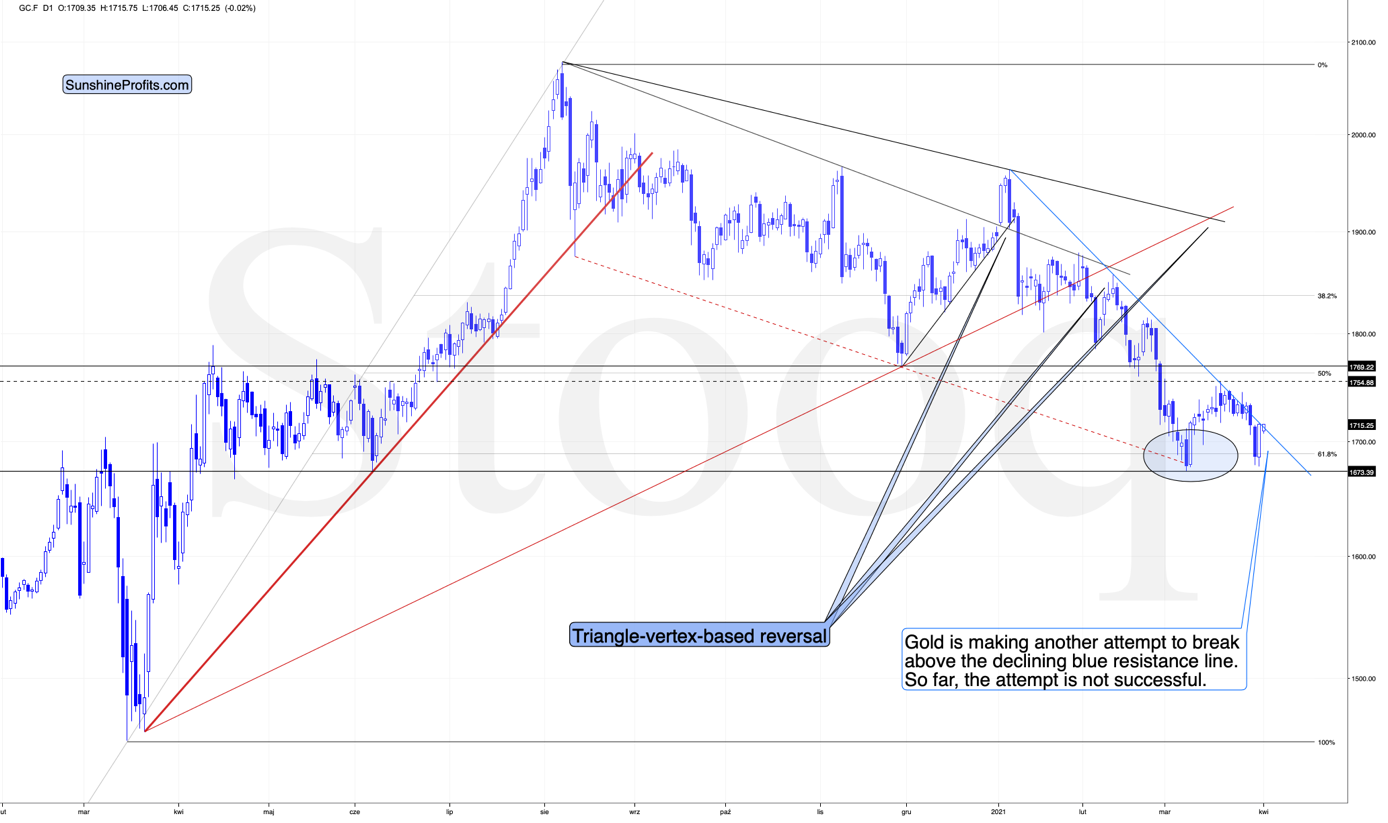
Yesterday, I wrote that gold just invalidated its small breakout above the declining blue resistance line. The previous breakout was small and thus it required a confirmation. It never got one, and instead gold plunged, invalidating the move. This is yet another sell sign that we saw.
It’s true that the above remains up-to-date, but its also true that gold rallied yesterday (Mar. 31), almost erasing Tuesday’s (Mar. 29) decline. Did the rally change anything? Absolutely not. Gold still remains below the declining blue resistance line, so it’s likely to decline once again shortly. This will continue to be the most likely short-term outcome as long as gold doesn’t confirm the breakout above this resistance line.
The above is a short-term factor and it’s not the most important issue due to which gold is likely to move lower in the following weeks. The analogy to the previous sizes of declines that followed the triangle-vertex-based reversal tops is not the most important reason either:
Both previous 2021 declines were followed by quite visible declines. The one that started in early Jan. took gold over $130 lower, and the one that started in mid-Feb. took gold over $170 lower. The current decline started at $1,754.20, so if the history is to rhyme (as it often does), gold would be likely to decline to at least $1,584 - $1,624. This target area corresponds quite well to the support provided by the early Mar. and early Apr. 2020 lows.
The more important reasons due to which it seems likely that the decline will continue are: the rally in the USD Index and the rally in the long-term interest rates.
As far as the latter is concerned, it seems unlikely that we’ll see the Fed stepping into action with another Operation Twist until the general stock market slides. Otherwise, such a big intervention might seem uncalled for. Consequently, the long-term rates are likely to rally some more. And gold is likely to respond by declining further.
As far as the USD Index in concerned, it just moved to new yearly highs, and since the nearest strong resistance is relatively far (from the short-term point of view), it seems that the move higher will continue with only small corrections along the way.
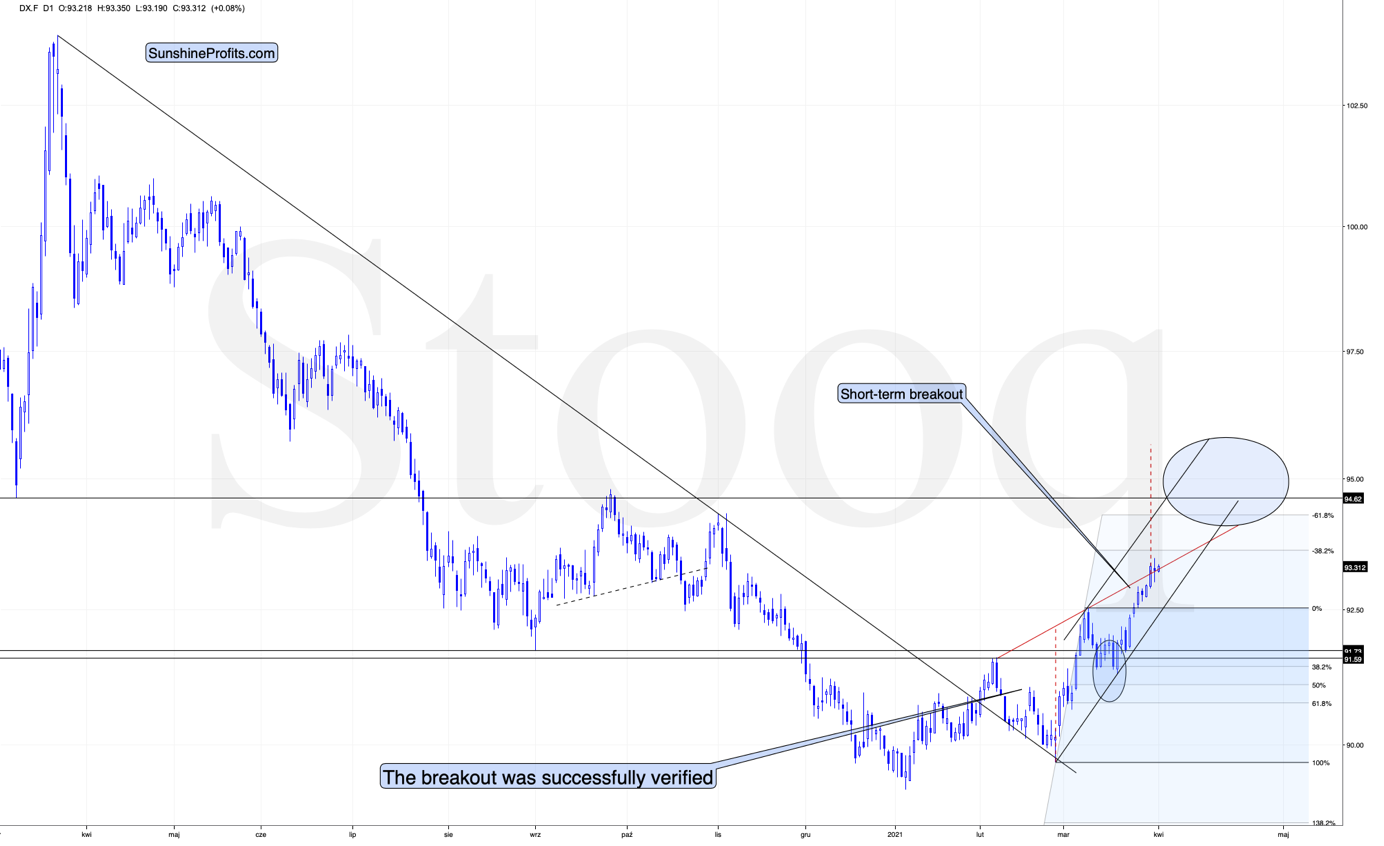
In yesterday’s analysis, I described the above chart in the following way (and it remains up-to-date):
The USD Index has not only confirmed the breakout above its Feb. highs, but it even managed to break above the rising red support line. This line, along with the rising black line based on the Feb. and mid-March lows, creates a rising wedge pattern that was already broken to the upside. The moves that tend to follow such breakouts often are as big as the size of the wedge. I used red, dashed lines for this target-determining technique. Based on it, the USD Index is likely to rally to about 96.65.
The above target is slightly above the mid-2020 highs, so it might seem more conservative to set the upside target at those highs, close to the 94.5-94.8 area. The mid-2020 highs are likely to trigger a breather, but it doesn’t have to be the case that the USD Index pauses below these highs. Conversely, it could be the case that the USD Index first breaks above the mid-2020 highs and consolidates after the breakout. In fact, that’s what it did with regard to the breakout above the Feb. 2021 highs.
Consequently, I’m broadening the target area for the USD Index, so that it now encompasses also the more bullish scenario in which the USDX takes out the mid-2020 highs before consolidating.
Either way, we’re currently in the “easy part” of the USD’s rally. Even if it’s going to consolidate at or below the mid-2020 highs, it’s still very likely to first get there, and this implies a move higher by at least another full index point. This means that the gold price is likely to decline some more before finding short-term support. The scenario fits very well with the situation that I outlined based on the gold chart earlier today.
The thing that I would like to add today, is that the USDX moved back and forth yesterday around the rising red resistance line – the upper border of the rising wedge pattern. This could have been the technical reason that triggered the corrective rally in gold – or it could have been the proximity to the previous lows in gold that made it rally one more time. Or both factors could have played their part.
Either way, after a brief hesitation, the USD Index is now back above the rising red resistance line and if it manages to close above it also today, it will be the third consecutive trading day when that happens. This means that the breakout will be confirmed in such a case. This would be positive for the USD Index in the next weeks, and since the latter tends to move in the opposite way to gold (and the rest of the precious metals sector), it would be bearish for gold.
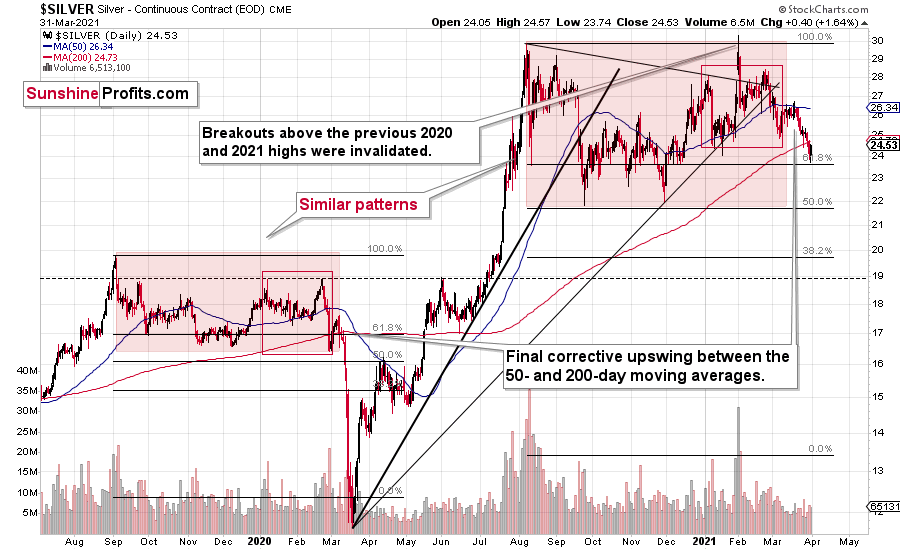
Yesterday, I wrote the following about the silver market:
Silver just broke to new 2021 lows. Everyone buying silver (futures) in Jan. / Feb. is now at a loss and in an increasingly inconvenient situation.
Why would this be important? Because it means that everyone who jumped into the silver market with both feet based on just very brief research (“research”?) which in many cases was following instructions provided at various forums is in a losing position right now.
Sometimes the losses are small – for the very few, who were early, but in some cases, the losses are already quite visible – especially for those, who bought close to $30.
Why is this important? Because it emphasizes the need to verify the quality of the information that one chooses to act on, and because it’s a tipping point after which the previous buyers are likely to start becoming sellers, thus adding to decline’s sharpness.
The “new silver buyers” losses are not huge yet, but after another move lower, they will likely become such and the sales from those buyers would likely make these declines even bigger.
When everyone and their brother was particularly bullish on silver a few months ago, I wrote that they might be quite right, but the timing was terrible. So far, the losses for those, who bought silver earlier this year are not that big, but, in my opinion, they are likely to become much bigger in the following weeks.
Of course, I expect silver price to soar in the following years (well over $100), but not without plunging first in the short and/or medium term.
Silver moved back above the intraday January 2021 low, but it ended the session at new 2021 lows in terms of the daily closing prices. The implications of yesterday’s session are thus bearish.
Even though silver moved higher by $0.40, please note that this kind of movement is within the norm relative to what’s been taking place during the recent decline. The easiest way to tell that is to check if yesterday’s rally is really visible on the above chart – it isn’t.
Let’s take a look at the mining stocks.
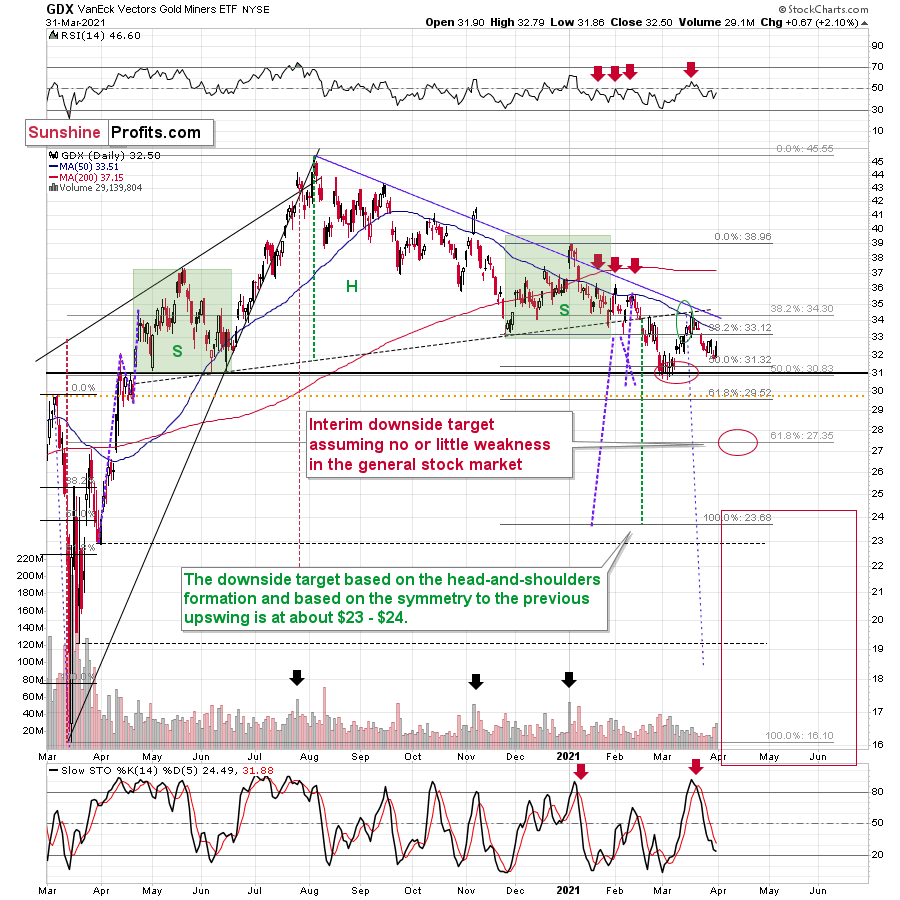
From the regular daily perspective, nothing really changed. Just as I wrote about silver: the daily rally is well within the norm for the current decline.
On the 4-hour charts, however, we see that the GDX and GDXJ invalidated their breakdowns below their head and shoulders patterns. Is this bullish? Yes, that’s a bullish sign for the very short term.
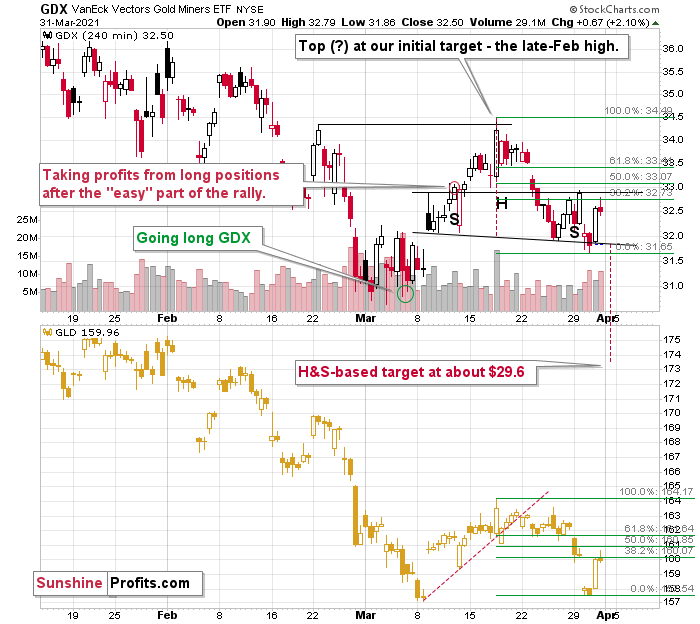
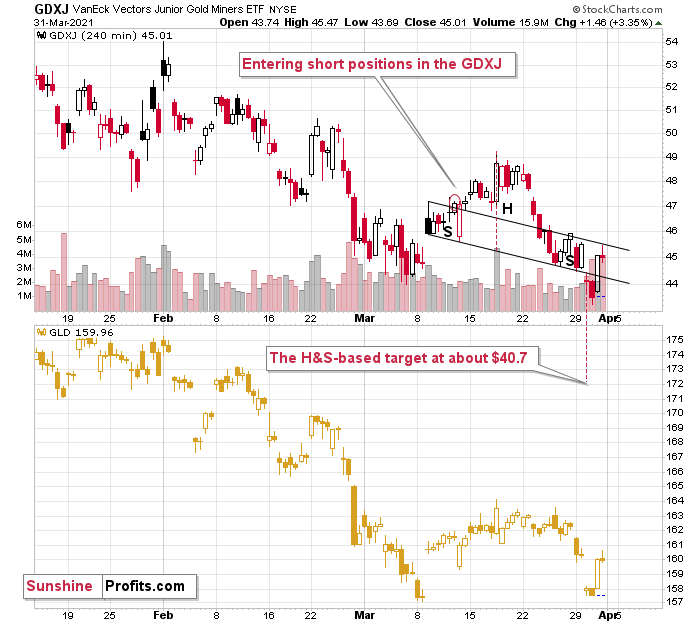
However, based on the sizes of previous counter-trend rallies during the declines, it doesn’t seem to be worth to adjust the current trading positions – most of the rally could already be behind us.
Or it could be behind us entirely, based on what we can see on the daily GDXJ chart below.
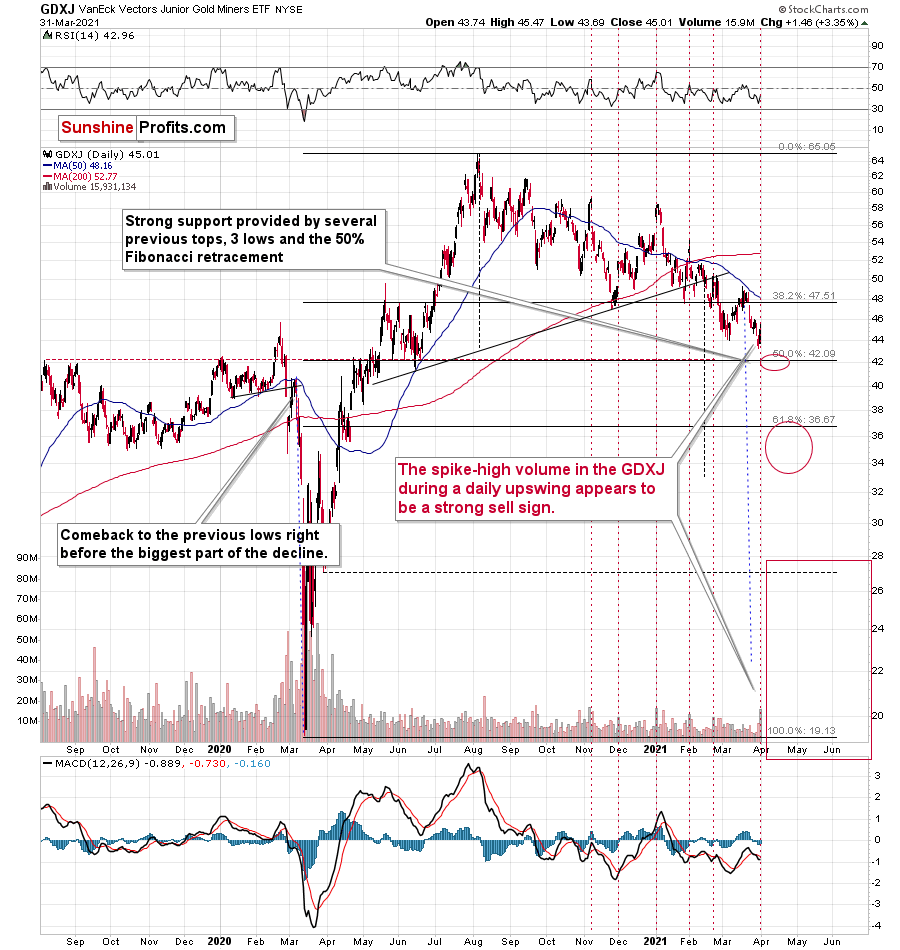
The GDXJ just rallied by over 3% and it happened on strong volume. In fact, the volume was exceptionally high – that was the second highest volume of the year. It was only slightly lower than what we saw on Jan. 4, which was the first session of the year. It was also the second-highest closing price of the year, which effectively means that it was the key top of the year.
In the recent past, there were 5 other cases, when the GDXJ rallied on volume that was much bigger than what used to be norm in the preceding days. In other words, there were 5 other cases when we saw spike-highs in GDXJ’s volume when it rallied. In 2 out of those 5 cases, the volume was similarly big as yesterday. That was in early Jan. 2021 and in Nov. 2020. In both cases massive declines started in the following days.
Out of the 3 remaining cases, 2 (early Feb., late Feb. 2021) were followed by declines as well. The only exception was the early Dec. 2020 where it was not the end of a short-term rally (we’re currently lower than at that time, though).
So, based on the close similarity we get the 2 out of 2 (100%) efficiency in the sell signal provided by GDXJ’s volume, and based on the broader similarity (4 out of 5 cases – 80% efficiency) the efficiency of the sell signal is big, anyway.
Consequently, it seems that what we saw yesterday was “fake and temporary” rally, not a “true” one.
Having said that, let’s take a look at the market from a more fundamental angle.
Perception, Reality and Actuality
As the screams of hope attempt to drown out the whispers of reality, on Mar.31, the EUR/USD and the PMs enjoyed a short-term reprieve. However, with fundamental weight continuously being added to the EUR/USD’s barbell, the currency pair’s demise alongside the USD Index’s rise, will likely elongate the PMs’ downside.
On Feb. 17, I highlighted that The European Commission’s Winter 2021 Economic Forecast (released on Feb. 11) predicted that the Eurozone GDP growth (3.8%) would be headlined by France’s outperformance in 2021.
I wrote:
The report forecasts that France (the yellow box below) will deliver 5.5% GDP growth in 2021. With ambitious being an understatement, it was less than two weeks ago (Feb. 4) that IHS Markit’s Eurozone Productivity PMI fell for a third-straight month (to 47.4 in January) and declined at its fastest pace since June. More importantly though, the report cited France and Italy’s service sectors as the main weak spots.
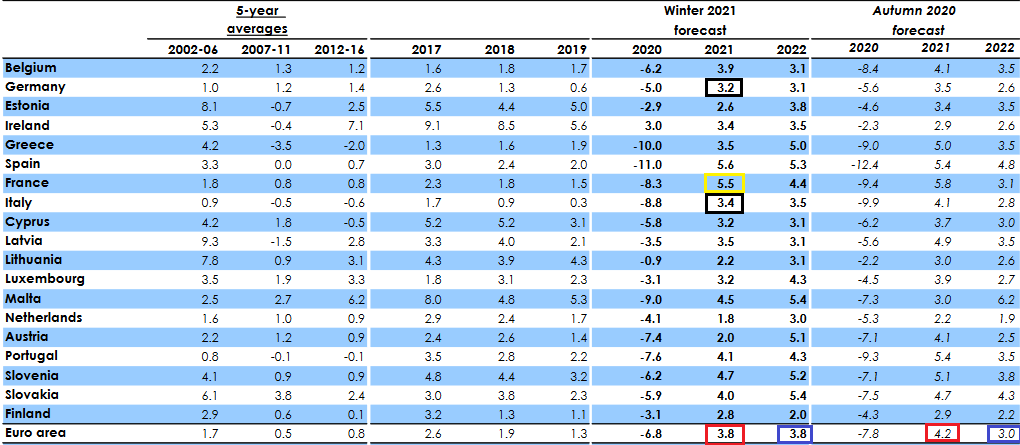 Source: European Commission Winter 2021 Economic Forecast
And after closing out the first quarter of 2021, Europe’s projected bellwether of GDP growth has made relatively little economic progress since November.
Please see below:
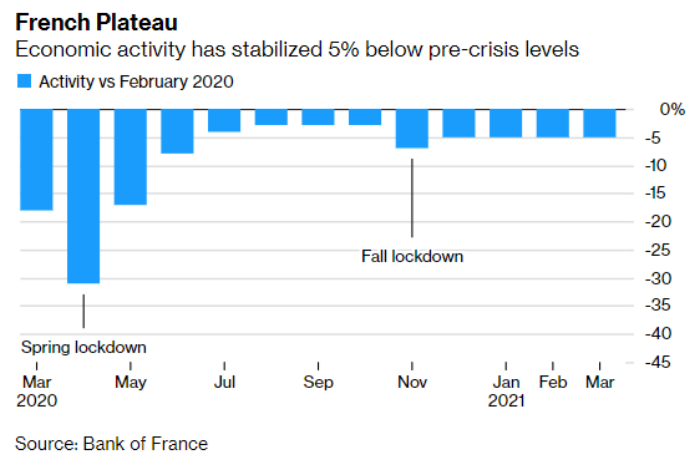
Adding insult to injury, despite the EUR/USD shrugging off the revelation on Mar. 31, Europe’s second-largest economy is now back in full lockdown. Addressing the nation, French President Emmanuel Macron said that "it is the best solution to slow down the virus.” We could “lose control if we do not move now."
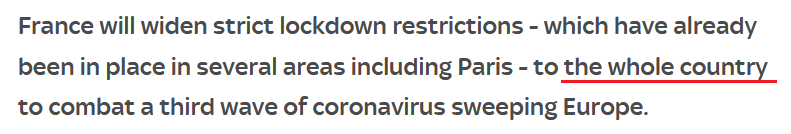 Source: Sky News
Thus, can we finally stick a fork in France’s economic renaissance?
Adding to the EUR/USD’s bearish outlook, the currency pair’s sentix Sentiment Index – which is derived from a weekly survey of more than 5,000 private and institutional investors and reflects their expectations over the next month – has moved sharply lower.
Please see below:
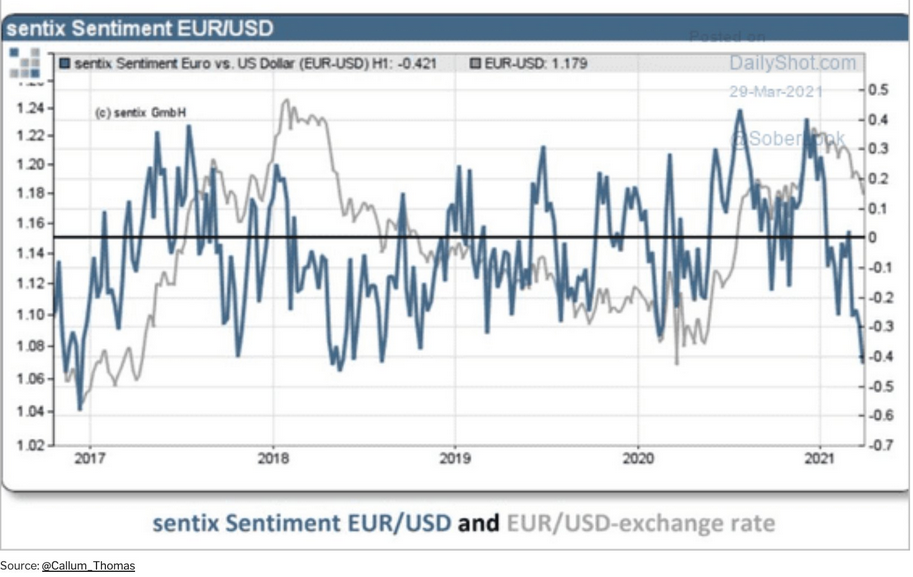
To explain, the blue line above tracks changes in the EUR/USD’s sentix Sentiment Index, while the gray line above tracks changes in the EUR/USD. If you analyze the right side of the chart, notice the large gap between EUR/USD sentiment and the underlying exchange rate?
Can you see one other time when the index was at similarly low levels while the EUR/USD was only after a relatively small decline? It was in the first half of 2018, so the above chart further validates the self-similarity in the USD Index between now and 2018. Since the USD Index soared in 2018, the same is also likely to take place this year.
With the performance of the EUR/USD often rising and falling with the sentix Sentiment Index, the divergence implies that there is still plenty of room for the EUR/USD to move lower.
Third on the docket, I warned on Jan. 22 that the European Central Bank’s (ECB) bond-buying program was likely to accelerate.
I wrote:
The ECB decreased its bond purchases toward the end of December (2020), Then, once January hit (2021), it was back to business as usual. As a result, the ECB’s attempt to scale back its asset purchases was (and will be) short-lived. And as the economic conditions worsen, the money printer will be working overtime for the foreseeable future.
And with projections of prosperity now morphing into resignations of reality, the ECB’s money printer is working days, nights and weekends.
Please see below:
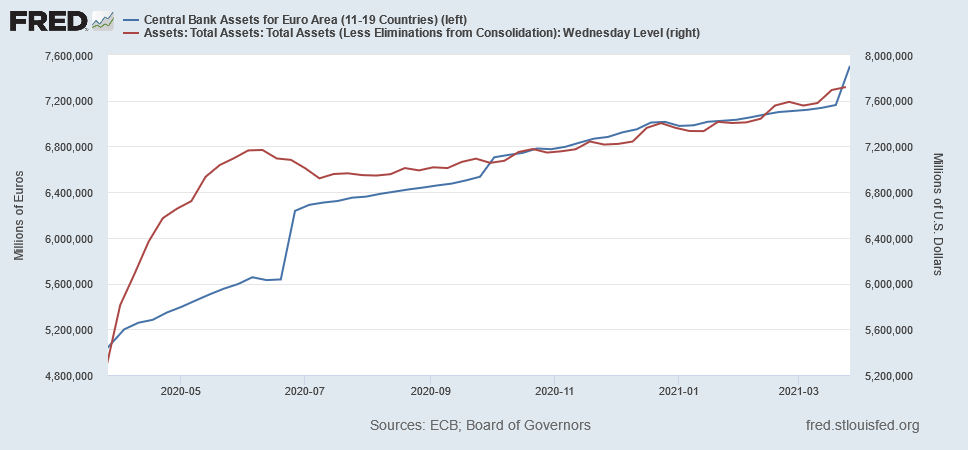
To explain, the blue line above tracks the ECB’s balance sheet, while the red line above tracks the U.S. Federal Reserve’s (FED) balance sheet. Moving at relatively similar speeds over the last year, if you analyze the right side of the above chart, you can see that the ECB went on a manic shopping spree over the last two weeks. Case in point: last week’s bond purchases (€343 billion) were the highest since June 2020 and the ECB’s balance sheet now equals 75% of Eurozone GDP (which is more than double the FED’s).
But what about mean reversion?
Well, it’s possible that the ECB decreases its future PEPP purchases. However, on Mar. 31, when asked about unrest in the European bond market and the modest uptick in interest rates, ECB President Christine Lagarde had an interesting response:
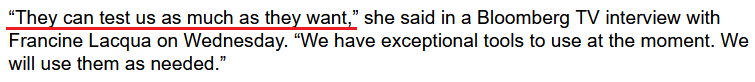 Source: Bloomberg
Translation?
Because Europe can’t handle rising interest rates, if increasing the ECB’s bond-buying program means printing the euro into oblivion … then so be it.
Also worth mentioning, an extreme decoupling has occurred between the EUR/USD and the German DAX (the benchmark equity index of Europe’s largest economy).
Please see below:
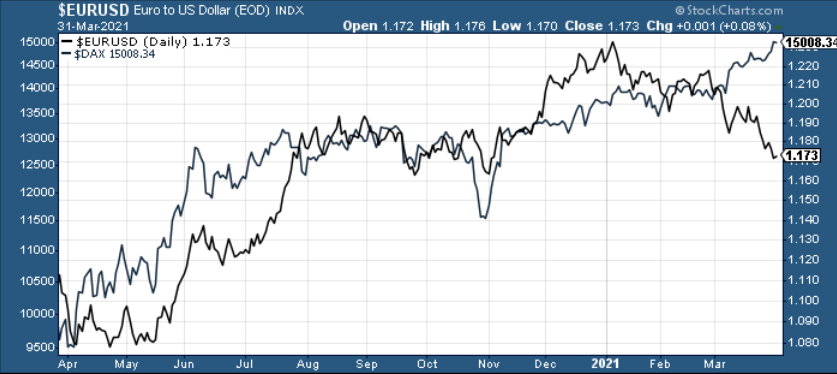
To explain, the performance of the EUR/USD often mirrors the performance of the DAX 30 (and vice versa). However, if you analyze the right side of the chart, you can see that equity optimism has completely run away from currency realism. As a result, if the DAX 30 rolls over, it could put even more downward pressure on the EUR/USD.
Piecing together the puzzle, because the EUR/USD accounts for nearly 58% of the movement of the USD Index and gold has a strong negative correlation with the U.S. dollar, the euro’s plight is profoundly bearish for the yellow metal.
Please see below:
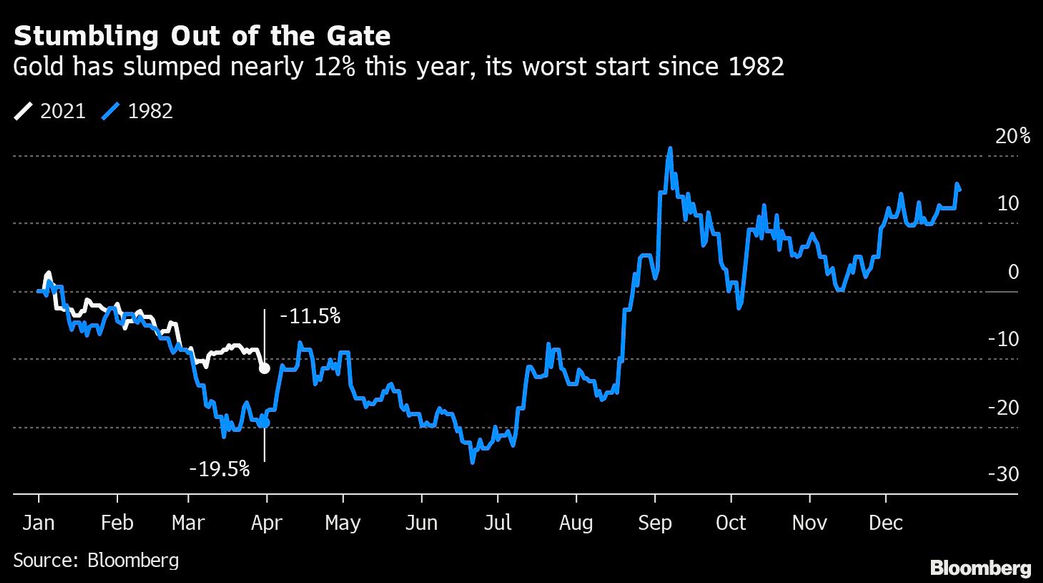
To that point, amid the surge in U.S. Treasury yields and the recent follow-through by the USD Index, gold has delivered its worst YTD performance since 1982.
If that wasn’t enough, Commodity Trading Advisors (CTAs) continue to reduce their exposure to the yellow metal. For context, CTAs manage professional futures portfolios and often employ computer-driven (quant) strategies in their attempts to deliver alpha. And while the latest reading is relatively stretched, history implies that CTA’s allocation still has room to move lower.
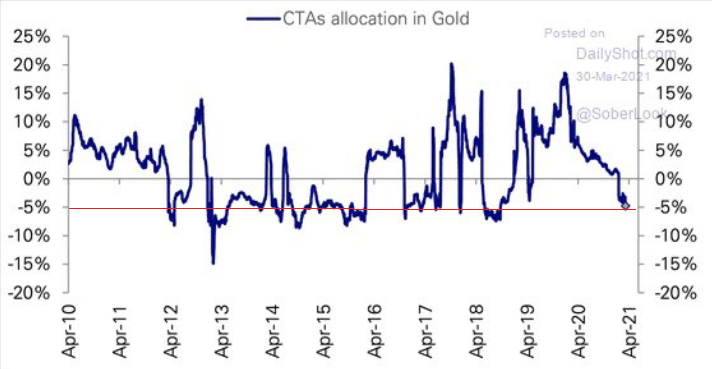 Source: The Daily Shot
In conclusion, the PMs’ strength on Mar. 31 was likely a mirage. Wrapping optimistic equities, subdued Treasury yields and a dormant USD Index into the perfect package, the daily price action was gold’s version of paradise. However, with the tranquility unlikely to last, the yellow metal will soon have to test its mettle against its fiercest opponents. And for the time being, gold is likely ill-equipped to handle the forthcoming challenge.
Overview of the Upcoming Part of the Decline
- It seems quite likely to me that we are already after the initial bottom and the initial correction. If not, then it seems likely to me that the corrective upswing will be completed within the next 2 weeks (with PMs topping in early April). It’s more likely that the next big move lower is already underway, though.
- After miners slide once again in a meaningful and volatile way, but silver doesn’t (and it just declines moderately), I plan to switch from short positions in miners to short positions in silver (this could take another 1-2 weeks to materialize). I plan to exit those short positions when gold shows substantial strength relative to the USD Index, while the latter is still rallying. This might take place with gold close to $1,450 - $1,500 and the entire decline (from above $1,700 to about $1,475) would be likely to take place within 1-12 weeks and I would expect silver to fall hardest in the final part of the move. This moment (when gold performs very strongly against the rallying USD and miners are strong relative to gold – after gold has already declined substantially) is likely to be the best entry point for long-term investments in my view. This might happen with gold close to $1,475, but it’s too early to say with certainty at this time. In other words, the entire decline could take between 1 and 12 weeks, while silver declines occuring particularly fast in the final 1-2 weeks.
- If gold declines even below $1,500 (say, to ~$1350 or so), then it could take another 10 weeks or so for it to bottom, but this is not what I view as a very likely outcome.
- As a confirmation for the above, I will use the (upcoming or perhaps we have already seen it?) top in the general stock market as the starting point for the three-month countdown. The reason is that after the 1929 top, gold miners declined for about three months after the general stock market started to slide. We also saw some confirmations of this theory based on the analogy to 2008. All in all, the precious metals sector would be likely to bottom about three months after the general stock market tops . If the mid-February 2020 top was the final medium-term top (based on NASDAQ’s top, then it seems that we might expect the precious metals sector to bottom in mid-May or close to May’s end. If, however, the mid-March 2021 top was the final medium-term top (based on the S&P 500), then we might expect the precious metals sector to bottom in mid-June or close to June’s end.
- The above is based on the information available today and it might change in the following days/weeks.
Letters to the Editor
Q: What’s the stop-loss for gold and silver futures for the short positions?
A: We don’t have stop-loss levels for positions in gold and silver. In fact, we don’t have positions in gold and silver at all. We’re providing this information for those who can’t or don’t want to participate in the short position in the junior mining stocks (GDXJ or it’s leveraged counterpart), but prefer gold or silver instead.
Either way, just as I don’t have a single price level that would automatically invalidate the short position in the mining stocks, I don’t have one for gold or silver. The situation is too complex for a single price move to invalidate it. Stop-loss orders are critical for immediate-term trading (like day trading), but that’s not what I engage in. It’s much more likely that the relative performance of one market compared to another (gold vs. USD, silver vs. gold, miners vs. gold) would make me close or adjust the trade than it is likely based on a certain price level being reached.
Q: Question for PR: I may be confused. Could you please direct me to info, or briefly explain the scenario in which the GDXJ potentially reaches the target price quoted below.
Trading capital (supplementary part of the portfolio; our opinion): Full speculative short positions (300% of the full position) in mining stocks are justified from the risk to reward point of view with the following binding exit profit-take price levels:
Mining stocks (price levels for the GDXJ ETF): binding profit-take exit price: $24.12; stop-loss: none (the volatility is too big to justify a stop-loss order in the case of this particular trade)
A: In general, I’m outlining this scenario in the “Overview of the Upcoming Part of the Decline” section just above this one. In short, in this scenario the USD Index soars, gold slides to $1,500 or below it, while the general stock market slides as well (yes, stocks can really plunge, even though they seem to be able to only go up based on what happened in the previous months). It was exactly this combination that triggered a massive slide in the mining stocks in March 2020.
It seems that the lack of declines in stocks is the factor that makes the mining stocks decline only “normally”. Once the general stock market finally slides, I expect mining stocks (and then, a bit later, silver) to slide very significantly, not “normally”. In my view the stock market is forming a major, long-term top here, and such tops can take quite some time to form – at least in the case of stocks (gold and silver tend to have spike-shaped tops). Being close to 4000, it might be the case that the S&P 500 index will start to slide once it reaches (or almost reaches) this round level. Round levels tend to be important psychologically, so it might be (but doesn’t have to be) the trigger for stocks’ big decline that would in turn greatly accelerate miners’ decline. Please note that the March 2020 slide started after the S&P 500 almost reached the round level of 3400 (the intraday high was 3397.50).
Also, please keep in mind that it’s quite likely that we’re going to take profits and close the positions in mining stocks even before the above-mentioned target is reached, in order to quickly open them in silver, as the white metal tends to decline the most during the final part of the decline. We saw this on many occasions, most notably in March 2020.
Q: Your reports are helping me to better understand the markets, and in particular, the precious metals market. I appreciate your analysis and I congratulate you on your clairvoyance. At this time, I would like to ask you a question, which is the one that worries me the most in the development of the bear market and that is the huge injection of 4 trillion dollars by the U.S. government. How do you think it can affect the dollar ... and rebound the price of gold and silver?
Thank you and warm greetings.
A: Thank you, I’m very happy to hear that you enjoy reading my analyses and find them valuable and helpful.
In reply to your question, I think that the huge injections of the USD into the economy are already “in the price”, meaning that the market had already taken them into account while determining the prices, and thus, as things progress with regard to implementation of the various stimulus plans, the markets might not be affected. It is said that only the “unexpected” actions move the markets. The reason is that the markets are forward-looking – if it’s clear that something is going to move the market up, then it makes sense for everyone to buy right away in order to profit from it. And thus, everyone would indeed buy and the price would already move higher – without waiting for this “something” to happen.
All in all, this massive money printing is very bullish for gold in the long run, but I don’t think that it will prevent gold from the declining in the next weeks – months.
Summary
To summarize, the PMs’ medium-term decline is well underway, and based on the recent performance of the USD Index, gold and mining stocks, it seems that the corrective upswing is already over (or about to be over). The next big move lower seems to be already underway or about to start.
In addition, because we’re likely entering the “winter” part of the Kondratiev cycle (just like in 1929 and then the 1930s), the outlook for the precious metals’ sector remains particularly bearish during the very first part of the cycle, when cash is king.
The confirmed breakout in the USD Index is yet another confirmation of the bearish outlook for the precious metals market.
After the sell-off (that takes gold to about $1,450 - $1,500), we expect the precious metals to rally significantly. The final part of the decline might take as little as 1-5 weeks, so it's important to stay alert to any changes.
Most importantly, please stay healthy and safe. We made a lot of money last March and it seems that we’re about to make much more on this March decline, but you have to be healthy to enjoy the results.
As always, we'll keep you - our subscribers - informed.
On an administrative note: the markets are closed tomorrow (Good Friday), so there is no regular Gold & Silver Trading Alert scheduled for this day. Moreover, due to our Easter Holiday schedule, there will also be no regular Gold & Silver Trading Alert posted on Monday. The next regular Gold & Silver Trading Alert (the flagship issue) will be posted on Tuesday, April 6, 2021. However, just because there will be no regular Alerts posted until Tuesday, it doesn’t mean that I’m stopping monitoring the markets. I’m not – if anything major happens in the meantime (I don’t expect anything major to happen tomorrow, but it’s unclear what happens on Monday), I will keep you updated through the quick intraday Alerts, anyway.
By the way, we’re currently providing you with a possibility to extend your subscription by a year, two years or even three years with a special 20% discount. This discount can be applied right away, without the need to wait for your next renewal – if you choose to secure your premium access and complete the payment upfront. The boring time in the PMs is definitely over and the time to pay close attention to the market is here. Naturally, it’s your capital, and the choice is up to you, but it seems that it might be a good idea to secure more premium access now, while saving 20% at the same time. Our support team will be happy to assist you in the above-described upgrade at preferential terms – if you’d like to proceed, please contact us.
To summarize:
Trading capital (supplementary part of the portfolio; our opinion): Full speculative short positions (300% of the full position) in mining stocks are justified from the risk to reward point of view with the following binding exit profit-take price levels:
Mining stocks (price levels for the GDXJ ETF): binding profit-take exit price: $24.12; stop-loss: none (the volatility is too big to justify a stop-loss order in case of this particular trade)
Alternatively, if one seeks leverage, we’re providing the binding profit-take levels for the JDST (2x leveraged) and GDXD (3x leveraged – which is not suggested for most traders/investors due to the significant leverage). The binding profit-take level for the JDST: $39.87; stop-loss for the JDST: none (the volatility is too big to justify a SL order in case of this particular trade); binding profit-take level for the GDXD: $94.87; stop-loss for the GDXD: none (the volatility is too big to justify a SL order in case of this particular trade).
For-your-information targets (our opinion; we continue to think that mining stocks are the preferred way of taking advantage of the upcoming price move, but if for whatever reason one wants / has to use silver or gold for this trade, we are providing the details anyway.):
Silver futures upside profit-take exit price: unclear at this time - initially, it might be a good idea to exit, when gold moves to $1,512.
Gold futures upside profit-take exit price: $1,512.
Long-term capital (core part of the portfolio; our opinion): No positions (in other words: cash
Insurance capital (core part of the portfolio; our opinion): Full position
Whether you already subscribed or not, we encourage you to find out how to make the most of our alerts and read our replies to the most common alert-and-gold-trading-related-questions.
Please note that we describe the situation for the day that the alert is posted in the trading section. In other words, if we are writing about a speculative position, it means that it is up-to-date on the day it was posted. We are also featuring the initial target prices to decide whether keeping a position on a given day is in tune with your approach (some moves are too small for medium-term traders, and some might appear too big for day-traders).
Additionally, you might want to read why our stop-loss orders are usually relatively far from the current price.
Please note that a full position doesn't mean using all of the capital for a given trade. You will find details on our thoughts on gold portfolio structuring in the Key Insights section on our website.
As a reminder - "initial target price" means exactly that - an "initial" one. It's not a price level at which we suggest closing positions. If this becomes the case (like it did in the previous trade), we will refer to these levels as levels of exit orders (exactly as we've done previously). Stop-loss levels, however, are naturally not "initial", but something that, in our opinion, might be entered as an order.
Since it is impossible to synchronize target prices and stop-loss levels for all the ETFs and ETNs with the main markets that we provide these levels for (gold, silver and mining stocks - the GDX ETF), the stop-loss levels and target prices for other ETNs and ETF (among other: UGL, GLL, AGQ, ZSL, NUGT, DUST, JNUG, JDST) are provided as supplementary, and not as "final". This means that if a stop-loss or a target level is reached for any of the "additional instruments" (GLL for instance), but not for the "main instrument" (gold in this case), we will view positions in both gold and GLL as still open and the stop-loss for GLL would have to be moved lower. On the other hand, if gold moves to a stop-loss level but GLL doesn't, then we will view both positions (in gold and GLL) as closed. In other words, since it's not possible to be 100% certain that each related instrument moves to a given level when the underlying instrument does, we can't provide levels that would be binding. The levels that we do provide are our best estimate of the levels that will correspond to the levels in the underlying assets, but it will be the underlying assets that one will need to focus on regarding the signs pointing to closing a given position or keeping it open. We might adjust the levels in the "additional instruments" without adjusting the levels in the "main instruments", which will simply mean that we have improved our estimation of these levels, not that we changed our outlook on the markets. We are already working on a tool that would update these levels daily for the most popular ETFs, ETNs and individual mining stocks.
Our preferred ways to invest in and to trade gold along with the reasoning can be found in the how to buy gold section. Furthermore, our preferred ETFs and ETNs can be found in our Gold & Silver ETF Ranking.
As a reminder, Gold & Silver Trading Alerts are posted before or on each trading day (we usually post them before the opening bell, but we don't promise doing that each day). If there's anything urgent, we will send you an additional small alert before posting the main one.
Thank you.
Przemyslaw Radomski, CFA
Founder, Editor-in-chief

