

Briefly: in our opinion, full (300% of the regular position size) speculative short positions in mining stocks are justified from the risk/reward point of view at the moment of publishing this Alert.
Not much happened yesterday (Jan. 21), but what happened was relatively informative. And by “relatively” I mean literally that. Gold moved lower yesterday and in today’s pre-market trading, doing so despite another small move lower in the USD Index. The moves are not big, but they are meaningful. They show that gold’s inauguration-day rally was likely a temporary blip on the radar screen instead of being a game-changer.
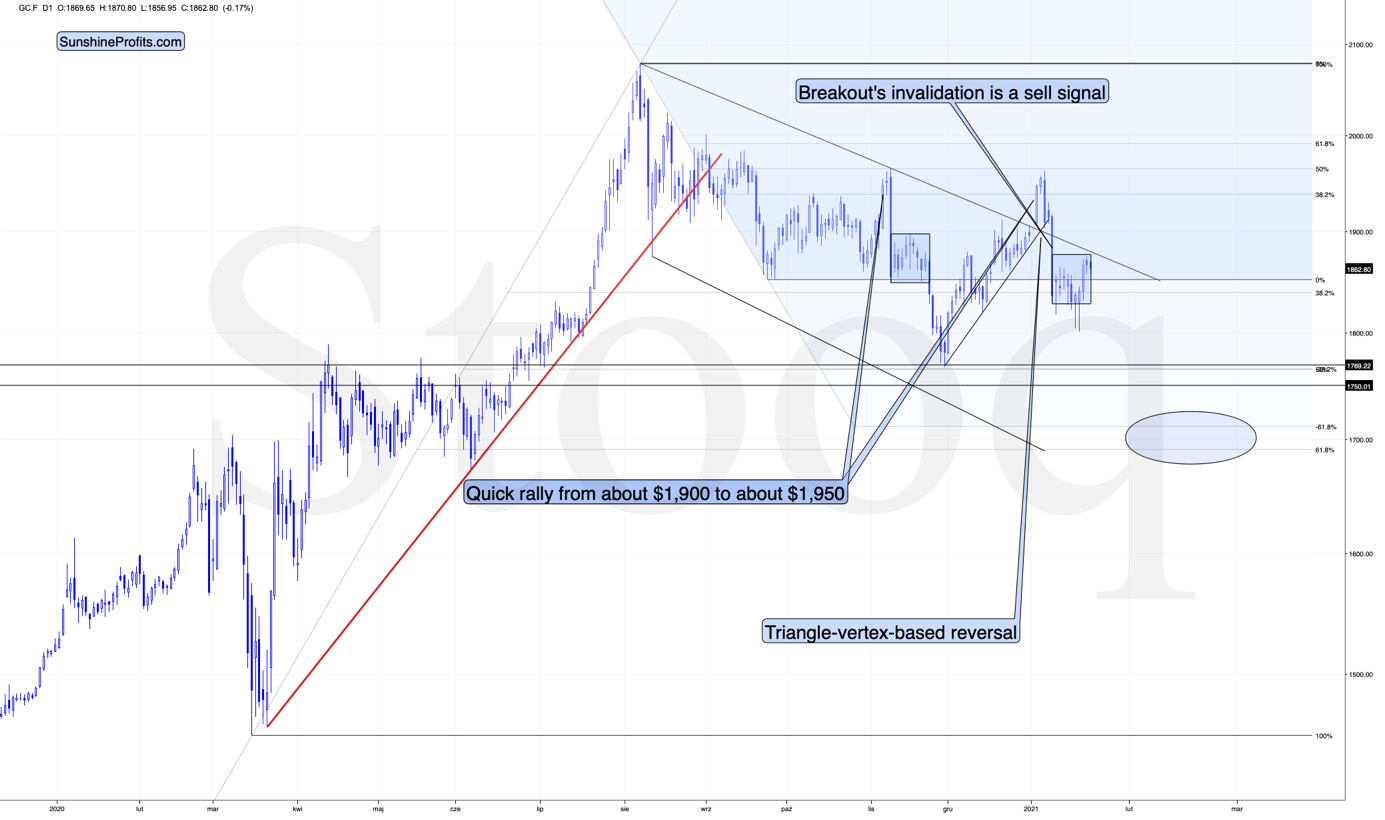
Figure 1 – COMEX Gold Futures
In yesterday’s analysis, I commented on the gold chart in the following way:
Looking at the above chart, I marked the November consolidation with a blue rectangle, and I copied it to the current situation, based on the end of the huge daily downswing. Gold moved briefly below it in recent days, after which it rallied back up, and right now it’s very close to the upper right corner of the rectangle.
This means that the current situation remains very similar to what we saw back in November, right before another slide started – and this second slide was bigger than the first one. Consequently, there’s a good reason for gold to reverse any day (or hour) now.
Besides, there’s also a declining resistance line just around the corner.
And that’s not even the most important thing. The most important thing is that based on the similarity to how things developed between 2011 and 2013, gold’s downward trajectory is likely to have periodic corrections at this time – up to a point where it simply plunges.
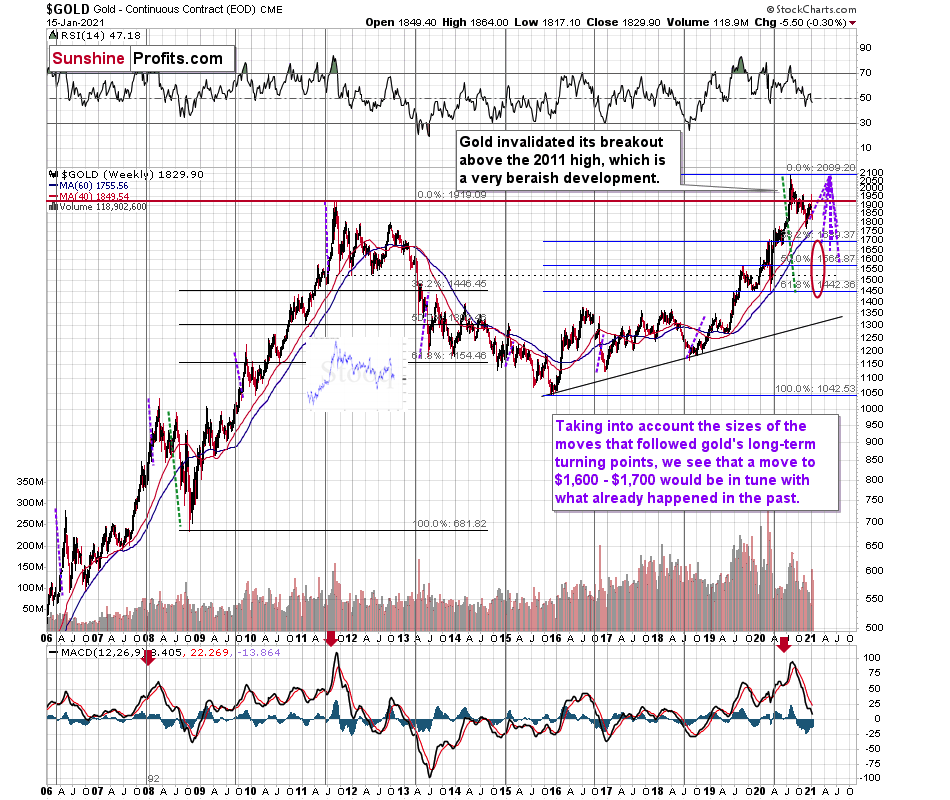
Figure 2 - GOLD Continuous Contract (EOD)
When the current situation is compared to what we saw about a decade ago, it shows what one should expect, assuming that the history repeats itself.
Gold kept on declining with corrections along the way until April. In April, the decline accelerated profoundly. The biggest problem with the latter was that practically nobody expected this kind of volatility. Those who were thinking that it’s just another move lower that will be reversed were very surprised.
Right now, you know in advance that a bigger move lower is likely just around the corner, and you won’t be surprised when it comes. Whether we have to wait an additional few days or first see gold rally by $10 or $30 is not that important, if it’s about to slide $150 and then another $200 or so.
The above remains up-to-date. The thing that I would like to add is that gold is declining today and based on the similarity to the November consolidation, it’s exactly the day when we should expect to see a decline. Of course, the similarity doesn’t have to persist, and the history doesn’t have to repeat itself to the letter, but what’s happening right now seems to be confirming the analogy in a considerable way. This means that more declines are likely just around the corner. If not immediately, then shortly.
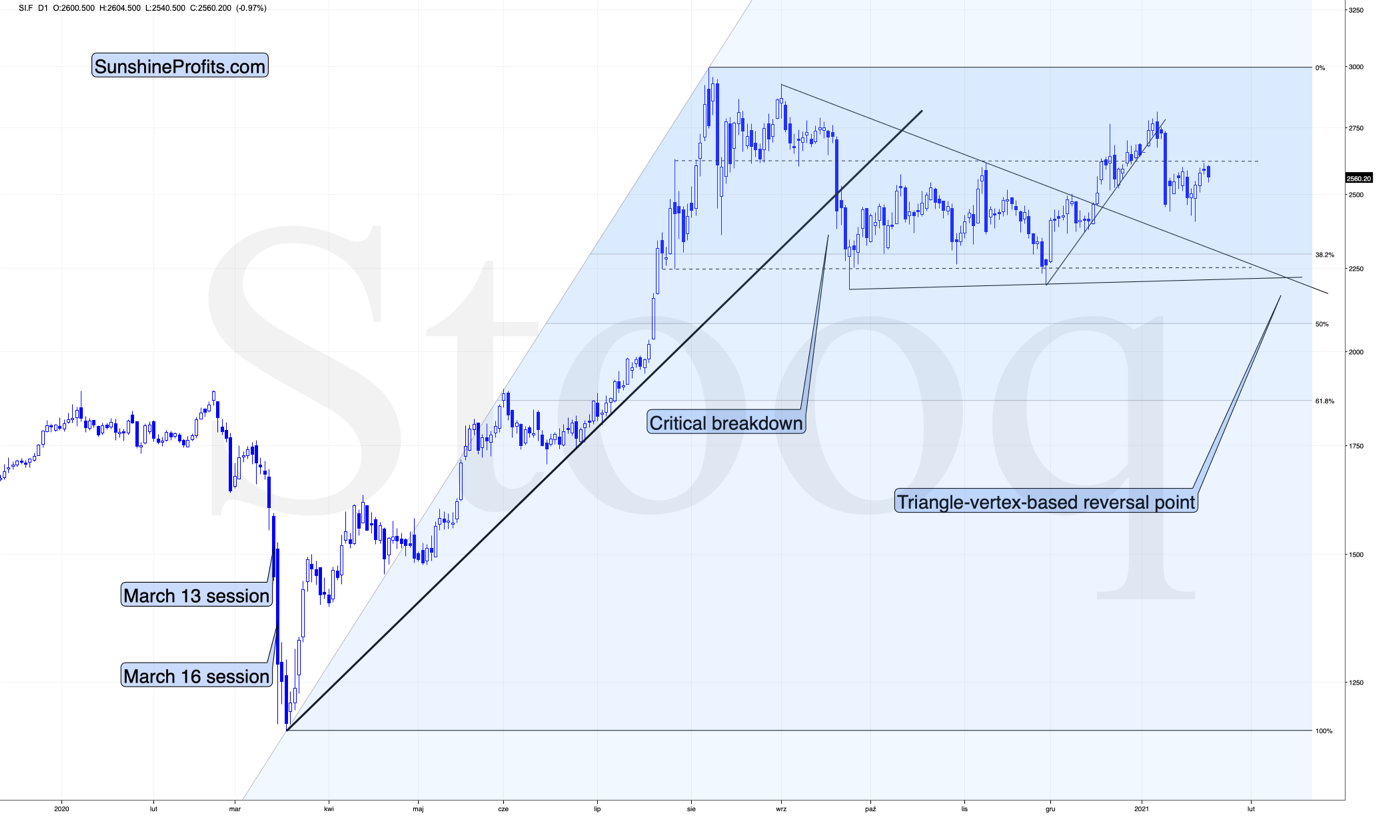
Figure 3 - COMEX Silver Futures
Silver turned south after reaching (approximately) the price level that stopped the rally in July and November 2020, and also earlier this year. This seems relatively natural and the outlook for silver remains bearish for the next several weeks. My previous comments on the white metal remain up-to-date:
Silver corrected a bit more of this year’s downswing than gold, which is normal given the bearish outlook. The same goes for miners’ underperformance. Let’s keep in mind that silver’s “strength” is temporary – once the decline really starts, and it moves to its final part, silver is likely to catch up big time.
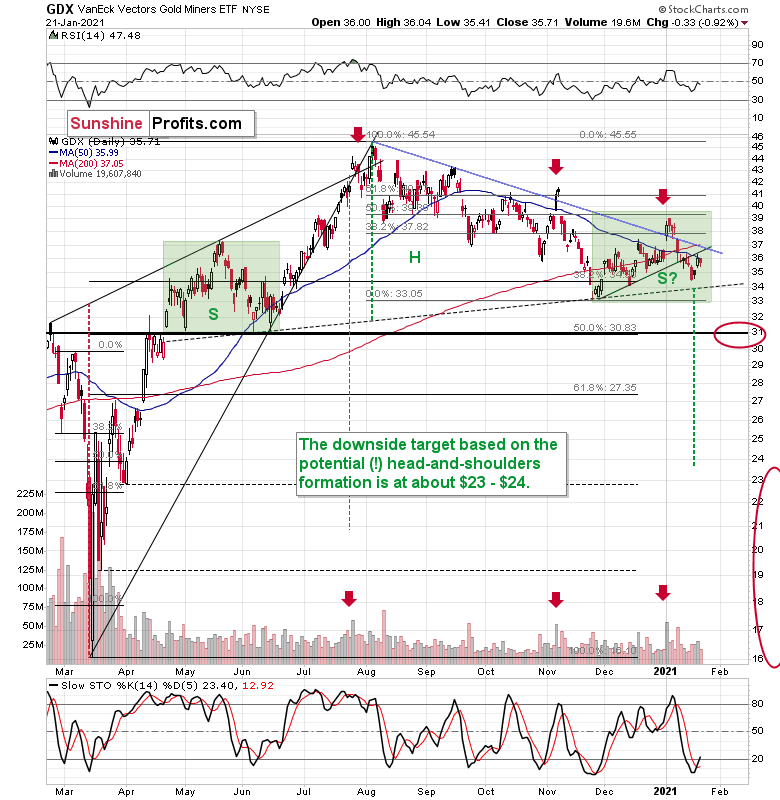
Figure 4 - VanEck Vectors Gold Miners ETF
Since miners moved a bit lower, my previous comments on them also remain up-to-date:
Mining stocks didn’t correct half of their 2021 decline. They didn’t invalidate the breakdown below the rising support line, either. In fact, the GDX ETF closed yesterday’s session below the 50-day moving average. Technically, nothing changed yesterday.
Please note that the November – today consolidation is quite similar to the consolidation that we saw between April and June (see Figure 4 - green rectangles). Both shoulders of the head-and-shoulder formation can be identical, but they don’t have to be, so it’s not that the current consolidation has to end at the right border of the current rectangle. However, the fact that the price is already close to this right border tells us that it would be very normal for the consolidation to end any day now – most likely before the end of January.
If we see a rally to $37, or even $38, it won’t change much – the outlook will remain intact anyway and the right shoulder of the potential head-and-shoulders formation will remain similar to the left shoulder.
However, does the GDX have to first rally to $37 or $38 to decline? Absolutely not. It could turn south right away, thus surprising most market participants.
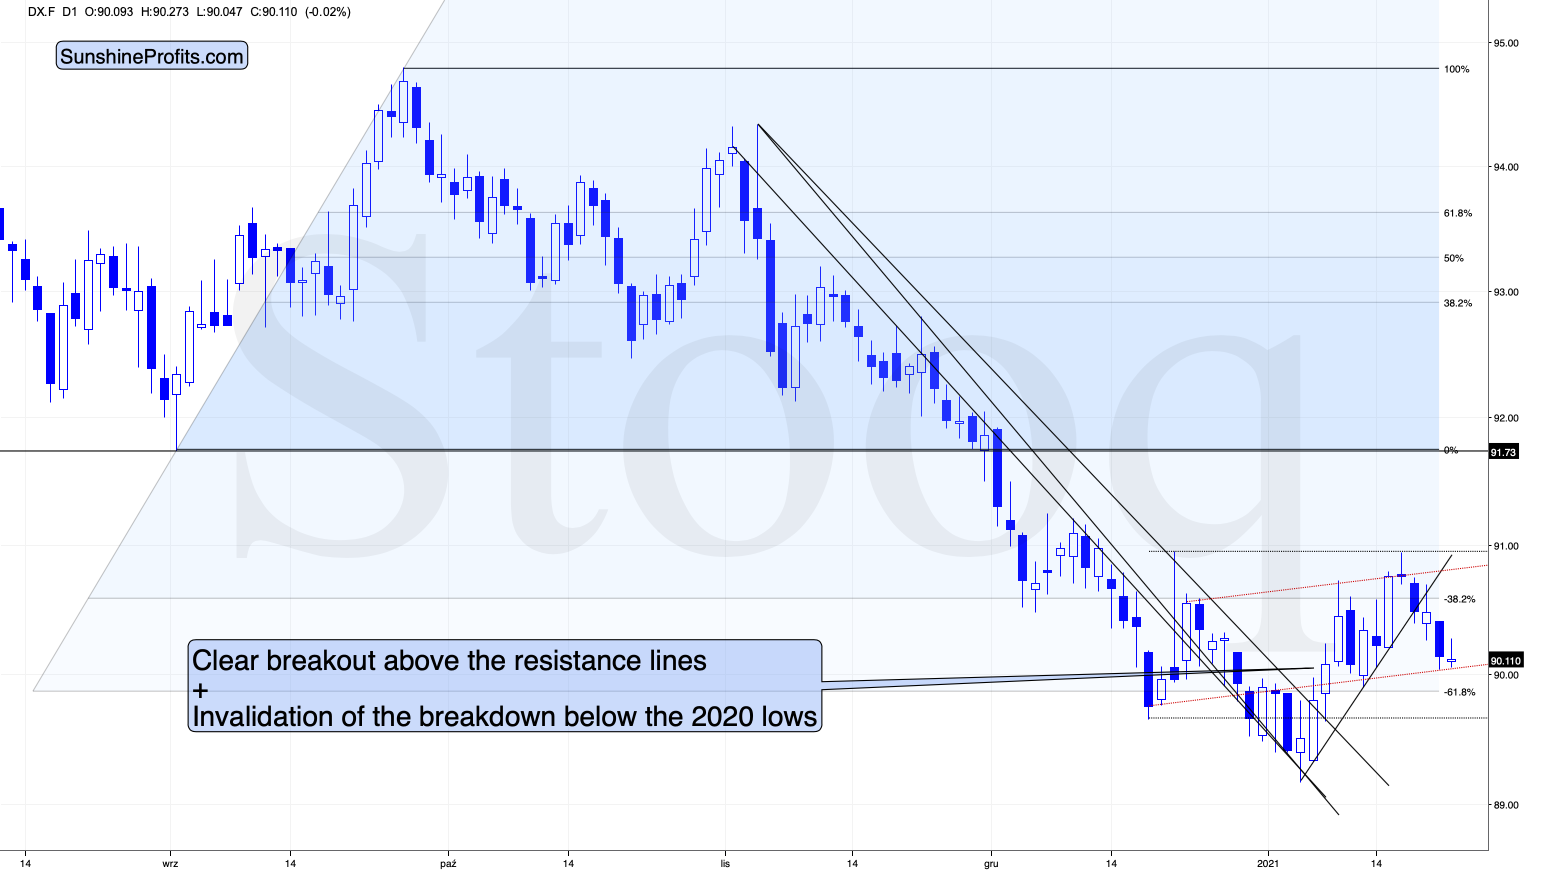
Figure 5 – USD Index
In Tuesday’s (Jan. 19) analysis, I commented on the above USD Index chart in the following way:
The USD Index is after a major breakout above the declining resistance lines and this breakout was confirmed. Consequently, the USD Index is likely to rally, but is it likely to rally shortly? The answer to this question is being clarified at the moment of writing these words, because the USD Index moved back to its rising short-term support line that’s based on the 2021 bottoms.
If the USD Index breaks below it, traders will view the 2021 rally as a zigzag corrective pattern and will probably sell the U.S. currency, causing it to decline, perhaps to the mid-January low or even triggering a re-test of the 2021 low.
If the USD Index performs well at this time and rallies back up after touching the support line, and then moves to new yearly highs, it will be then that traders realize that it was definitely not just a zigzag correction, but actually the major bottom. In the previous scenario, they would also realize that, but later, after an additional short-term decline.
Yesterday, I added:
It’s now clear that the former scenario is being realized. The support levels that could trigger the USD’s reversal are based on the potential inverse head-and-shoulders pattern – the red line that’s slightly above 90, and the horizontal line that’s slightly below it. It’s also possible that the USD Index tests it yearly lows. None of the above would be likely to change the outlook for the precious metals sector, at least not beyond the immediate term.
Later yesterday and also in today’s overnight trading, the USD Index moved to the upper of the above-mentioned support lines. Is the bottom already in? This seems likely, but it’s not crystal-clear yet. However, it doesn’t really matter, because the precious metals market responded to the USD’s strength for just one day (in a meaningful way that is), and taking a closer look at that day reveals that it was not the USDX’s performance that gold reacted to, but to the underlying news – the inauguration-day-based uncertainty. So, even if the USD Index declines some more here before soaring, gold doesn’t have to move significantly higher. In fact, it would be unlikely to do so.
Yesterday, I wrote that stocks rallied, and based on this rally, the weekly RSI moved close to 70 once again.
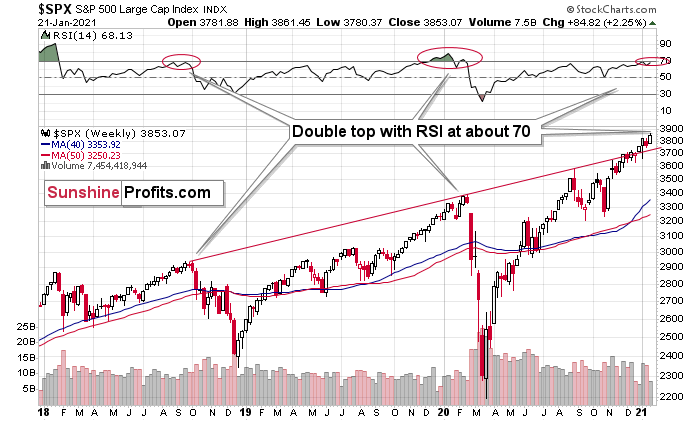
Figure 6 – S&P 500 Index
In particular, I wrote the following:
This is important because the last two major declines were preceded by this very signal. We saw the double-top in the RSI at about 70, exactly when the stock market started its big declines, and we’re seeing the same thing right now. If this was the only thing pointing to much lower stock values on the horizon, I would say that the situation is not so critical, but that’s not the only thing – far from it. Before moving to these non-technical details, let’s recall why the stock market analysis and the USD index analysis matters for precious metals investors and traders.
The analyses matter because gold, silver, and mining stocks are likely to decline in parallel with a decline in stocks and the USD’s rally. This is likely to take place up to a certain point, when precious metals show strength and refuse to decline further despite the stock market continuing to fall and the USDX continuing to rally. This kind of performance happened many times, including in the first half of last year.
The above remains up-to-date, and since the S&P 500 futures are down in the overnight trading, perhaps we have indeed seen a top. Even if not, it doesn’t seem that one is very far, based on how excessive the situation looks from the fundamental point of view. Let’s discuss some of those non-technical issues.
Mind Over Matter
Despite Janet Yellen’s assertion that “the United States does not seek a weaker currency,” I mentioned yesterday that her tongue-in-cheek comments are actually doing just that. The newly minted U.S. Treasury secretary urged lawmakers to “act big” with regard to prospective stimulus, saying that the benefits “far outweigh the costs.”
And since her worst-kept secret became public on Jan. 18, the USD Index has been under fire ever since. Furthermore, as her words instill the EUR/USD with borrowed confidence, the precious metals are displaying the same bold behavior.
Please see below:
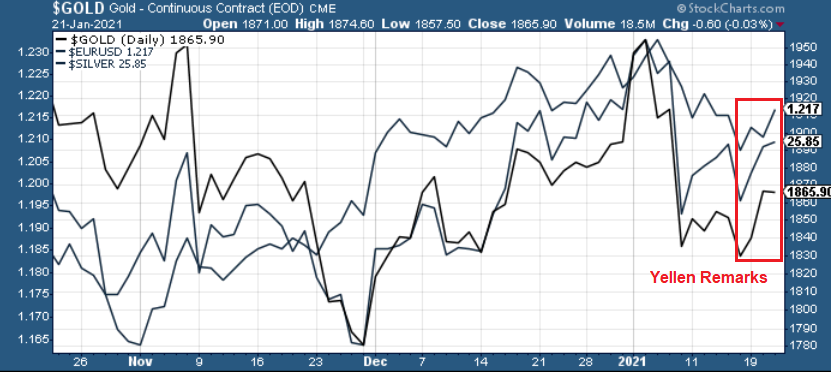
Figure 7
However, despite the narrative overpowering reality, the Eurozone fundamentals don’t support the recent rally. And why is this important? Because as you can see from the chart above, as goes the EUR/USD, so go the PMs.
Yesterday, European Central Bank (ECB) President Christine Lagarde revealed that the Eurozone economy likely shrank in the fourth quarter – all but sealing a double-dip recession.
Please see below:
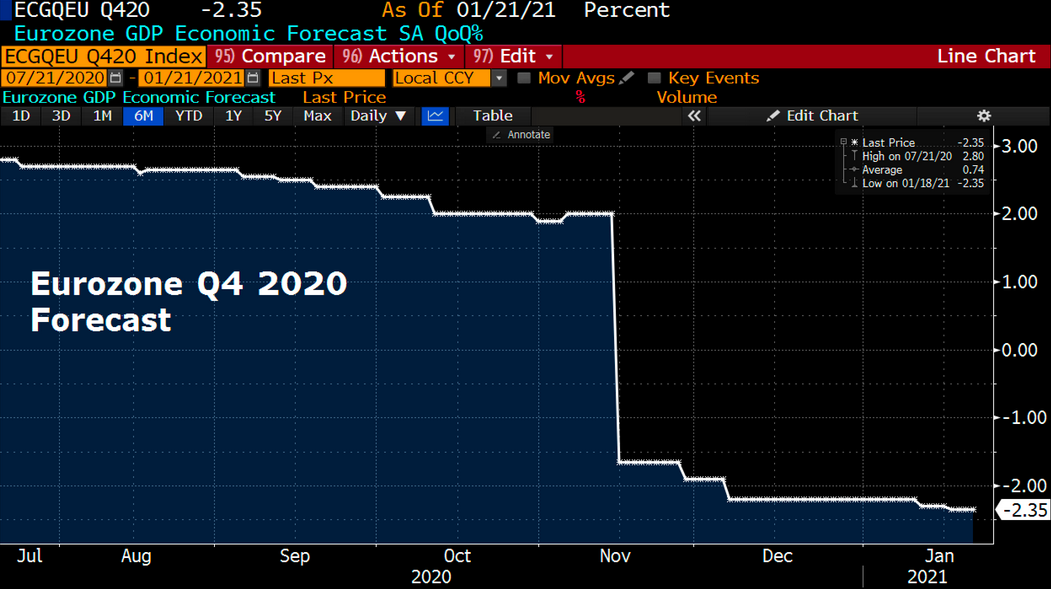
Figure 8 – (Source: Bloomberg/ Holger Zschaepitz)
In contrast, the Federal Reserve Bank of Atlanta’s GDPNow forecasting model (as of Jan. 21) has the U.S. economy expanding by 7.5% in Q4. Furthermore, even if we take the Atlanta Fed’s estimate with a grain of salt, the Blue Chip consensus (forecasts made by private-sector economists) is for growth of nearly 4.0% (tallied as of early January). And even more telling, economists with a bottom 10% Q4 GDP forecast (see Figure 9 - the shaded light blue area below) still expect positive growth.
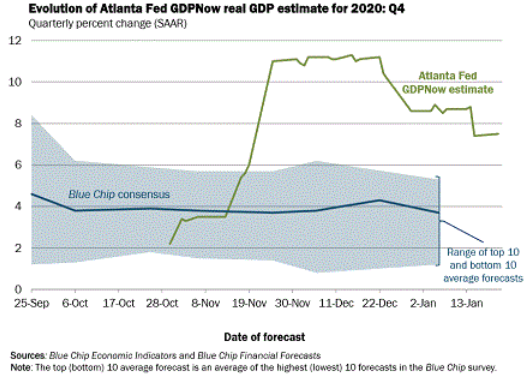
Figure 9
The bottom line?
We can now add the Eurozone GDP to the long list of relative underperformances.
Expanding on the above, European consumer confidence (released yesterday) went backwards again in January and is now less than 10 points above its April low. Furthermore, the current reading is still well-below the long-term average.
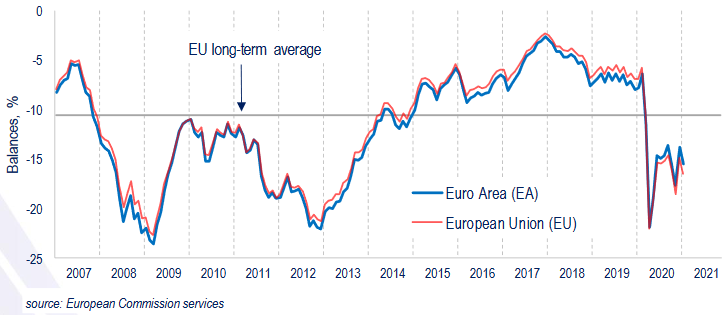
Figure 10
On Jan. 8, I highlighted the significant divergence between European CPI and U.S. CPI (inflation). For context, European CPI was – 0.30% in December (negative for five-straight months), while U.S. CPI was 0.40% in December (positive for seven-straight months).
I wrote:
Weak CPI is a precursor to a weaker euro. Why so? Because since asset purchases fail to produce any real economic growth, the ECB will be forced to lower interest rates to stimulate the economy. As a result, the cocktail of paltry economic activity and lower bond yields leads to capital outflows as foreign (and domestic) investors reallocate money to other geographies (like the U.S.). Thus, capital will likely exit the Eurozone and lead to a lower EUR/USD.
And today?
Well, it’s exactly what the ECB is doing.
Due to the economic malaise confronting Europe, the ECB is targeting its bond-buying activity toward financially weaker counties (like Italy) as opposed to financially stronger countries (like Germany). Essentially, it’s conducting a shadow operation of yield curve control (YCC).
Please see below:
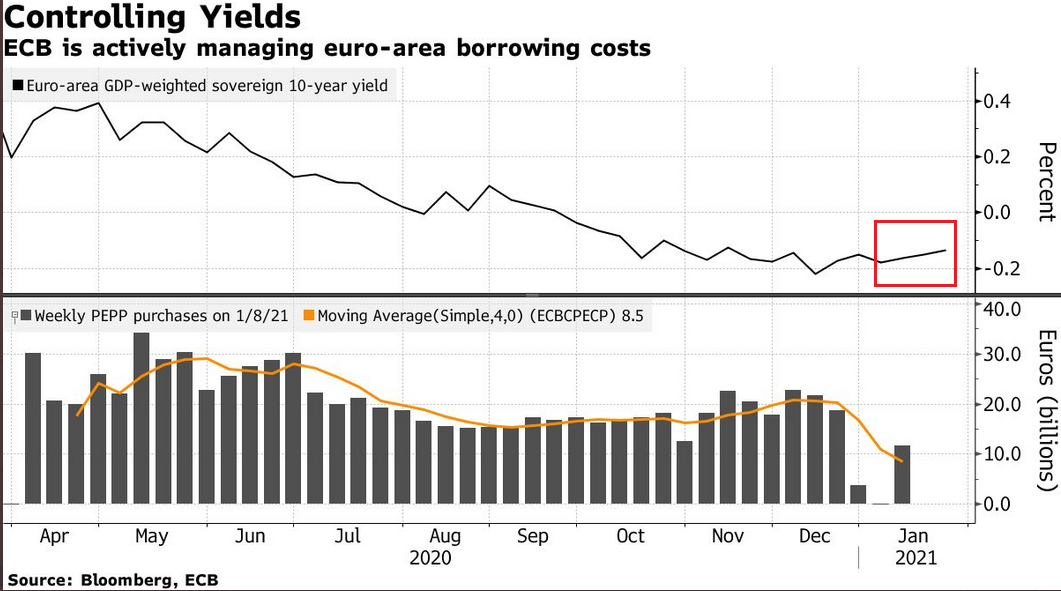
Figure 11
If you analyze the red box above, you can see that Europe’s weighted-average bond yield has increased in 2021. And why is this happening? Because as Europe’s economic deterioration merges with Italy’s fiscal plight, this cocktail has made European bonds riskier, and thus, investors demand a higher interest rate. And while higher interest rates are bullish for a country’s currency when they’re a function of economic growth, a crisis-like spike in yields (due to solvency concerns) means the exact opposite.
Furthermore, if you follow the gray bars at the bottom-half of the chart, the ECB actually decreased its bond purchases toward the end of December (2020), Then, once January hit (2021), it was back to business as usual.
As a result, the ECB’s attempt to scale back its asset purchases was (and will be) short-lived. And as the economic conditions worsen, the money printer will be working overtime for the foreseeable future.
To that point, Bloomberg Economics expects the ECB to purchase €15 billion worth of bonds per week until 2022 – more than doubling its pandemic emergency purchase program (PEPP) to nearly €1.85 trillion.
Please see below:
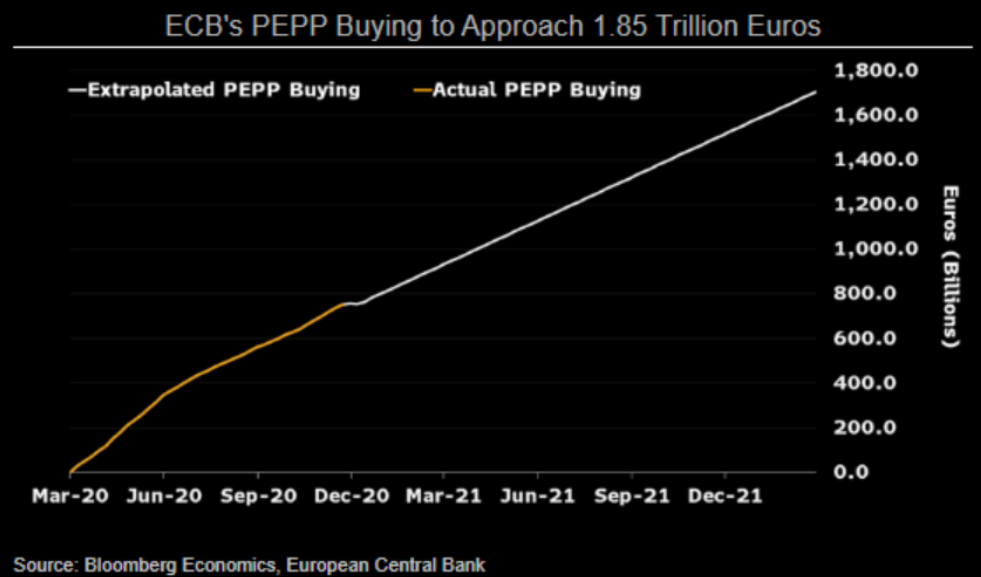
Figure 12
And in real-time?
Well, the ECB’s balance sheet hit another record-high on Friday (Jan. 15) – with total holdings still at 69% of Eurozone GDP (nearly double the U.S. Fed’s 35%).
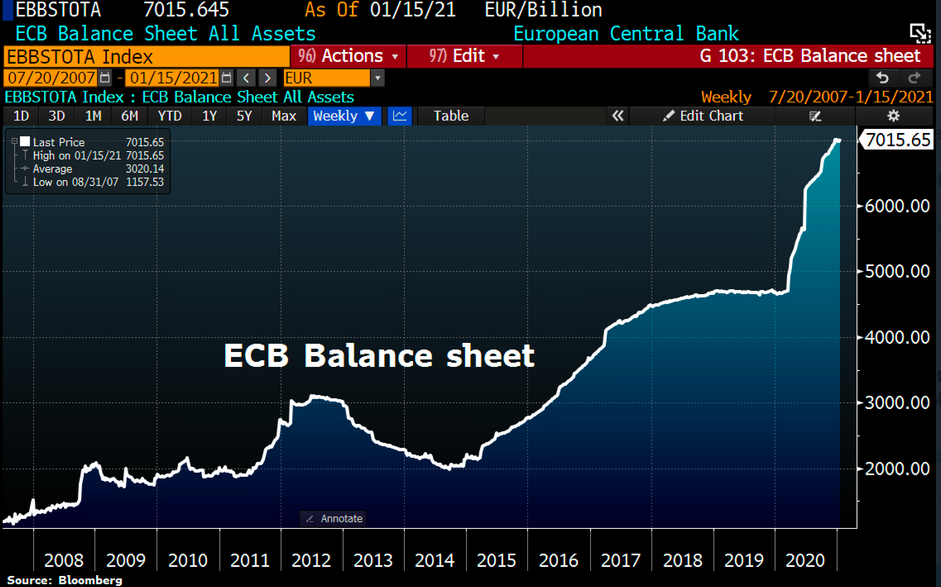
Figure 13
And why does all of this matter?
Because, as I highlighted on Jan. 12, the ECB’s relative outprinting is a precursor to a lower EUR/USD.
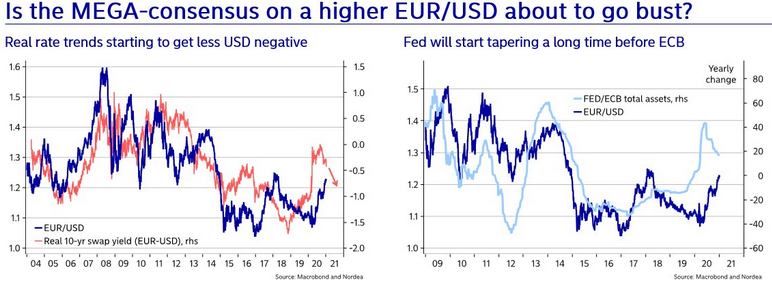
Figure 14
I wrote:
Turning to the second chart (Figure 6 - on the right), notice how the EUR/USD tracks the FED/ECB ratio? To explain, the ratio (the light blue line) is calculated by dividing the U.S. Federal Reserve’s (FED) balance sheet by the European Central Bank’s (ECB) balance sheet. Essentially, its direction tells you which monetary authority is printing more money. If you analyze the EUR/USD (the dark blue line), it trades higher when the FED is out-printing the ECB (the light blue line is rising) and trades lower when the ECB is out-printing the FED (the light blue line is falling). The key takeaway? With the light blue line falling, it means that the ECB is outprinting the FED. And if this dynamic continues, the EUR/USD (the dark blue line) should move lower as well.
The top in the FED/ECB total assets ratio preceded the slide in the EUR/USD less than a decade ago and it seems to be preceding the next slide as well. If the USD Index was to repeat its 2014-2015 rally from the recent lows, it would rally to 114. This level is much more realistic than most market participants would agree on.
In conclusion, the EUR/USD’s recent strength is built on a foundation of sand. Instead of following the hard data, traders are letting the narrative cloud their judgment. Moreover, due to their strong correlation with the EUR/USD, gold and silver are falling into the same trap. However, once the semblance of strength evaporates, a decline in the EUR/USD is likely to usher a move lower for the PMs. Furthermore, with gold already approaching the upper trendline of its November consolidation channel (which I highlighted yesterday), the momentum may wane sooner rather than later.
Letters to the Editor
Q: Is Goldman Sachs just talking fake news? They have been shorting the dollar and winning. Your suggestions are just the opposite? If the dollar collapses, we lose on our bets based on a rally in the dollar.
Thoughts?
A: Will Goldman Sachs always be correct about all the markets? No. Will I? No. Will anyone else? “No” once again. Each analyst or group of analysts has their own methodologies and the markets that they focus on. My approach is to analyze much more than what my core focus is and check how the markets relate to each other. This helps me to be more correct about the key market even if I’m not correct about the other markets or I’m correct, but late with being correct.
It’s true that the USD Index didn’t rally significantly yet, but did gold rally despite the USD’s decline in the second half of 2020? No. It declined since its August top, even invalidating its breakout above the 2011 high. The dollar has already collapsed, and yet gold still managed to decline. This is even more true with mining stocks, which have been weak for a long time and in the short run. Gold moved above its 2011 high and the HUI Index has managed to barely correct half of its decline from the analogous highs. And this is despite the stock market that’s been moving to new historical highs almost every other day.
So, it’s not true that a continuation of the decline in the USD Index would have to translate into major rallies in the mining stocks. It already failed to produce this kind of result in the last couple of months. And now – based on the technical and fundamental factors that I’ve been describing – the situation seems more critical than ever. It looks like gold, silver, and miners truly want to decline and are just waiting for the final “go” signal from the USD Index and (to some extent, especially in case of silver and miners) from the stock market. It’s likely that they are about to get it.
Overview of the Upcoming Part of the Decline
- I expect the initial bottom to form with gold falling to roughly $1,700, and I expect the GDX ETF to decline to about $31 - $32 at that time. I then plan to exit the short positions in the miners and I will consider long positions in the miners at that time – in order to benefit from the likely rebound.
I expect the above-mentioned decline to take another 1 – 6 weeks to materialize and I expect the rebound to take place during 1-3 weeks.
- After the rebound (perhaps to $33 - $34 in the GDX), I plan to get back in with the short position in the mining stocks.
- Then, after miners slide once again in a meaningful and volatile way, but silver doesn’t (and it just declines moderately), I plan to switch from short positions in miners to short positions in silver (this could take another 1-4 weeks to materialize). I plan to exit those positions when gold shows substantial strength relative to the USD Index, while the latter is still rallying. This might take place with gold close to $1,500 and the entire decline (from above $1,700 to about $1,500) would be likely to take place within 1-5 weeks and I would expect silver to fall hardest in the final part of the move.
Consequently, the entire decline could take between 3 and 14 weeks, while the initial part of the decline (to $1,700 in gold) is likely to take between 1 and 6 weeks.
The above is based on the information available today and it might change in the following days/weeks.
Summary
Summing up, while we might see the continuation of the counter-trend upswing for the next few days, the outlook for gold and the rest of the precious metals market remains bearish for at least the next few weeks.
After topping at its triangle-vertex-based reversal, gold moved sharply lower and it just invalidated the breakout above its declining resistance line, while breaking below the rising support line. All this happened as the USD Index rallied visibly above its declining resistance lines and invalidated the breakdown below the 2020 lows. This creates a strongly bearish combination for the precious metals market.
The USD Index and cryptocurrencies suggest that we’re seeing the repeat of early 2018, when the USD Index bottomed. Given the current correlations between PMs and the USD Index, the rally in the USDX is likely to have very bearish implications for the precious metals market.
Despite a recent decline, it seems that the USD Index is going to move higher in the following months and weeks, in turn causing gold to decline. At some point gold is likely to stop responding to dollar’s bearish indications, and based on the above analysis, it seems that this is already taking place.
Naturally, everyone's trading is their responsibility. But in our opinion, if there ever was a time to either enter a short position in the miners or increase its size if it was not already sizable, it's now. We made money on the March decline, and on the March rebound, with another massive slide already underway.
After the sell-off (that takes gold to about $1,500), we expect the precious metals to rally significantly. The final part of the decline might take as little as 1-5 weeks, so it's important to stay alert to any changes.
Most importantly, please stay healthy and safe. We made a lot of money on the March decline and the subsequent rebound (its initial part) price moves (and we'll likely earn much more in the following weeks and months), but you have to be healthy to enjoy the results.
As always, we'll keep you - our subscribers - informed.
To summarize:
Trading capital (supplementary part of the portfolio; our opinion): Full speculative short positions (300% of the full position) in mining stocks is justified from the risk to reward point of view with the following binding exit profit-take price levels:
Senior mining stocks (price levels for the GDX ETF): binding profit-take exit price: $32.02; stop-loss: none (the volatility is too big to justify a SL order in case of this particular trade); binding profit-take level for the DUST ETF: $28.73; stop-loss for the DUST ETF: none (the volatility is too big to justify a SL order in case of this particular trade)
Junior mining stocks (price levels for the GDXJ ETF): binding profit-take exit price: $42.72; stop-loss: none (the volatility is too big to justify a SL order in case of this particular trade); binding profit-take level for the JDST ETF: $21.22; stop-loss for the JDST ETF: none (the volatility is too big to justify a SL order in case of this particular trade)
For-your-information targets (our opinion; we continue to think that mining stocks are the preferred way of taking advantage of the upcoming price move, but if for whatever reason one wants / has to use silver or gold for this trade, we are providing the details anyway. In our view, silver has greater potential than gold does):
Silver futures downside profit-take exit price: unclear at this time - initially, it might be a good idea to exit, when gold moves to $1,703.
Gold futures downside profit-take exit price: $1,703
Long-term capital (core part of the portfolio; our opinion): No positions (in other words: cash
Insurance capital (core part of the portfolio; our opinion): Full position
Whether you already subscribed or not, we encourage you to find out how to make the most of our alerts and read our replies to the most common alert-and-gold-trading-related-questions.
Please note that we describe the situation for the day that the alert is posted in the trading section. In other words, if we are writing about a speculative position, it means that it is up-to-date on the day it was posted. We are also featuring the initial target prices to decide whether keeping a position on a given day is in tune with your approach (some moves are too small for medium-term traders, and some might appear too big for day-traders).
Additionally, you might want to read why our stop-loss orders are usually relatively far from the current price.
Please note that a full position doesn't mean using all of the capital for a given trade. You will find details on our thoughts on gold portfolio structuring in the Key Insights section on our website.
As a reminder - "initial target price" means exactly that - an "initial" one. It's not a price level at which we suggest closing positions. If this becomes the case (like it did in the previous trade), we will refer to these levels as levels of exit orders (exactly as we've done previously). Stop-loss levels, however, are naturally not "initial", but something that, in our opinion, might be entered as an order.
Since it is impossible to synchronize target prices and stop-loss levels for all the ETFs and ETNs with the main markets that we provide these levels for (gold, silver and mining stocks - the GDX ETF), the stop-loss levels and target prices for other ETNs and ETF (among other: UGL, GLL, AGQ, ZSL, NUGT, DUST, JNUG, JDST) are provided as supplementary, and not as "final". This means that if a stop-loss or a target level is reached for any of the "additional instruments" (GLL for instance), but not for the "main instrument" (gold in this case), we will view positions in both gold and GLL as still open and the stop-loss for GLL would have to be moved lower. On the other hand, if gold moves to a stop-loss level but GLL doesn't, then we will view both positions (in gold and GLL) as closed. In other words, since it's not possible to be 100% certain that each related instrument moves to a given level when the underlying instrument does, we can't provide levels that would be binding. The levels that we do provide are our best estimate of the levels that will correspond to the levels in the underlying assets, but it will be the underlying assets that one will need to focus on regarding the signs pointing to closing a given position or keeping it open. We might adjust the levels in the "additional instruments" without adjusting the levels in the "main instruments", which will simply mean that we have improved our estimation of these levels, not that we changed our outlook on the markets. We are already working on a tool that would update these levels daily for the most popular ETFs, ETNs and individual mining stocks.
Our preferred ways to invest in and to trade gold along with the reasoning can be found in the how to buy gold section. Furthermore, our preferred ETFs and ETNs can be found in our Gold & Silver ETF Ranking.
As a reminder, Gold & Silver Trading Alerts are posted before or on each trading day (we usually post them before the opening bell, but we don't promise doing that each day). If there's anything urgent, we will send you an additional small alert before posting the main one.
Thank you.
Przemyslaw Radomski, CFA
Founder, Editor-in-chief

