

Briefly: in our opinion, full (300% of the regular position size) speculative short positions in mining stocks are justified from the risk/reward point of view at the moment of publishing this Alert.
Welcome to this week's flagship Gold & Silver Trading Alert. As we promised you previously, in our flagship Alerts, we will be providing you with bigger, more complex analyses (approximately once per week) and it will usually take place on Monday.
Most of the things that we discussed in the previous flagship analysis didn't change. As it is the case usually, we will quote last week's comments while updating everything that needs to be updated or changed. In the end, the entire below analysis is up-to-date at the moment of publishing. The parts that we didn't change (or changed only insignificantly) since last week, will be put in italics.
The most important fundamental factor right now remains the Covid-19 pandemic and the serious economic implications. As far as the price changes are concerned, what matters the most is how the market views the data and news that hit it. Let's start with discussing the most recent fundamental development and then we'll move to discussing what happened and what does it imply for the next few weeks.
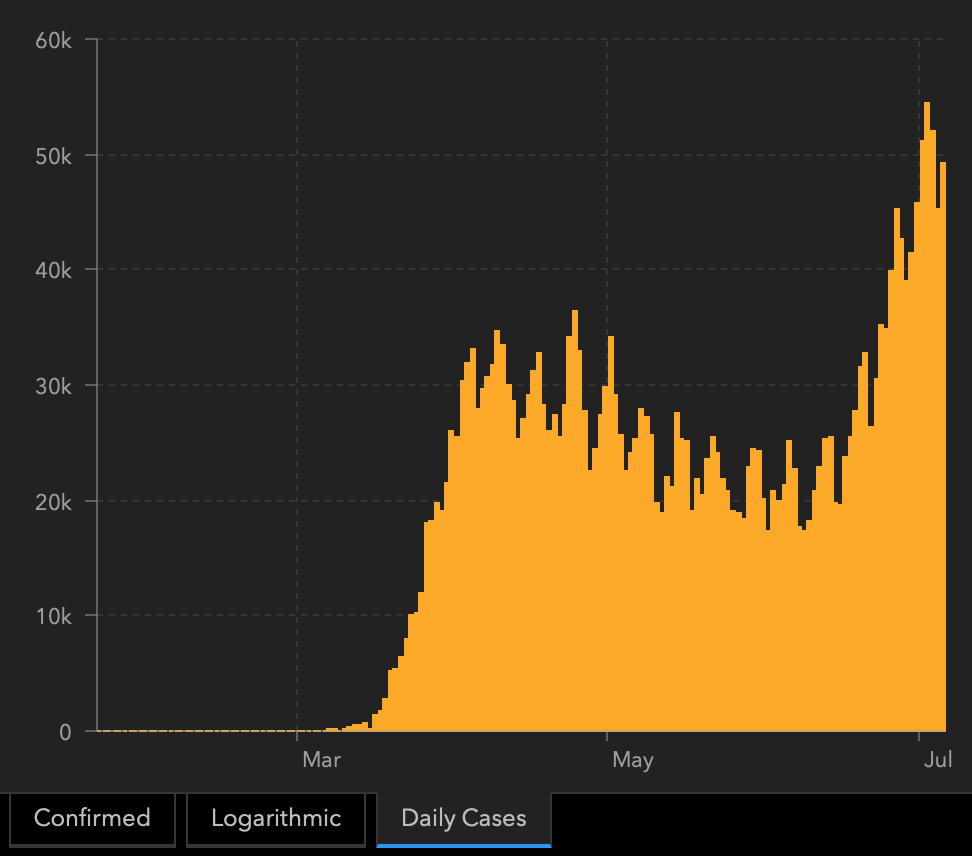
The new daily cases in the U.S. have already made new highs and the numbers indicate that it's a new strong uptrend, not a one-time event.
The global cases have been on the rise and there are very little signs of slowing down.
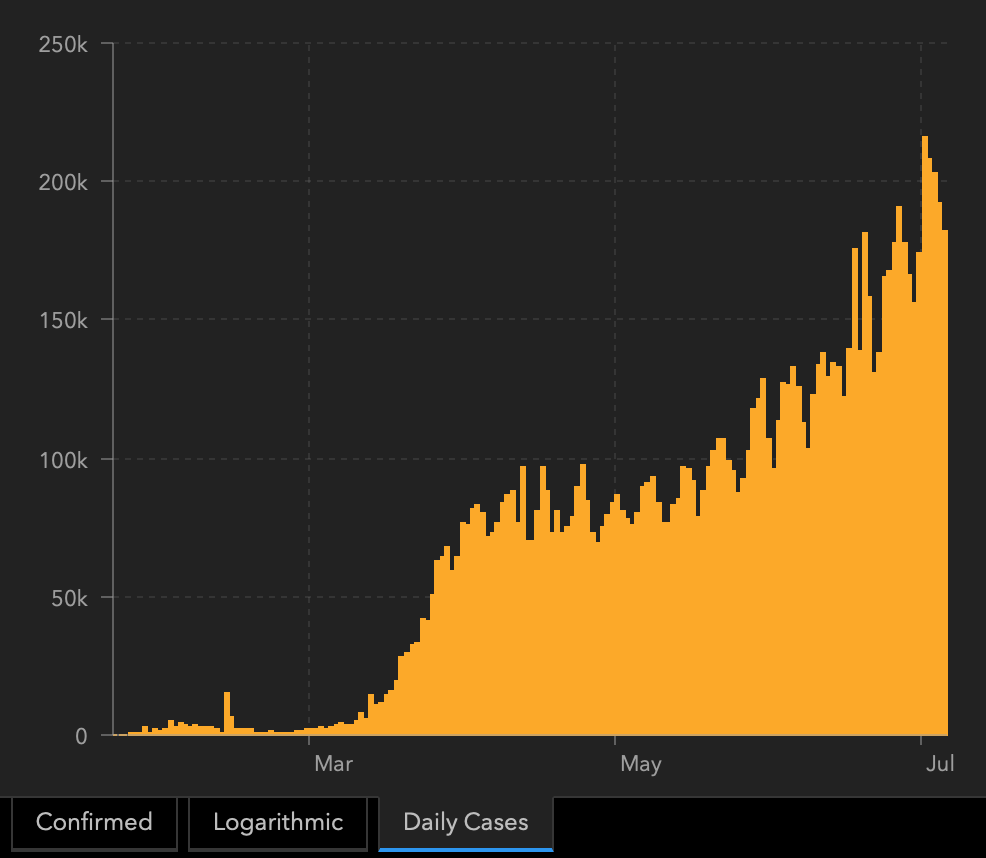
The second wave is not yet present in Europe, but please keep in mind that it could become a severe problem very fast. As the entire world has more and more Covid-19 cases, and the economies are being reopened, it will be very hard to avoid the second wave.
So why are markets not moving as they have moved in March? Most likely because the lockdown measures are not yet reintroduced in any meaningful way, and people are not yet deeply concerned with the economy.
At this point we would like to quote what we wrote about the aspects of the virus scare and how the market reacts to them. In short, gold (and other markets) reacted when people started to strongly consider the economic implications and this topic was ubiquitous in the media.
The particularly important factor for gold will likely be the economic implications of the second Covid-19 wave. How do we know that? Because we compared what people were searching for (online) with how gold prices shaped. There's a lot more data available on https://searchingcovid19.com/ but we'll focus on the chart that shows when people were getting interested in what aspects of the pandemic and we'll compare them to gold.
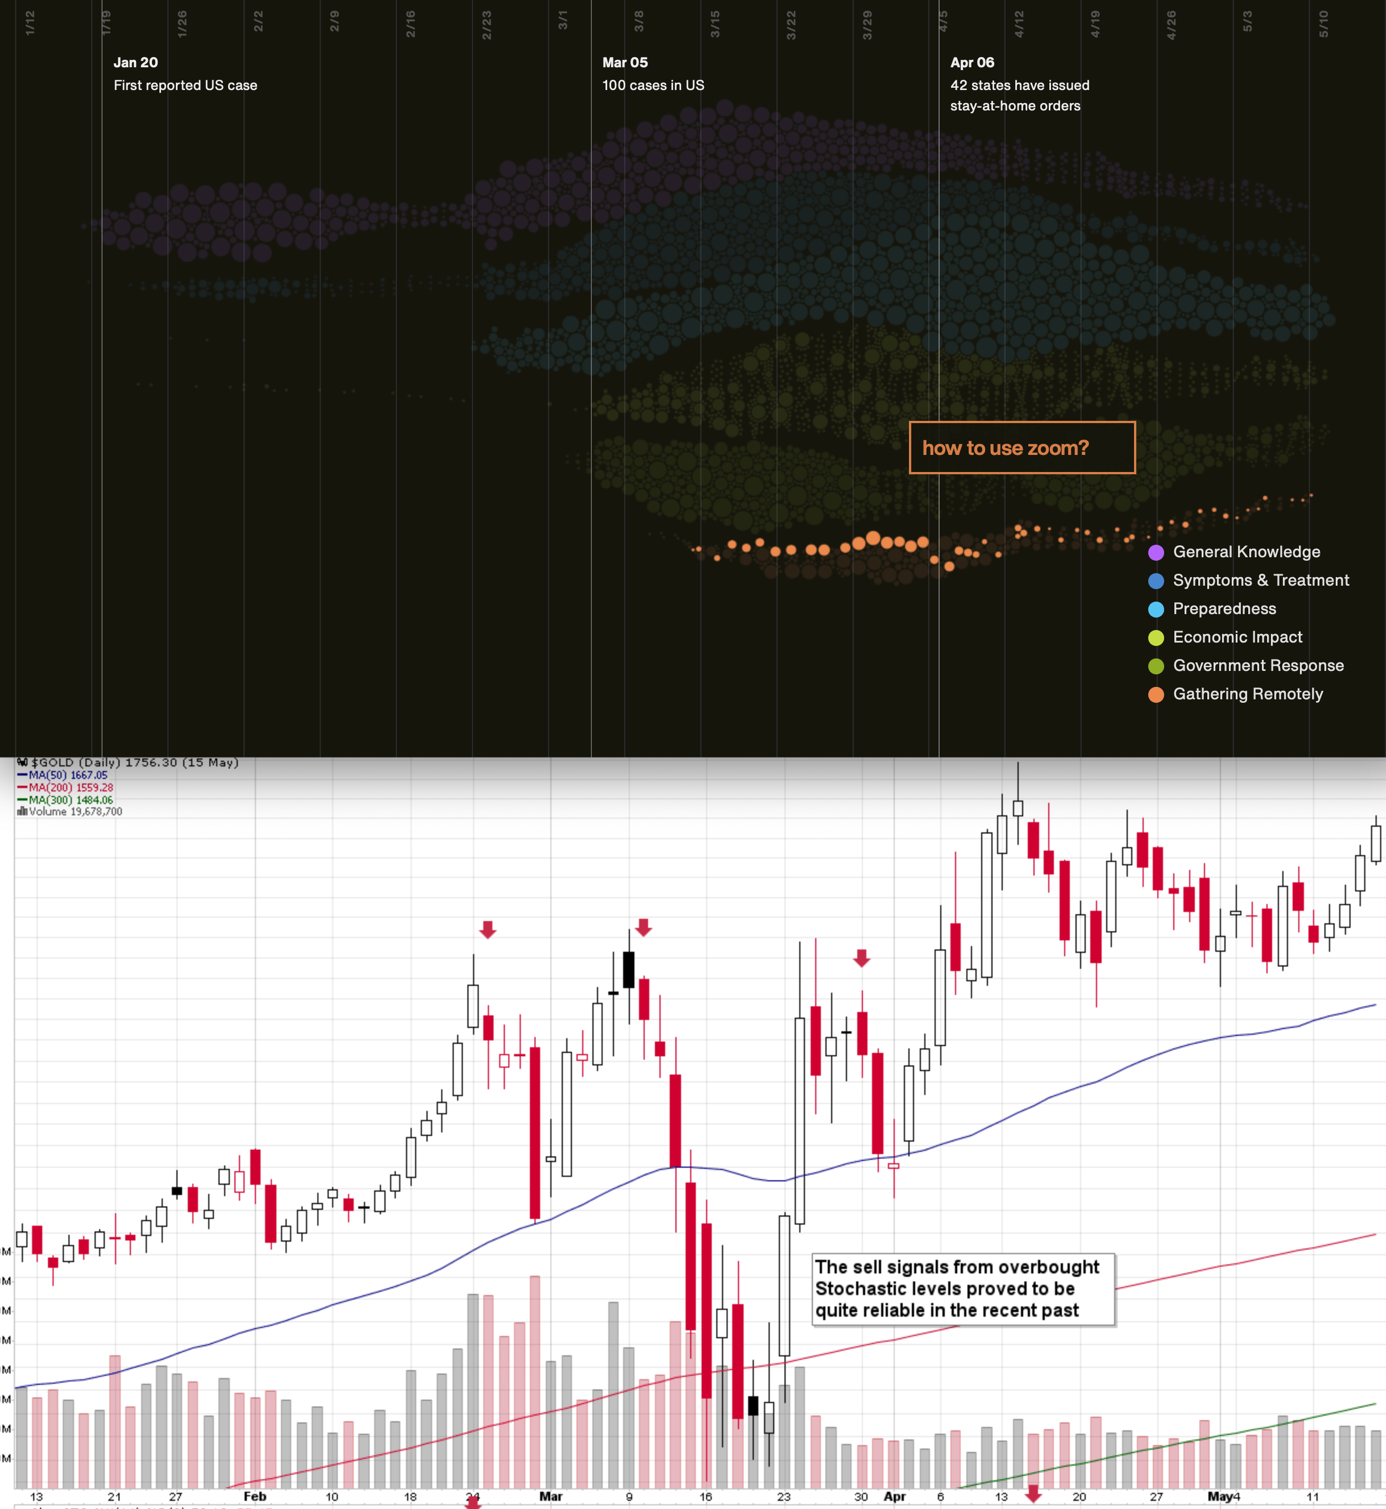
We aligned both charts with regard to time. The chart on the bottom is from Stockcharts.com and it features gold's continuous futures contract. The gold price (and the USD Index value) really started to move once people got particularly interested in the economic impact of the pandemic and in the government's response.
In the recent days (and weeks) the news is dominated by other issues. Once people start considering the economic implications of the second wave of this coronavirus, the prices would be likely to move.
The news coming from the Fed is positive for gold in the long run, but in the short term, they continue to indicate risk for the economy. This risk is likely to translate into lower stock values and initially gold is likely to slide given the above - just like it did in March.
Last week, the FOMC has published minutes of its meeting from June 9-10. They show a few interesting things. First of all, although the Fed officials could be satisfied with the stance of monetary policy, they want to communicate better to the markets their intentions about the path of the federal funds rate and the Fed's balance sheet. In other words, the FOMC is likely to strengthen their forward guidance later this year:
Participants agreed that the current stance of monetary policy remained appropriate, but many noted that the Committee could, at upcoming meetings, further clarify its intentions with respect to its future monetary policy decisions as the economic outlook becomes clearer. In particular, most participants commented that the Committee should communicate a more explicit form of forward guidance for the path of the federal funds rate and provide more clarity regarding purchases of Treasury securities and agency MBS as more information about the trajectory of the economy becomes available.
Now, the question is the type of the forward guidance which will be chosen. A few members of the Committee suggested the use of the calendar-based guidance, which sets a specific date beyond which accommodation will be reduced. But participants generally preferred outcome-based guidance. While a "couple" of them wanted to tie any rate hike to the decrease in the unemployment rate below a certain level, a "number' of central bankers preferred to make the normalization of the federal funds rate dependent on the inflation rate. Actually, they suggested that the Fed should not hike interest rates unless inflation would modestly overshoot the 2-percent target:
A number of participants spoke favorably of forward guidance tied to inflation outcomes that could possibly entail a modest temporary overshooting of the Committee's longer-run inflation goal but where inflation fluctuations would be centered on 2 percent over time. They saw this form of forward guidance as helping reinforce the credibility of the Committee's symmetric 2 percent inflation objective and potentially preventing a premature withdrawal of monetary policy accommodation.
In plain English it means that the Fed is likely to tolerate inflation above its target for some time and it will not hike the interest rates unless inflation rate surpasses 2 percent. The Fed's dovish bias and reluctance to actively combat inflation are excellent news for gold which is considered to be a hedge against inflation. Higher inflation rate also mean lower real interest rates, which should be also supportive for the gold prices.
Second, the Fed expressed concerns about the next waves of the Covid-19 epidemic, which could additionally hit the US economy:
A number of participants judged that there was a substantial likelihood of additional waves of outbreaks, which, in some scenarios, could result in further economic disruptions and possibly a protracted period of reduced economic activity.
The recent epidemiological data suggests that the Fed officials' worries were justified.
And the July 4 holiday weekend, which was - as always - celebrated with barbecues and fireworks displays, could only add fuel to fire. Of course, this time the reaction of authorities and citizens could be different and less aggressive, but it's hard for me to imagine that the resurgence of infections would not be negative for the GDP growth. Some states have already re-imposed restrictions or have slowed down reopening because of the resurgence of coronavirus cases. It means that the W-shaped recovery, rather than V-shaped rebound, is becoming more and more probable. Good news for gold! Of course, not necessarily in the very short term.
As we repeated many times, the vivid recovery was never an option. Even without the second wave, the pace of economic growth would be slow after initial rebound. As the FOMC admitted itself, "the recovery in consumer spending was not expected to be particularly rapid beyond this year, with voluntary social distancing, precautionary saving, and lower levels of employment and income restraining the pace of expansion over the medium term."
Moreover, high level of uncertainty, subdued consumer demand, a dearth in public infrastructure projects, and low oil prices would constrain the business investments, capital expenditures and hiring new workers. Hence, "participants concluded that voluntary social distancing and structural shifts stemming from the pandemic would likely mean that some proportion of businesses would close permanently".
What does it all mean for the gold market? Well, the recent FOMC minutes show that the Fed will strengthen its forward guidance later this year. It may increase transparency of the American monetary policy and increase confidence in the Fed, which could be negative for the gold prices. However, given the U.S. central bank's dovish bias, the forward guidance would probably imply low interest rates for a very long period, which should be supportive for the gold prices. The fresh viral outbreak only increases chances of further economic disruptions and very accommodative monetary policy.
Moreover, the Fed may use forward guidance based on inflation, announcing lack of any interest rate hikes unless inflation will reach certain level, which could be above the 2-percent target (the Fed officials have long dreamed of raising the target or overshooting, so now they have the perfect opportunity to officially allow for higher inflation!). Such particular forward guidance would be particularly positive for the gold prices, as the yellow metal is seen as a hedge against inflation which shine the brightest in an environment of low real interest rates. The initial reaction could be the opposite, as gold, silver, and mining stocks could be driven by lower stock market values - just like what we saw in March.
Moreover, let's keep in mind that big moves up in the USDX practically always correspond to big moves down in gold - sooner or later. And that the USD Index is likely to move much sooner based on the epic technical breakout anyway.
The Big Picture View of the USD Index
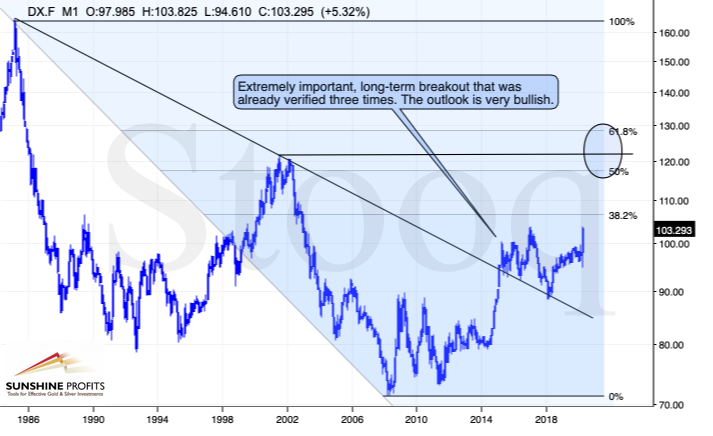
The 2014-2015 rally caused the USD Index to break above the declining very-long-term resistance line, which was verified as support three times. This is a textbook example of a breakout and we can't stress enough how important it is.
The most notable verification was the final one that we saw in 2018. Since the 2018 bottom, the USD Index is moving higher and the consolidation that it's been in for about a year now is just a pause after the very initial part of the likely massive rally that's coming.
If even the Fed and the U.S. President can't make the USD Index decline for long, just imagine how powerful the bulls really are here. The rally is likely to be huge and the short-term (here: several-month long) consolidation may already be over.
There are two cases on the above chart when the USD Index was just starting its massive rallies: in the early 1980s and in mid-90s. What happened in gold at that time?
Gold Performance When the USD Index Soars

These were the starting points of gold's most important declines of the past decades. The second example is much more in tune with the current situation as that's when gold was after years of prolonged consolidation. The early 1980s better compare to what happened after the 2011 top.
Please note that just as what we saw earlier this year, gold initially showed some strength - in February 1996 - by rallying a bit above the previous highs. The USD Index bottomed in April 1995, so there was almost a yearly delay in gold's reaction. But in the end, the USD - gold relationship worked as expected anyway.
The USD's most recent long-term bottom formed in February 2018 and gold seems to have topped right now. This time, it's a bit more than a year of delay, but it's unreasonable to expect just one situation to be repeated to the letter given different economic and geopolitical environments. The situations are not likely to be identical, but they are likely to be similar - and they indeed are.
What happened after the February 1995 top? Gold declined and kept on declining until reaching the final bottom. Only after this bottom was reached, a new powerful bull market started.
Please note that the pace at which gold declined initially after the top - in the first few months - was nothing to call home about. However, after the initial few months, gold's decline visibly accelerated.
Let's compare the sizes of the rallies in the USDX and declines in gold. In the early 80s, the USDX has almost doubled in value, while gold's value was divided by the factor of 3. In the mid-90s, the USDX rallied by about 50% from its lows, while gold's value was divided by almost 1.7. Gold magnified what happened in the USD Index in both cases, if we take into account the starting and ending points of the price moves.
However, one can't forget that the price moves in USD and in gold started at different times - especially in the mid-90s! The USDX bottomed sooner, which means that when gold was topping, the USDX was already after a part of its rally. Consequently, when gold actually declined, it declined based on only part of the slide in the USDX.
So, in order to estimate the real leverage, it would be more appropriate to calculate it in the following way:
- Gold's weekly close at the first week of February 1996: $417.70
- USDX's weekly close at the first week of February 1996: 86.97
- Gold's weekly close at the third week of July 1999: $254.50
- USDX's weekly close at the third week of July 1999: 103.88
The USD Index gained 19.44%
Gold lost 39.07% (which means that it would need to gain 64.13% to get back to the $417.70).
Depending on how one looks at it, gold actually multiplied USD's moves 2-3 times during the mid-90 decline.
And in the early 1980s?
- Gold's weekly close at the third week of January 1980: $845
- USDX's weekly close at the third week of January 1980: 85.45
- Gold's weekly close at the third week of June 1982: $308.50
- USDX's weekly close at the third week of June 1982: 119.01
The USD Index gained 39.27%
Gold lost 63.49% (which means that it would need to gain 173.91% to get back to $845).
Depending on how one looks at it, gold actually multiplied USD's moves by 1.6 - 4.4 times during the early-80 decline.
This means that just because one is not using U.S. dollars as their primary currency, it doesn't result in being safe from gold's declines that are accompanied by USD's big upswings.
In other words, the USD Index is likely to soar, but - during its decline - gold is likely to drop even more than the USD is going to rally, thus falling in terms of many currencies, not just the U.S. dollar.
Please note that there were wars, conflicts and tensions between 1980 and 2000. And the key rule still applied. Huge rallies in the USD Index mean huge declines in gold. If not immediately, then eventually.
Having covered the most important factor for the USD Index and gold, let's take a look at the other - also important - factors influencing both of these markets.
More on the USD Index and Gold
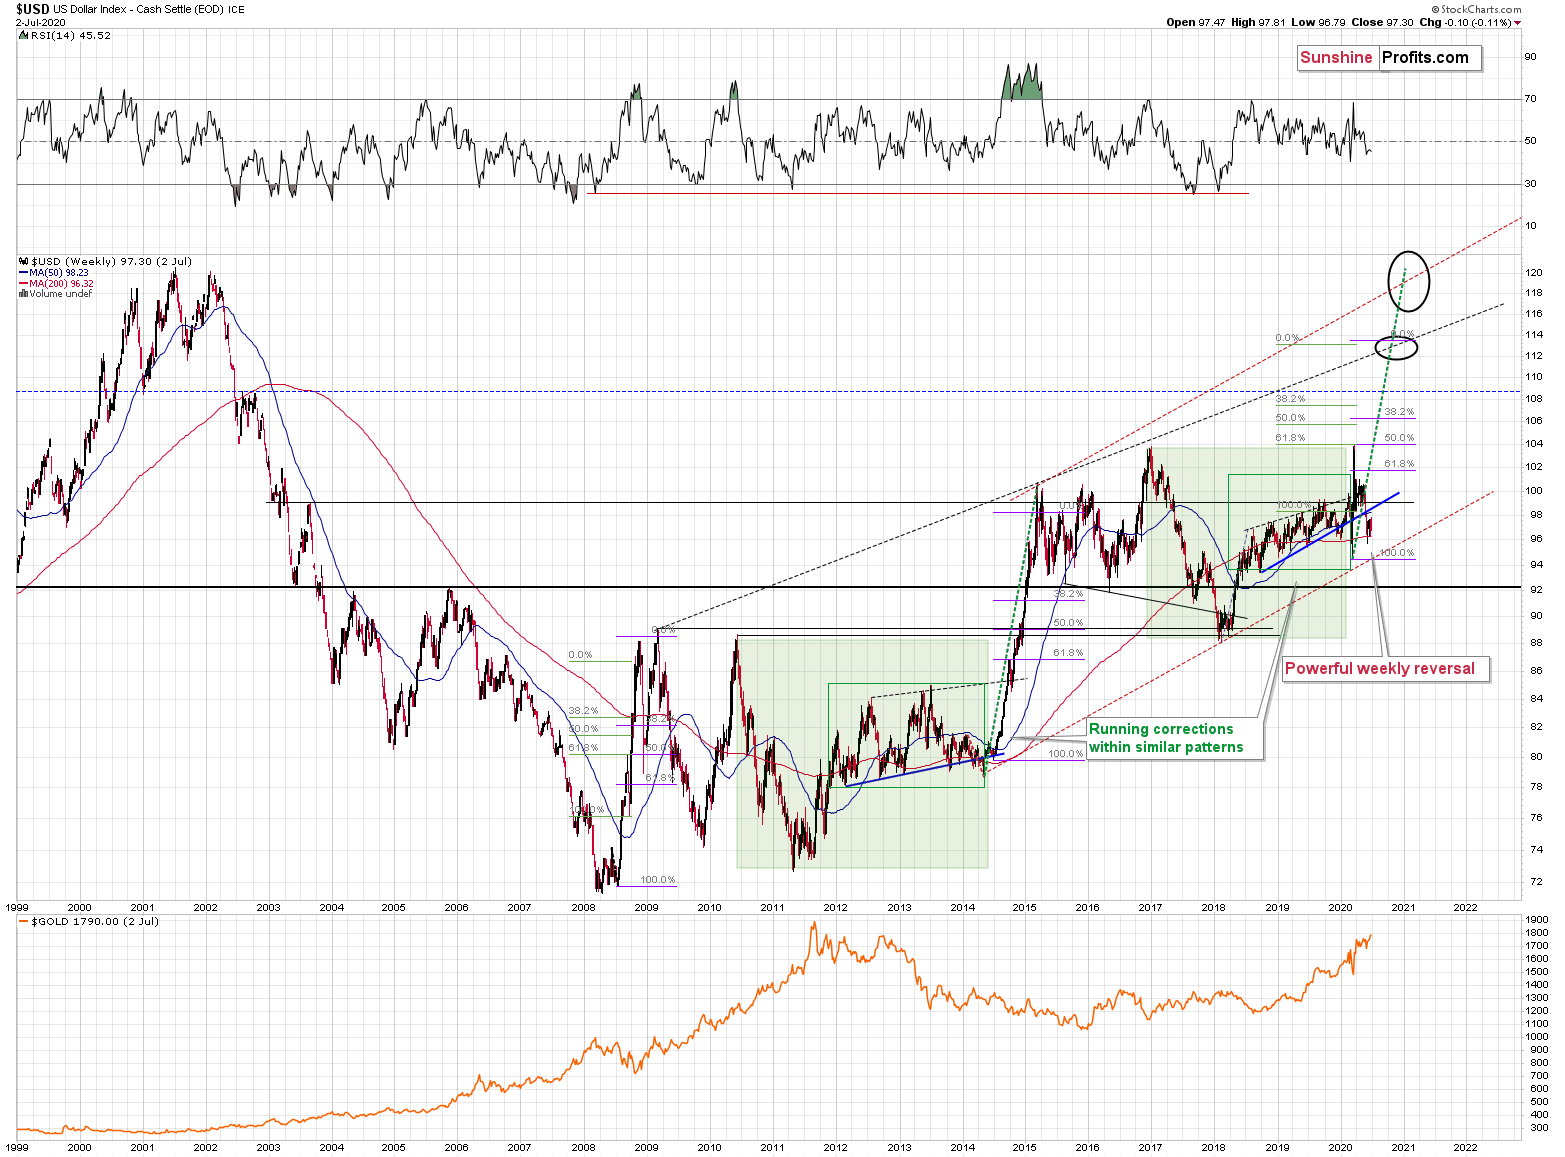
The USD Index was previously (for the entire 2019 as well as parts of 2018 and 2020) moving up in a rising trend channel (all medium-term highs were higher than the preceding ones) that formed after the index ended a very sharp rally. This means that the price movement within the rising trend channel was actually a running correction, which was the most bullish type of correction out there.
If a market declines a lot after rallying, it means that the bears are strong. If it declines a little, it means that bears are only moderately strong. If the price moves sideways instead of declining, it means that the bears are weak. And the USD Index didn't even manage to move sideways. The bears are so weak, and the bulls are so strong that the only thing that the USD Index managed to do despite Fed's very dovish turn and Trump's calls for lower USD, is to still rally, but at a slower pace.
We previously wrote that the recent temporary breakdown below the rising blue support line was invalidated, and that it was a technical sign that a medium-term bottom was already in.
The USD Index soared, proving that invalidation of a breakdown was indeed an extremely strong bullish sign.
Interestingly, that's not the only medium-term running correction that we saw. What's particularly interesting is that this pattern took place between 2012 and 2014 and it was preceded by the same kind of decline and initial rebound as the current running correction.
The 2010 - 2011 slide was very big and sharp, and it included one big corrective upswing - the same was the case with the 2017 - 2018 decline. They also both took about a year. The initial rebound (late 2011 and mid-2018) was sharp in both cases and then the USD Index started to move back and forth with higher short-term highs and higher short-term lows. In other words, it entered a running correction.
The blue support lines are based on short-term lows and since these lows were formed at higher levels, the lines are ascending. We recently saw a small breakdown below this line that was just invalidated. And the same thing happened in early 2014. The small breakdown below the rising support line was invalidated.
Since there were so many similarities between these two cases, the odds are that the follow-up action will also be similar. And back in 2014, we saw the biggest short-term rally of the past 20+ years. Yes, it was bigger even than the 2008 rally. The USD Index soared by about 21 index points from the fakedown low.
The USDX formed the recent fakedown low at about 96. If it repeated its 2014 performance, it would rally to about 117 in less than a year. Before shrugging it off as impossible, please note that this is based on a real analogy - it already happened in the past.
In fact, given this month's powerful run-up, it seems that nobody will doubt the possibility of the USD Index soaring much higher. Based on how things are developing right now, it seems that the USD Index might even exceed the 117 level, and go to 120, or even higher levels. The 120 level would be an extremely strong resistance, though.
Based on what we wrote previously in today's analysis, you already know that big rallies in the USD Index are likely to correspond to big declines in gold. The implications are, therefore, extremely bearish for the precious metals market in the following months.
On the short-term note, it seems that the USD Index has finished or almost finished its breather after the powerful run-up. While the base for the move may be similar to what happened between 2010 and 2014, the trigger for this year's sharp upswing was similar to the one from 2008. In both cases, we saw dramatic, and relatively sudden rallies based on investors seeking safe haven. The recent upswing was even sharper than the initial one that we had seen in the second half of 2008. In 2008, the USDX corrected sharply before moving up once again, and it's absolutely no wonder that we saw the same thing also recently.
But a correction after a sharp move absolutely does not imply that the move is over. In fact, since it's so in tune with what happened after initial (!) sharp rallies, it makes the follow-up likely as well. And the follow-up would be another powerful upswing. Just as a powerful upswing in the USD Index triggered gold's slide in 2008 and in March 2020, it would be likely to do the same also in the upcoming days / weeks.
Please note that the 2008 correction could have been used - along with the initial starting point of the rally - to predict where the following rally would be likely to end. The green lines show that the USDX slightly exceeded the level based on the 2.618 Fibonacci extension based on the size of the correction, and the purple lines show that the USDX has approximately doubled the size of its initial upswing.
Applying both techniques to the current situation, provides us with the 113 - 114 as the next target area for the USD Index. A sharp rally to that level (about 13-14 index points) would be very likely to trigger the final sell-off in gold, silver, and mining stocks.
For now, however, we see that the USD Index formed a clear and powerful weekly reversal, bottoming relatively close to its March bottom. This bodes very well for the next 1-6 weeks. The implications for gold are very bearish.
Please note that while the above remains up-to-date, we can't rule out a scenario in which the USD Index declines somewhat this week, bottoms and soars only after that. This would be in tune with what the USDX did before the biggest upswings of the past years.
In mid 2008, the USDX first moved lower before truly soaring.
In Q3 2011 (close to the middle of the year), the USDX also moved lower, forming a broad bottom, before soaring sharply.
In mid 2014, the USD Index also dipped while being between the 50-day moving average (marked with blue) and the 200-day moving average (marked with red) - exactly where they are right now.
In 2016, the USD Index moved a bit lower and reversed (at about 93) before the middle of the year. That was also when gold topped.
And why would the USD Index do that right now?
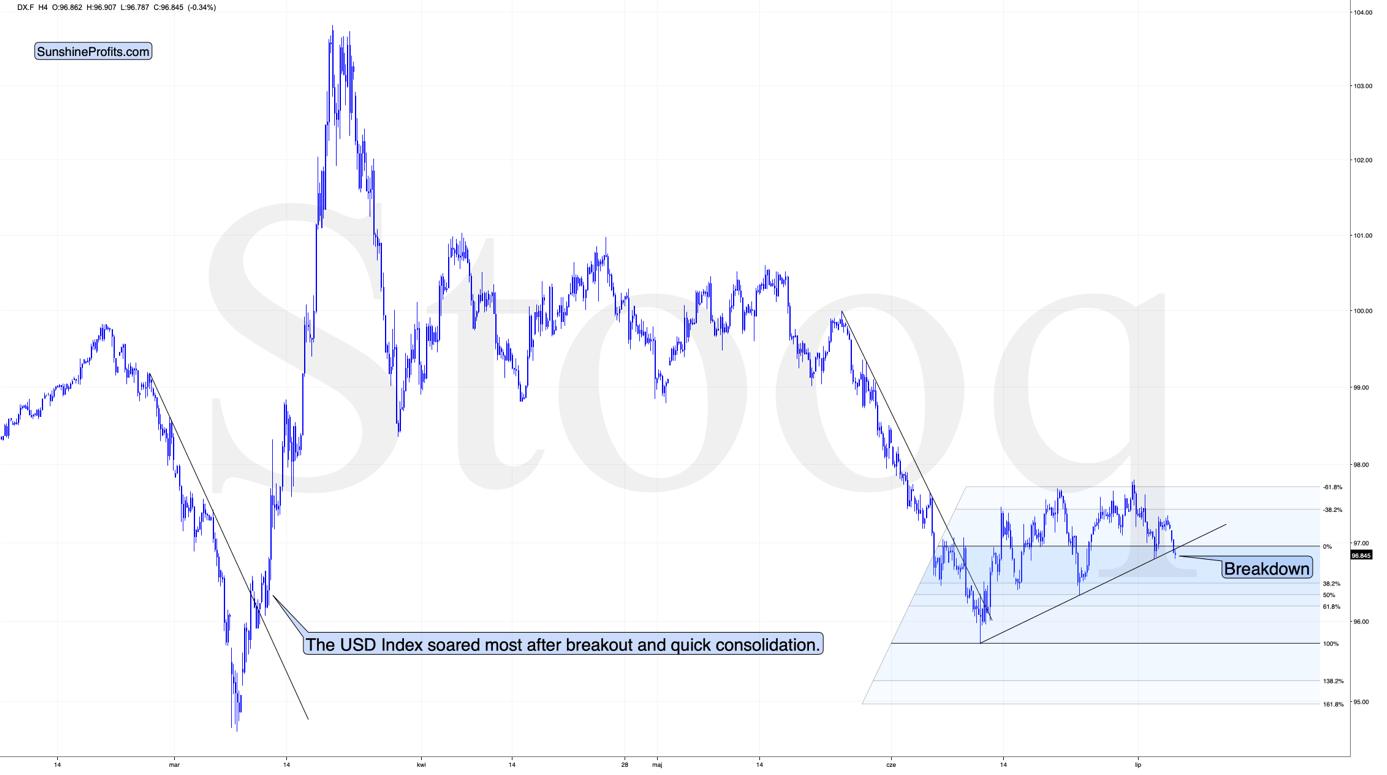
Because it just broke below the rising support line based on the most recent lows. The breakdown is not confirmed yet, but the move is definitely clearer and the situation more bearish than it was during the first July attempt to break below this line.
So, the USD Index could move lower in the next few days, and if it does, it would not invalidate the bullish case for the next several weeks - months at all. In fact, it would be in tune with how the USD Index behaved right before the biggest upswings.
The above could put bullish pressure on the precious metals sector in the next few days, without changing the bearish potential for the next 1-6 weeks.
Gold's Long-term View
In short, the long-term analogy in terms of prices to what happened in 2008 still seems intact in terms of the monthly price changes.
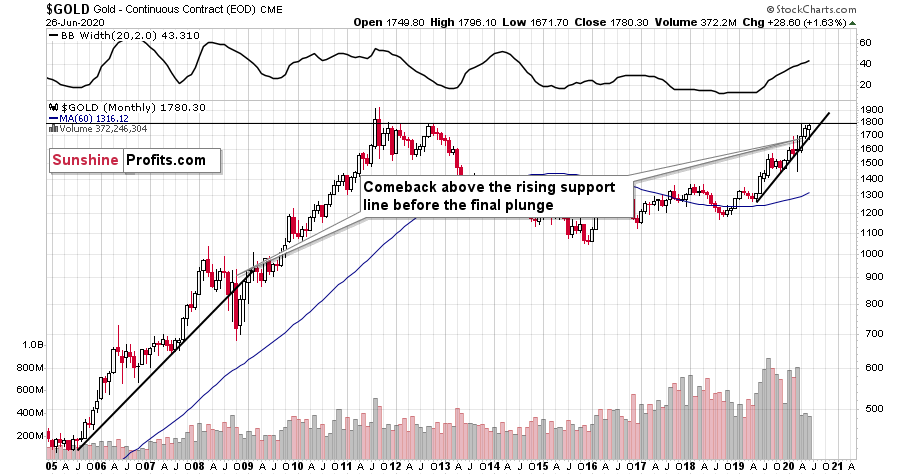
In 2008, after the initial plunge, and a - failed - intramonth attempt to move below the rising support line, gold came back above it and it closed the month there. The same happened in March 2020.
During the next month in 2008, gold rallied and closed visibly above the rising support line. The same was the case in April, 2020.
In the following month - the one analogous to May 2020 - gold initially moved higher, but then it plunged to new lows and finally closed the month below the rising support line.
We haven't seen the plunge last month, but we did see a move very close to the previous highs, just like what we saw in March. As the volatility is now somewhat smaller, it suggests that instead of seeing the slide in May, we might see it in June. This would also be in tune with the seasonal tendencies that we discussed earlier today.
Gold had declined and it recovered, but the above simply prolongs the analogy; it doesn't invalidate it. The important indication of that is that gold didn't manage to confirm the breakout above its long-term resistance provided by the November 2011 high.
If the USD Index does indeed decline, gold might move temporarily higher, but it's unlikely that this move would result in a confirmed breakout above the November 2011 high. Why?
There are multiple reasons for it, but the most precise and technical ones are gold's likelihood to reverse its direction based on the triangle-vertex-based reversal and the long-term cyclical turning point. In fact, it seems that it has already reversed.
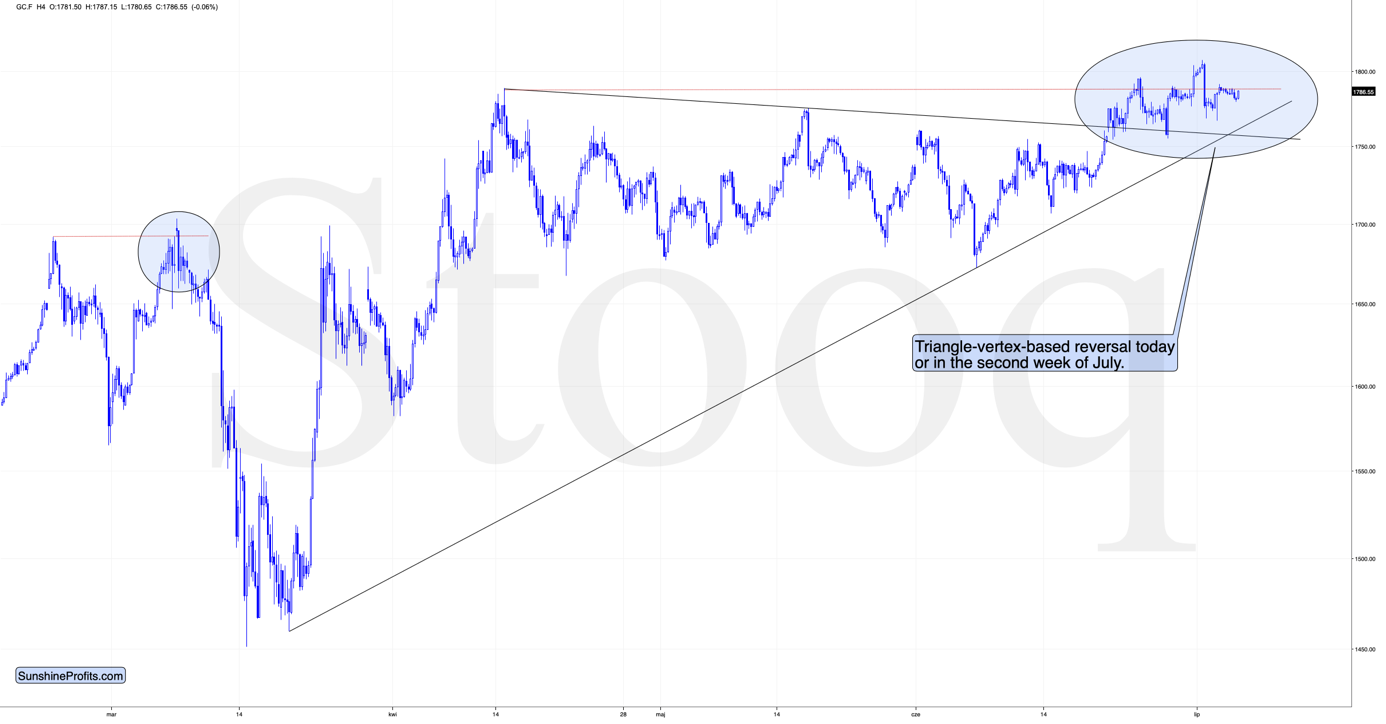
The resistance line, above which gold tried to break and the rising support line based on the March and June lows cross more or less in the first days of July. The triangle-vertex-based reversals have pointed to many important tops and bottoms in the recent weeks and months.
We previously wrote that the above-mentioned reversal might correspond to a bottom in gold, but as of today, it's clear that if any reversal is to take place, it's going to be a top, not a bottom, as gold's most recent short-term move has been up.
Thursday's top took place very close to the reversal, but at the same time it was not reached precisely. We then saw one more pop-up closer to the vertex.
This could mean that the top is already in, however, if the USD Index is to decline here, gold might be forced to move higher, nonetheless. We wouldn't rule out an attempt to move to or above the most recent high, but we doubt that gold futures would move above $1,820 even on a very temporary basis.
Let's keep in mind that gold's long-term turning point is here, which further emphasizes the likelihood of seeing a major turnaround right now.
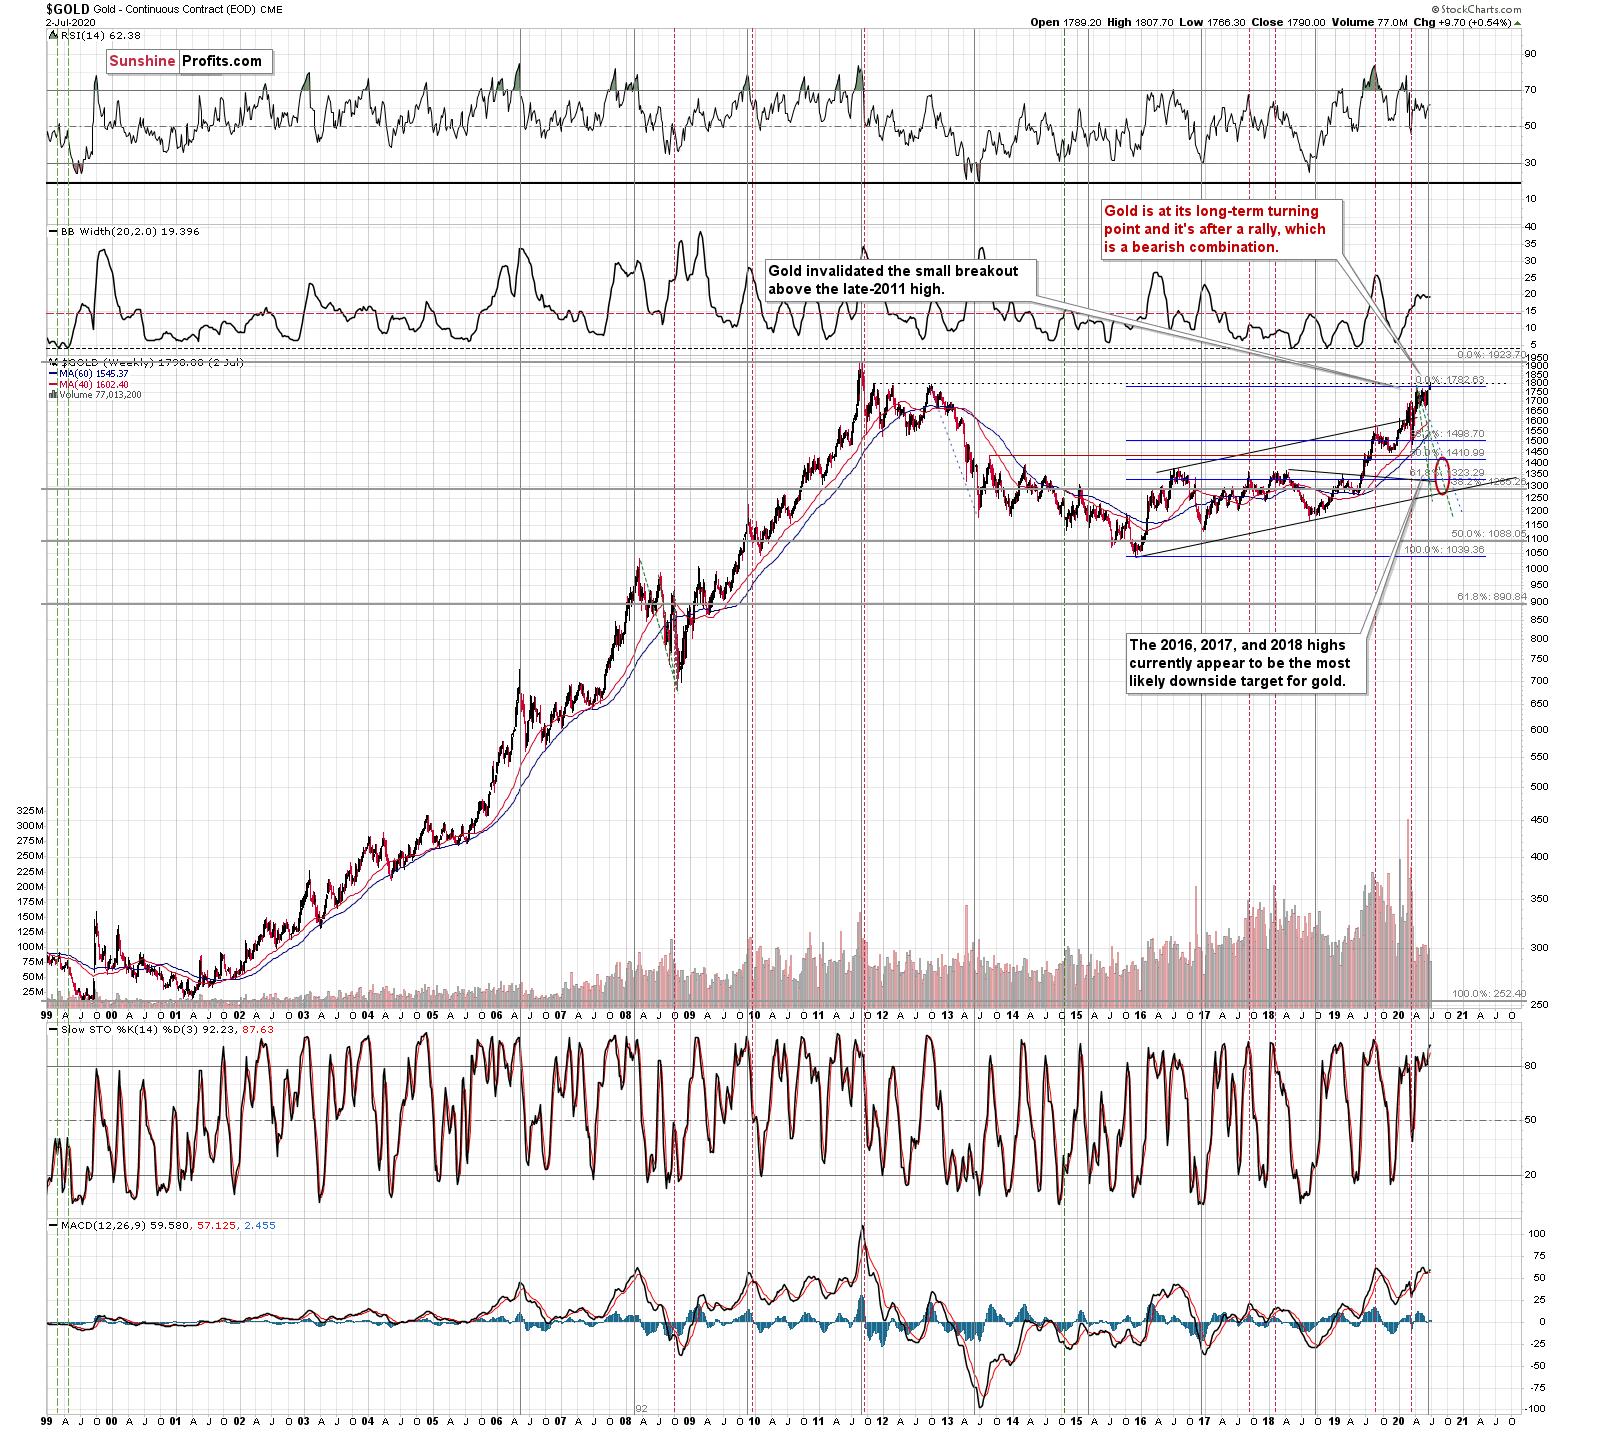
Until the 2011 top, these turning points were tops, and after the 2011 top - in each case - these turning points corresponded to major bottoms. We marked them with vertical, solid, gray lines.
The above means that the upcoming turning point had a slightly bigger chance of being a local bottom, but the most important thing is that there is likely to be some kind of extreme regardless of what type of extreme it is (that's the key difference between turning points and cycles - the latter have tops and bottoms after each other, while turning points could work in either way).
This means that what we saw earlier today might have been much more than just a temporary attempt to move higher. It might have been a major long-term top after which gold is going to slide in a profound manner.
Since the slide in gold is not likely to take long, but rather be relatively quick (similar to what we saw in March, and similar to the final slide that we saw in 2008), it could be the case that both: major top, and major bottom will be close to the turning point. That's exactly what happened in 2011, which was also the only time when gold was trading above $1,500 during the turning point.
Back then gold plunged almost $400 in less than a month. Since this kind of decline followed somewhat similar technical development, it's not out of the question that a big and sharp move could happen also in the following 1-3 weeks.
The above also suggests that our "crazy downside targets" are not so crazy after all.
Our current (and it might change in the following days) estimate is that gold would decline to the 2016, 2017, and 2018 lows - slightly below $1,400. Why? Because this level is confirmed by several major highs, which makes it the strongest support that's below the previous 2020 lows.
Moreover, back in 2008, gold bottomed about 8% below its initial September bottom. The recent bottom in gold was about $1,451. If history repeats itself, gold could decline to 92% x $1,451 = about $1,335.
In 2008, gold also declined by about 27% from its previous high. If the history repeats itself here, and gold topped yesterday (which seems quite likely), we can see gold's bottom at 73% x $1,789 = about $1,306.
The 2016, 2017, and 2018 highs are the strongest gold support that we have close to the above-mentioned price levels. Gold's fundamental situation is even better now than it was in 2008, so we think that looking for the support above the above-mentioned 2008-based price levels is more appropriate than basing it the above-mentioned gold trading tips. The 2016, 2017, and 2018 highs fulfill this requirement.
This means that gold would be likely to bottom between about $1,350 and $1,380.
Of course, the above estimates assume that gold would decline significantly and not modestly, when the USD Index does indeed break higher.
The way gold responds to USD's rally from the current levels to the previous 2020 highs should tell us a lot about what's really in store for gold in the following weeks.
Naturally, the long-term outlook remains extremely bullish, especially given the possibility of seeing a cup-and-handle formation in gold. The 2011 - now price movement could indeed be the "cup". Generally, the bigger, more symmetrical, and rounder the "cup" is, the more profound and more bullish the implications are.
There is, however, something that's missing from the pattern... We have the cup, but we're missing the handle!
The decline in gold which we wrote about previously would serve as the perfect handle for the massive cup that gold formed in the previous nine years. That's in perfect tune with what we've been expecting for gold anyway - we have been expecting one final slide before the move to new highs, and we would like to stress that getting it would not invalidate the long-term bullishness at all. Conversely, it would confirm it through the cup-and-handle pattern.
Having said that, let's turn to silver.
Silver's Strength and Indications
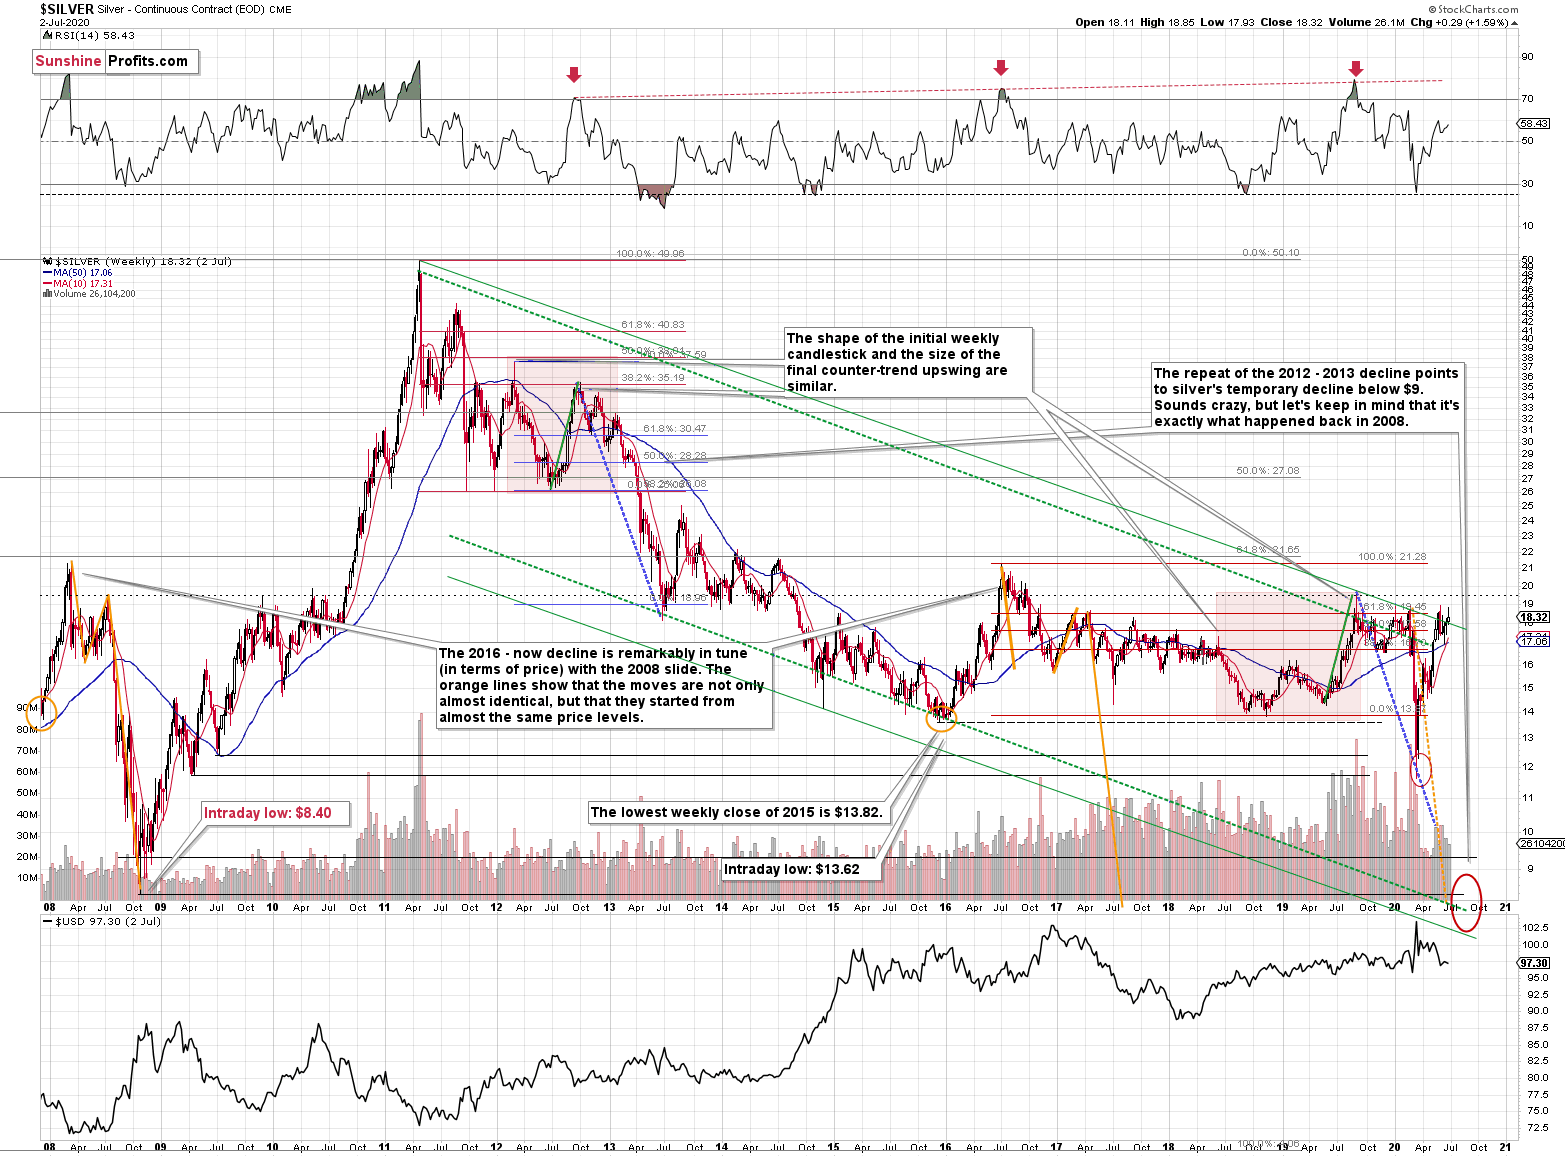
On a long-term basis, silver is trying to break above its declining long-term resistance line and it's still below the levels from which the previous 2020 slide started, at least in terms of the intraday prices.
Silver formed a bearish reversal candlestick, which does not bode well for the white metal's future. However, if gold was to move higher here, based on USD's breakdown, we might experience something that we experience quite often in the final days and hours of a rally - silver's quick outperformance.
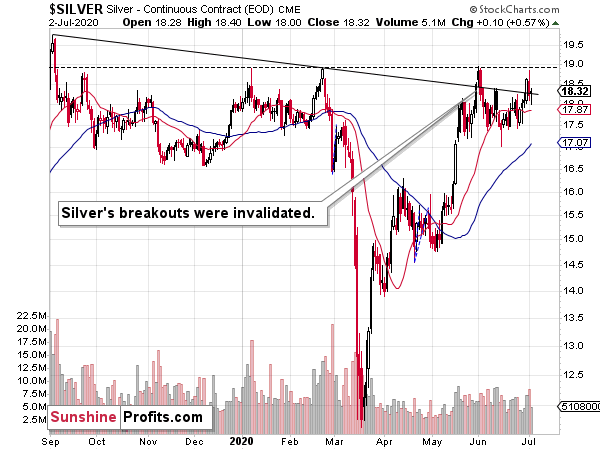
This means that silver could manage to temporarily take out the previous 2020 highs before finally plunging. This would be relatively normal - not bullish.
Then, after the top, silver would be likely to decline once again, quite likely in a profound manner. Even though silver rallied considerably recently, it doesn't have to be the case that the link between now and 2008 is broken.
This is the link that we mean:
Silver just plunged to our initial target level and reversed shortly after doing so. It was for many months that we've been featuring the above silver chart along with the analogy to the 2008 slide. People were laughing at us when we told them that silver was likely to slide below $10.
Well, the recent low of $11.64 proves that we were not out of our minds after all. Our initial target was reached, and as we had explained earlier today, the entire panic-driven plunge has only begun.
Those who were laughing the loudest will prefer not to notice that silver reversed its course at a very similar price level at which it had reversed initially in 2008. It was $12.40 back then, but silver started the decline from about 50 cent higher level, so these moves are very similar.
This means that the key analogy in silver (in addition to the situation being similar to mid-90s) remains intact.
It also means that silver is very likely to decline AT LEAST to $9. At this point we can't rule out a scenario in which silver drops even to its all-time lows around $4-$5.
Note: Silver at or slightly below $8 seems most probable at this time.
Crazy, right? Well, silver was trading at about $19 less than a month ago. These are crazy times, and crazy prices might be quite realistic after all. The worst is yet to come.
Let's quote what the 2008-now analogy is all about in case of silver.
There is no meaningful link in case of time, or shape of the price moves, but if we consider the starting and ending points of the price moves that we saw in both cases, the link becomes obvious and very important. And as we explained in the opening part of today's analysis, price patterns tend to repeat themselves to a considerable extent. Sometimes directly, and sometimes proportionately.
The rallies that led to the 2008 and 2016 tops started at about $14 and we marked them both with orange ellipses. Then both rallies ended at about $21. Then they both declined to about $16. Then they both rallied by about $3. The 2008 top was a bit higher as it started from a bit higher level. And it was from these tops (the mid-2008 top and the early 2017 top) that silver started its final decline.
In 2008, silver kept on declining until it moved below $9. Right now, silver's medium-term downtrend is still underway. If it's not clear that silver remains in a downtrend, please note that the bottoms that are analogous to bottoms that gold recently reached, are the ones from late 2011 - at about $27. Silver topped close to $20.
The white metal hasn't completed the decline below $9 yet, and at the same time it didn't move above $19 - $21, which would invalidate the analogy. This means that the decline below $10, perhaps even below $9 is still underway.
Now, some may say that back in 2008, silver rallied only to about $14 and since now it rallied to about $16, so the situation is now completely different and that the link between both years is broken. But that's simply not true.
The nominal price levels are just one of the ways that one should look at the analogy - far from being the perfect or most important one.
Please note that back in 2008, there were two smaller bottoms in silver, and this time we saw just one. The decline before the bottom was sharper, so is it really that surprising that the rebound was sharper as well? Silver ended the 2008 corrective upswing once it moved visibly above the declining orange line and that's exactly what happened recently. It also topped once it reached its 10-week moving average (red line). That's exactly what just happened. This MA is at $15.81 and at the moment of writing these words, silver is back below it, trading at $15.65.
The situations are not perfectly identical in terms of nominal prices, but they remain remarkably similar given how different fundamental reasons are behind these price moves (in reality, what's behind both declines is fear that - itself - doesn't change).
The technique used for predicting silver price is clearer than the one that we applied for gold, so it seems useful to look not only at the USD Index for signs, but also at the white metal itself. Once silver moves to $8 or below it, it will likely serve as a strong buy sign for gold, regardless of the price at which gold will be trading at that time.
The 2020 slide was sharper, so it's not that surprising that the rebound was also more notable. Besides, the breakout above the 100 level in the gold to silver ratio and is a small feat either. The comeback to the previously broken 100 level in the ratio is normal, so given gold's recent rally, silver's rally in the last few weeks is not that ground-breaking either.
Consequently, while the 2008-now analogy in terms of price is no longer as clear as it used to be, the breakout in the gold to silver ratio above 100 level is what makes up for the above in terms of overall bearishness of the medium-term silver price developments. And weakness in mining stocks confirms it.
And you know what's the other thing that quite often happens at the tops, in addition to silver's temporary strength? Miners tend to underperform. What did miners do on the last trading day of the previous week?
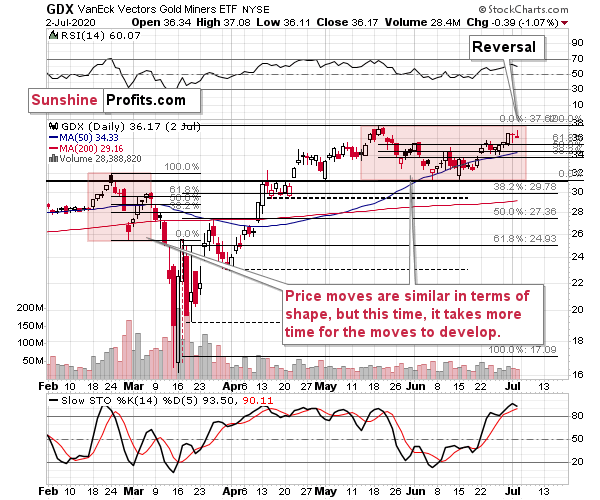
Miners reversed and ended the day over 1% lower, even though the GLD ETF ended the day slightly higher. Consequently, this piece of the puzzle seems to be in.
Remember when we wrote that the situation right now is similar to what happened in March, but this time it takes longer for everything to develop due to the change in market's perception of risk? To make a long story short, the March panic was because the entire world was dealing with the unknown, which exacerbated the fear. Right now, the situation is worse, and it goes worse almost on a daily basis, but people are not as afraid. The economic implications don't appear so dire either. And it's definitely nothing unknown - we more or less know what to expect.
This means that we're likely to see a repeat of what we saw in March, we're likely to see it in "slow motion", at least for some time. Please note that even slow-motion mode of the mid-March plunge would still be very volatile.
The areas that we marked with red rectangles are similar in terms of shape, but the current one is about 4x longer. The previous pattern was characterized by a decline and a correction that took more or less the same time to complete. If we're about to see something similar also this time, then we can expect the top to be formed this week.
If the March decline took 5 trading days and the price moves are taking 4x as long this time, then perhaps we would see a monthly decline to the final lows instead of a weekly one. This would serve as a perfect "handle" for the massive, long-term "cup and handle" pattern in gold.
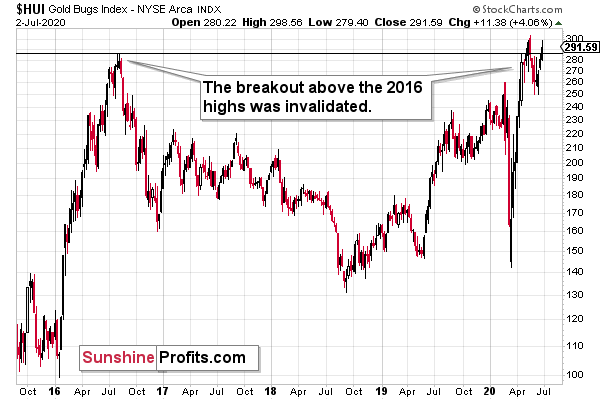
On HUI's long-term chart we can see that the gold stock index is once again trying to break above the 2016 highs. The previous attempt was invalidated relatively shortly, and given what we already wrote today it's likely that this attempt will be invalidated as well - most likely as early as this week.
Palladium's Bearish Confirmation
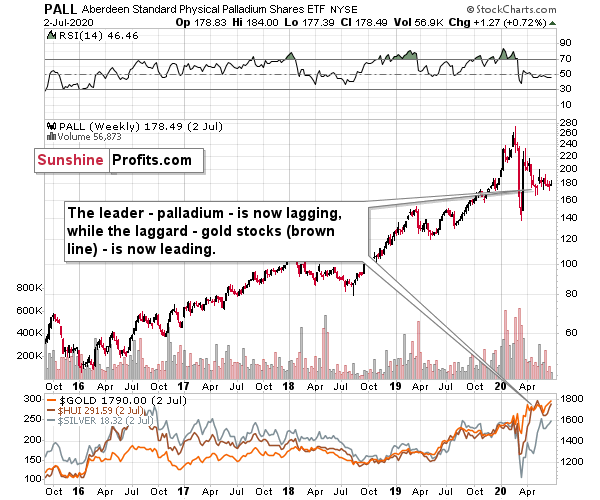
Please note how weak palladium has been in the past several weeks. Even despite a move higher in gold, this previous leader of the precious metals sector is refusing to show any significant strength. This indicates that the precious metals sector is not yet ready to move much higher - it's likely to decline first.
Summary
Summing up, gold stole the spotlight recently, trying to break above the $1,800 barrier and the November 2011 high, but this move was quickly invalidated, which served as a bearish confirmation. Based on today's short-term breakdown in the USD Index, it seems that gold might attempt to break above $1,800 once again, but I don't expect this breakout to hold. Miners are unlikely to move much higher anyway, as they tend to underperform at the top.
Gold did end the previous month and quarter at exceptionally high level, but the monthly volume was low, and it was the only part of the precious metals market that showed this kind of strength. Silver is just a few dollars above its 2015 low and over $30 below its 2011 high, while miners are trying to get above their 2016 high - well below their 2011 high. Given the above and gold's looming reversals, I think that a big decline is in the cards for the entire precious metals sector.
After the sell-off (that takes gold below $1,400), we expect the precious metals to rally significantly. The final decline might take as little as 1-6 weeks, so it's important to stay alert to any changes.
Most importantly - stay healthy and safe. We made a lot of money on the March decline and the subsequent rebound (its initial part) price moves (and we'll likely make much more in the following weeks and months), but you have to be healthy to really enjoy the results.
As always, we'll keep you - our subscribers - informed.
To summarize:
Trading capital (supplementary part of the portfolio; our opinion): Full speculative short positions (300% of the full position) in mining stocks is justified from the risk to reward point of view with the following binding exit profit-take price levels:
Senior mining stocks (price levels for the GDX ETF): binding profit-take exit price: $10.32; stop-loss: none (the volatility is too big to justify a SL order in case of this particular trade); binding profit-take level for the DUST ETF: $231.75; stop-loss for the DUST ETF: none (the volatility is too big to justify a SL order in case of this particular trade)
Junior mining stocks (price levels for the GDXJ ETF): binding profit-take exit price: $9.57; stop-loss: none (the volatility is too big to justify a SL order in case of this particular trade); binding profit-take level for the JDST ETF: $284.25; stop-loss for the JDST ETF: none (the volatility is too big to justify a SL order in case of this particular trade)
For-your-information targets (our opinion; we continue to think that mining stocks are the preferred way of taking advantage of the upcoming price move, but if for whatever reason one wants / has to use silver or gold for this trade, we are providing the details anyway. In our view, silver has greater potential than gold does):
Silver futures downside profit-take exit price: $8.58 (the downside potential for silver is significant, but likely not as big as the one in the mining stocks)
Gold futures downside profit-take exit price: $1,382 (the target for gold is least clear; it might drop to even $1,170 or so; the downside potential for gold is significant, but likely not as big as the one in the mining stocks or silver)
Long-term capital (core part of the portfolio; our opinion): No positions (in other words: cash
Insurance capital (core part of the portfolio; our opinion): Full position
Whether you already subscribed or not, we encourage you to find out how to make the most of our alerts and read our replies to the most common alert-and-gold-trading-related-questions.
Please note that the in the trading section we describe the situation for the day that the alert is posted. In other words, it we are writing about a speculative position, it means that it is up-to-date on the day it was posted. We are also featuring the initial target prices, so that you can decide whether keeping a position on a given day is something that is in tune with your approach (some moves are too small for medium-term traders and some might appear too big for day-traders).
Plus, you might want to read why our stop-loss orders are usually relatively far from the current price.
Please note that a full position doesn't mean using all of the capital for a given trade. You will find details on our thoughts on gold portfolio structuring in the Key Insights section on our website.
As a reminder - "initial target price" means exactly that - an "initial" one, it's not a price level at which we suggest closing positions. If this becomes the case (like it did in the previous trade) we will refer to these levels as levels of exit orders (exactly as we've done previously). Stop-loss levels, however, are naturally not "initial", but something that, in our opinion, might be entered as an order.
Since it is impossible to synchronize target prices and stop-loss levels for all the ETFs and ETNs with the main markets that we provide these levels for (gold, silver and mining stocks - the GDX ETF), the stop-loss levels and target prices for other ETNs and ETF (among other: UGLD, DGLD, USLV, DSLV, NUGT, DUST, JNUG, JDST) are provided as supplementary, and not as "final". This means that if a stop-loss or a target level is reached for any of the "additional instruments" (DGLD for instance), but not for the "main instrument" (gold in this case), we will view positions in both gold and DGLD as still open and the stop-loss for DGLD would have to be moved lower. On the other hand, if gold moves to a stop-loss level but DGLD doesn't, then we will view both positions (in gold and DGLD) as closed. In other words, since it's not possible to be 100% certain that each related instrument moves to a given level when the underlying instrument does, we can't provide levels that would be binding. The levels that we do provide are our best estimate of the levels that will correspond to the levels in the underlying assets, but it will be the underlying assets that one will need to focus on regarding the signs pointing to closing a given position or keeping it open. We might adjust the levels in the "additional instruments" without adjusting the levels in the "main instruments", which will simply mean that we have improved our estimation of these levels, not that we changed our outlook on the markets. We are already working on a tool that would update these levels on a daily basis for the most popular ETFs, ETNs and individual mining stocks.
Our preferred ways to invest in and to trade gold along with the reasoning can be found in the how to buy gold section. Additionally, our preferred ETFs and ETNs can be found in our Gold & Silver ETF Ranking.
As a reminder, Gold & Silver Trading Alerts are posted before or on each trading day (we usually post them before the opening bell, but we don't promise doing that each day). If there's anything urgent, we will send you an additional small alert before posting the main one.
Thank you.
Sincerely,
Przemyslaw Radomski, CFA
Editor-in-chief, Gold & Silver Fund Manager

