

Briefly: In our opinion, full (150% of the regular full position) speculative short positions in gold, silver and mining stocks are justified from the risk/reward perspective at the moment of publishing this alert.
Mining stocks continued to decline yesterday even despite the lack of decline in the underlying metals and even in light of the daily decline in the USD Index. If the target for mining stocks and gold is quite clear, then can we say the same thing about the white metal? Making predictions for it is more difficult due to silver’s intraday volatility at its turning points, but in today’s essay we apply more and less known techniques and – as you will soon see – we arrive at a level that many of the above confirm. So, what’s next for the price of silver?
Let’s jump right into the silver chart (chart courtesy of http://stockcharts.com).
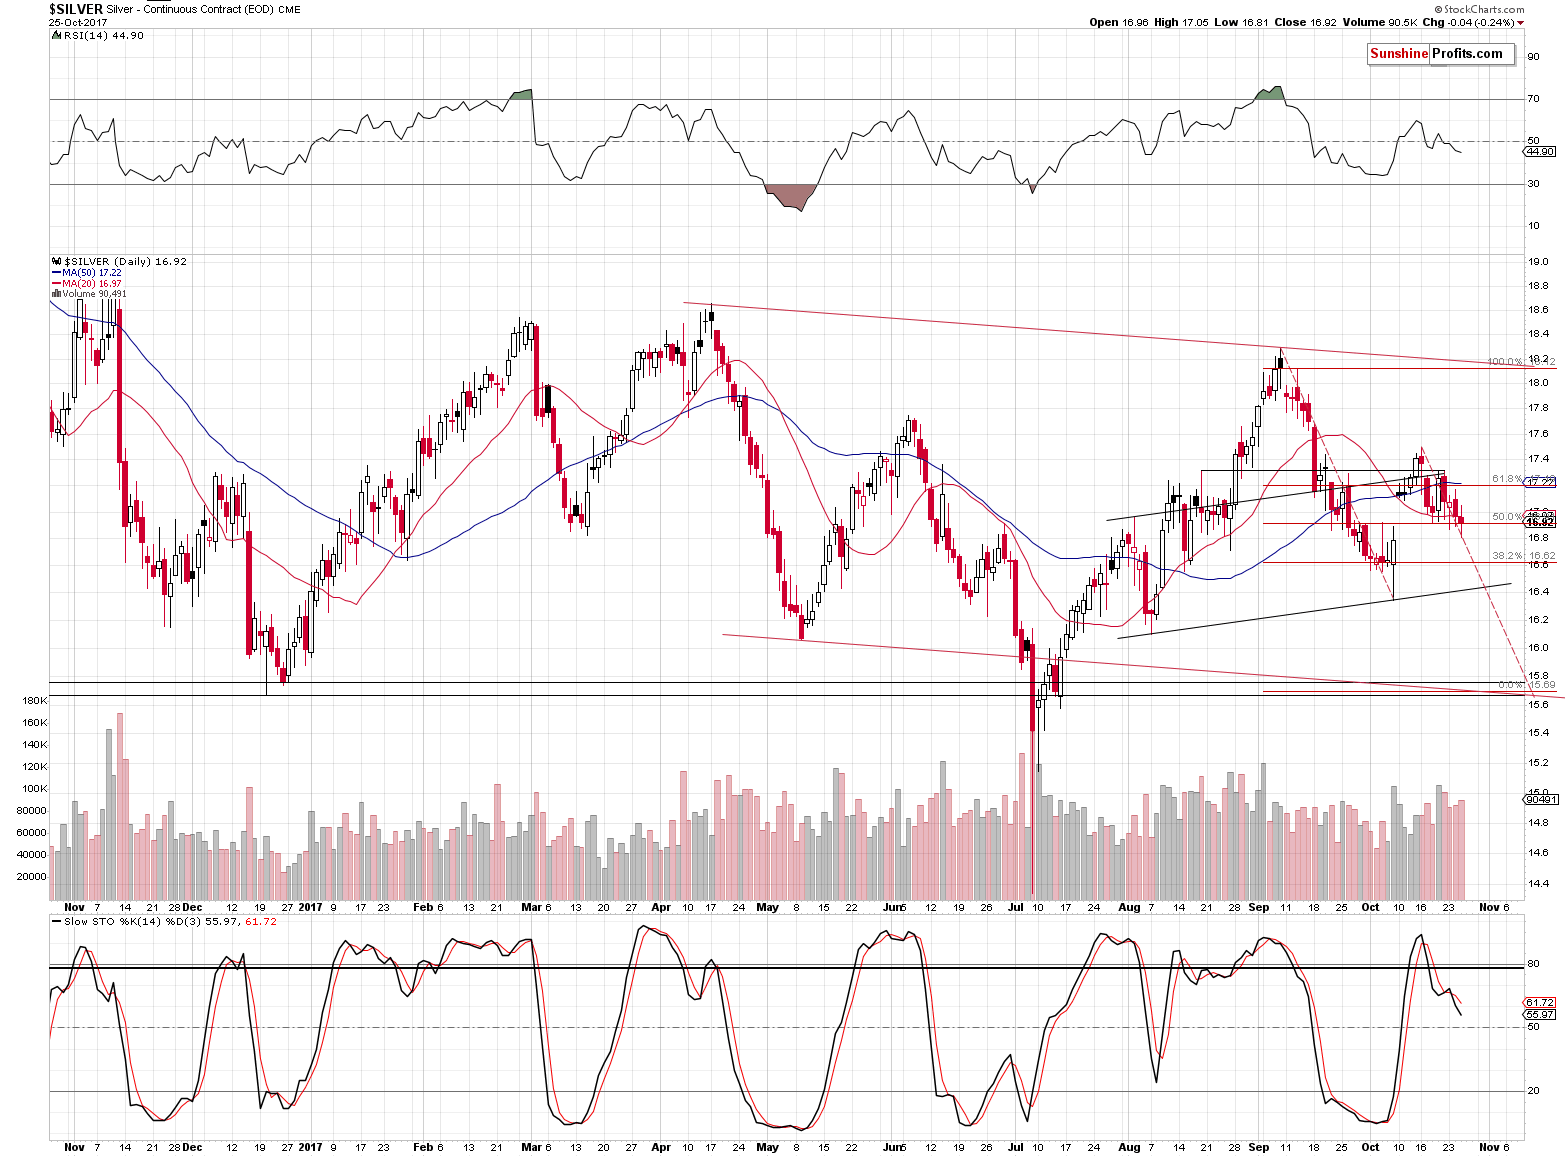
The first technique that we used is to apply the size of the decline that’s analogous to the previous (September – October) one. Why? Because that’s what appears likely to be seen in gold. Both metals don’t have to move in tandem, but they often do, so that’s one way to detect the upcoming target. By the way, based on our experience, using relative valuations (applying analogous price moves to analogous moments) is in most cases superior to assuming that the gold:silver ratio remains unchanged as the former also assumes a continuation in the most recent trend in the ratio. A trend’s continuation is usually more likely than a sudden stop in it.
The second technique is to apply the Phi number. It’s usually applied through Fibonacci retracement levels, but it can work also in a different way. By connecting the previous extremes, one can apply the Fibonacci extensions to arrive at a target level. In this case, we used the September and October lows in terms of the daily closing prices.
The size of the September – October decline is about $1.50 and multiplying this by 1.618 gives $2.427. Deducting that from $18.12 provides us with $15.69 as the target. We illustrated the above with red Fibonacci lines.
The third technique is applying the April – May decline to the September high (red declining lines illustrate it).
The fourth technique is using the December 2016 lows (intraday and the closing price) as support levels. Naturally, there also the July extremes, but they are not as aligned with other price levels.
All the above techniques point to the target range between $15.65 and $15.75. In order to increase the odds of completing the transaction it seems that the exit price should be set a little above it and that’s why we set it at $15.82.
What about yesterday’s performance in gold, and mining stocks?
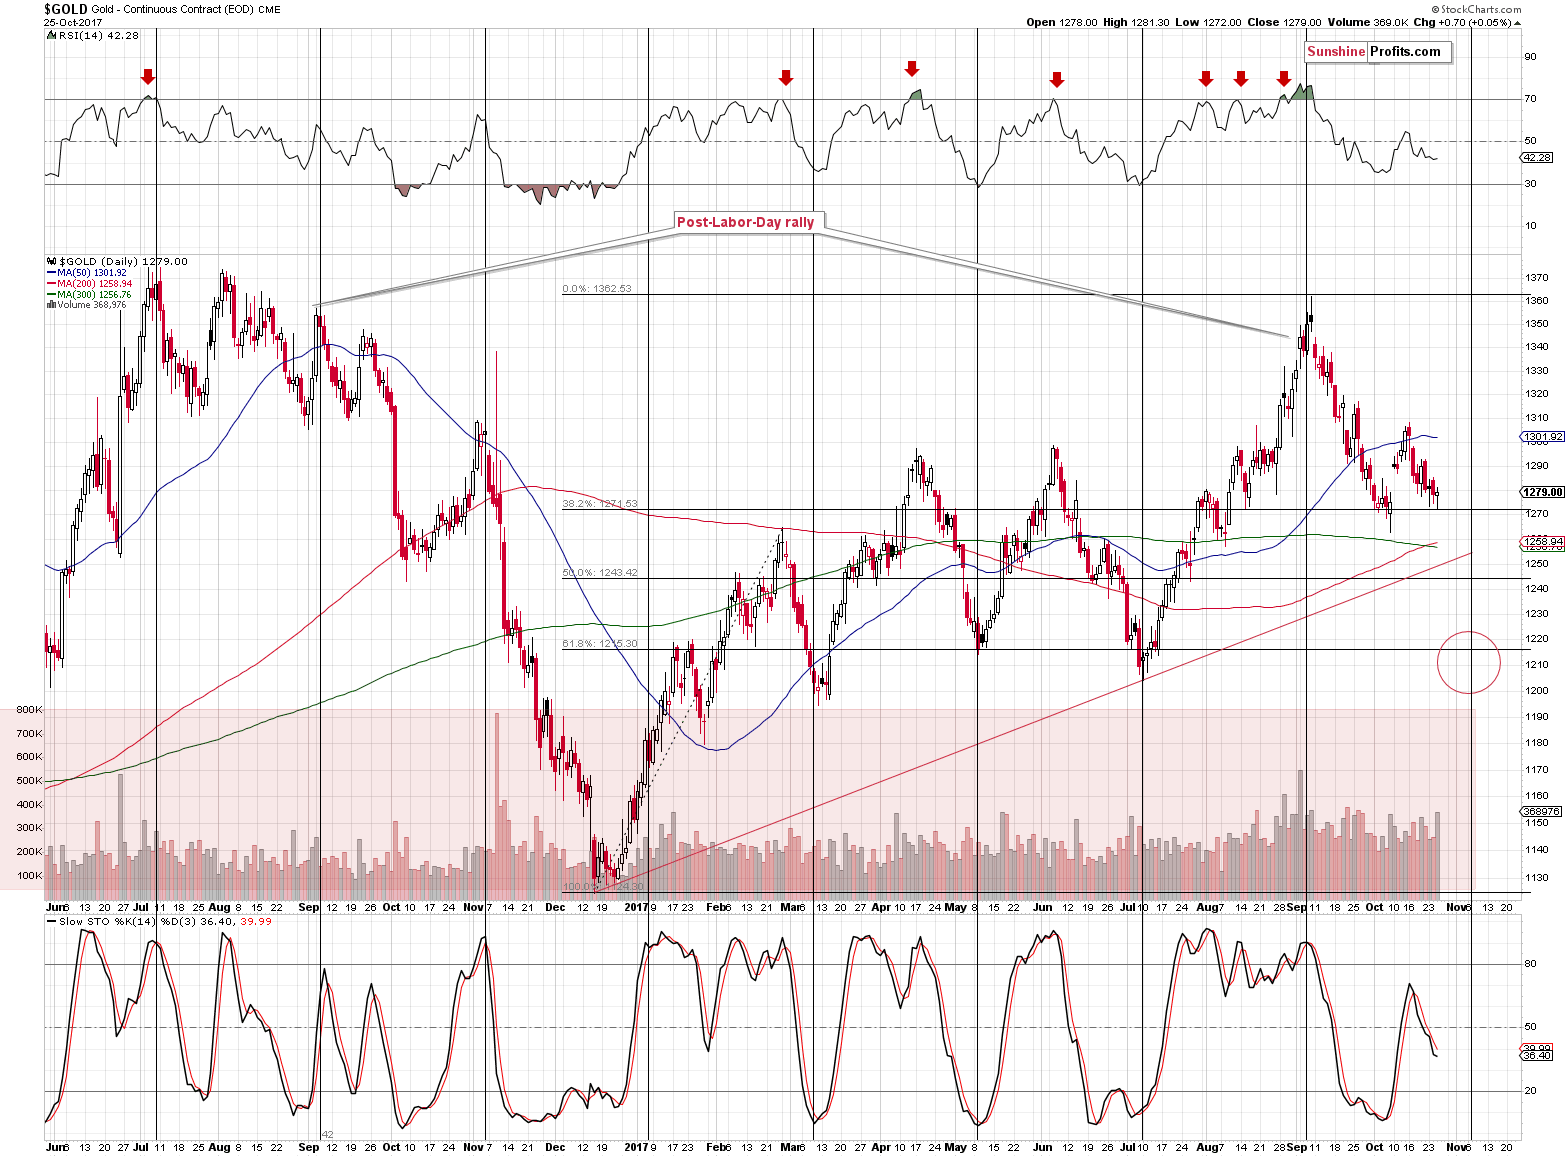
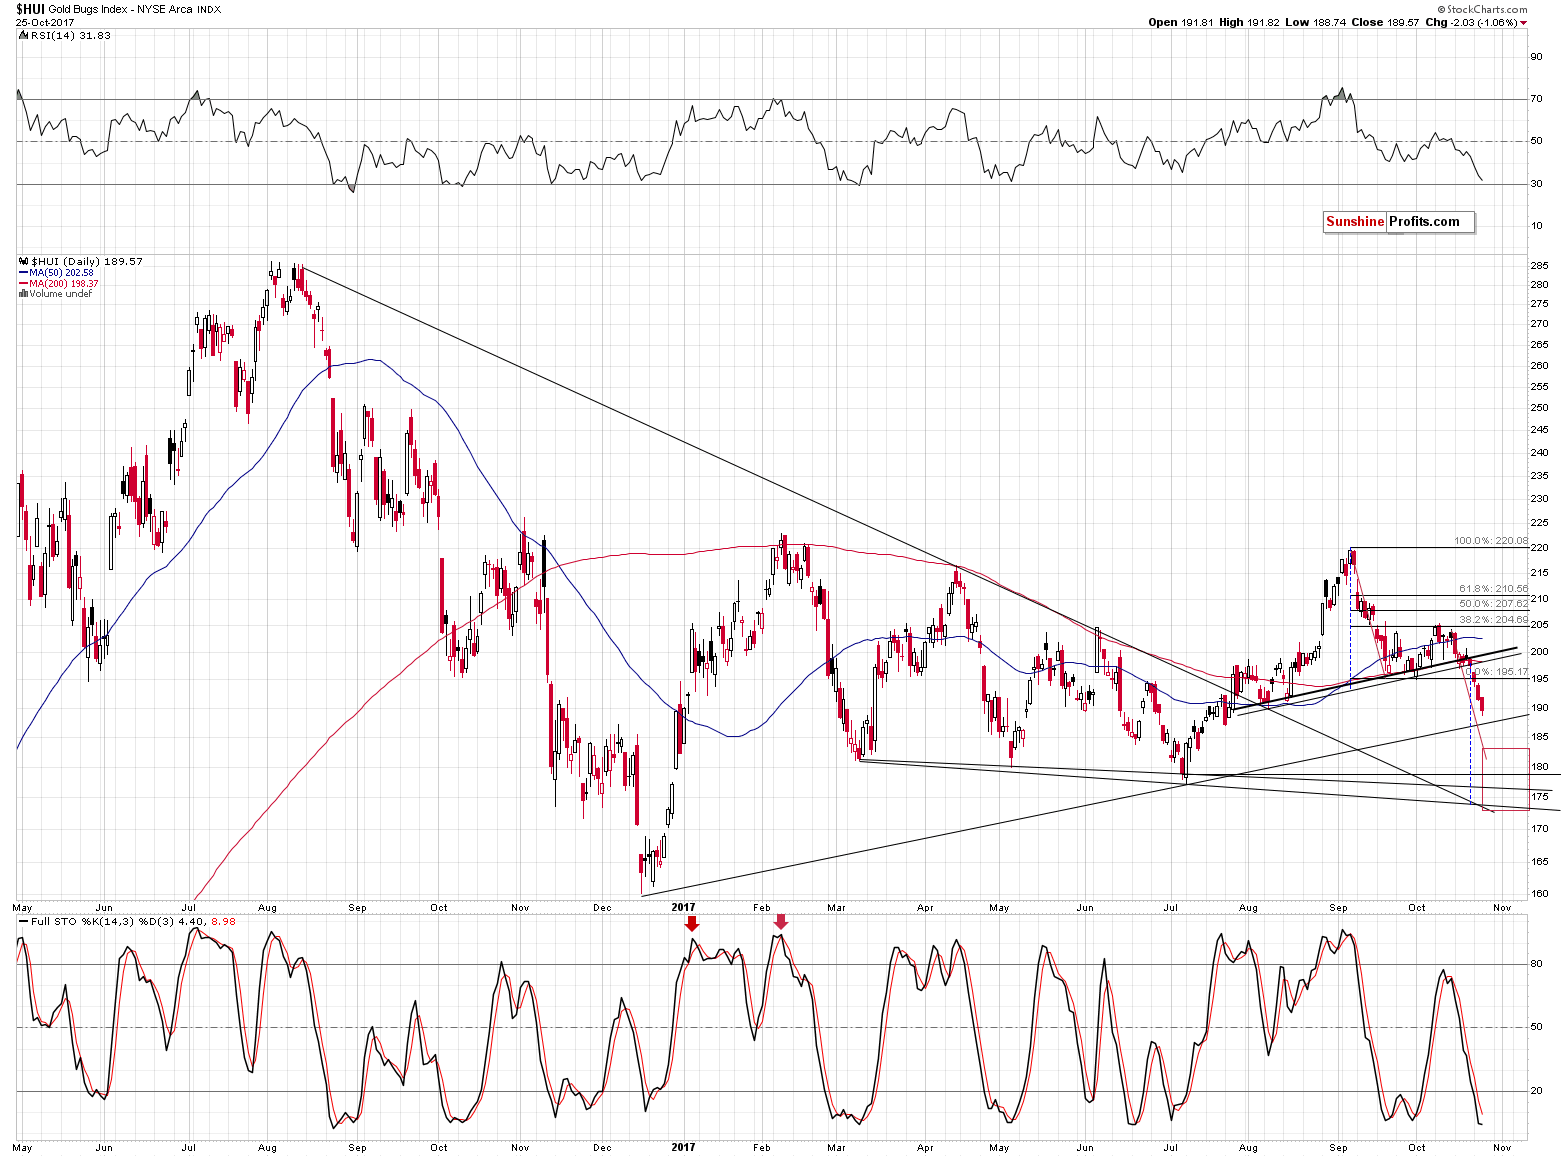
Gold was relatively unchanged and gold stocks declined once again. The extraordinary weakness in mining stocks continues and the bearish implications remain in place – based on yesterday’s session, the current situation is even more similar to the pre-2013-plunge trading.
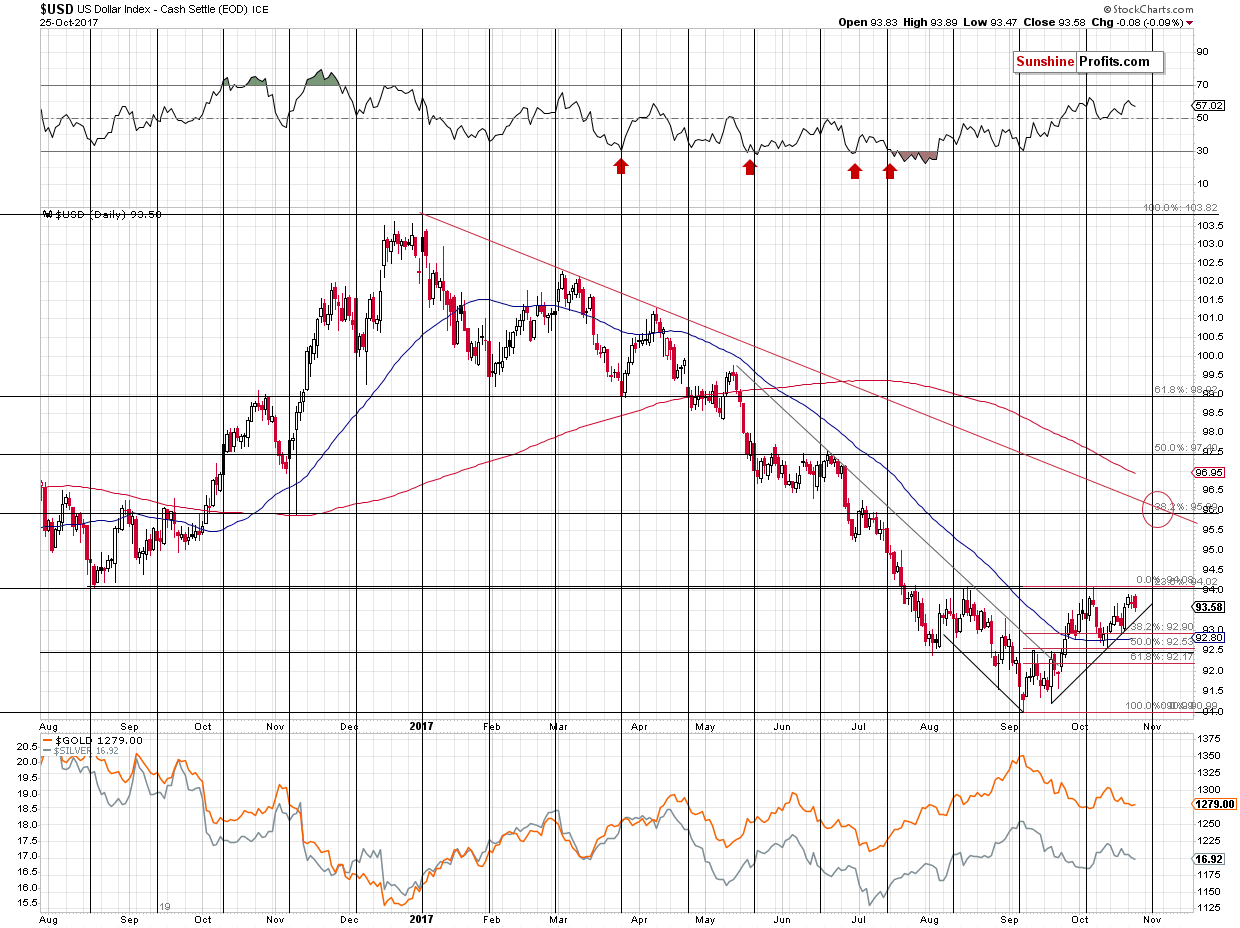
The USD Index declined yesterday, which may seem bearish, but it’s not. The move was small and didn’t trigger any breakdowns. Let’s not forget that when the USD Index moved below the 94 level in July, it was trading back and forth just below it for almost a week. Consequently, since the September - October rally is to a big extent a mirror image of the late-July-August decline, a week of back and forth movement below 94 shouldn’t come as a surprise. If the USD declines significantly and moves below 92.5, it could be a reason for concern. For now, it doesn’t seem that we are close to such a move – a breakout above 94 any day now seems much more likely.
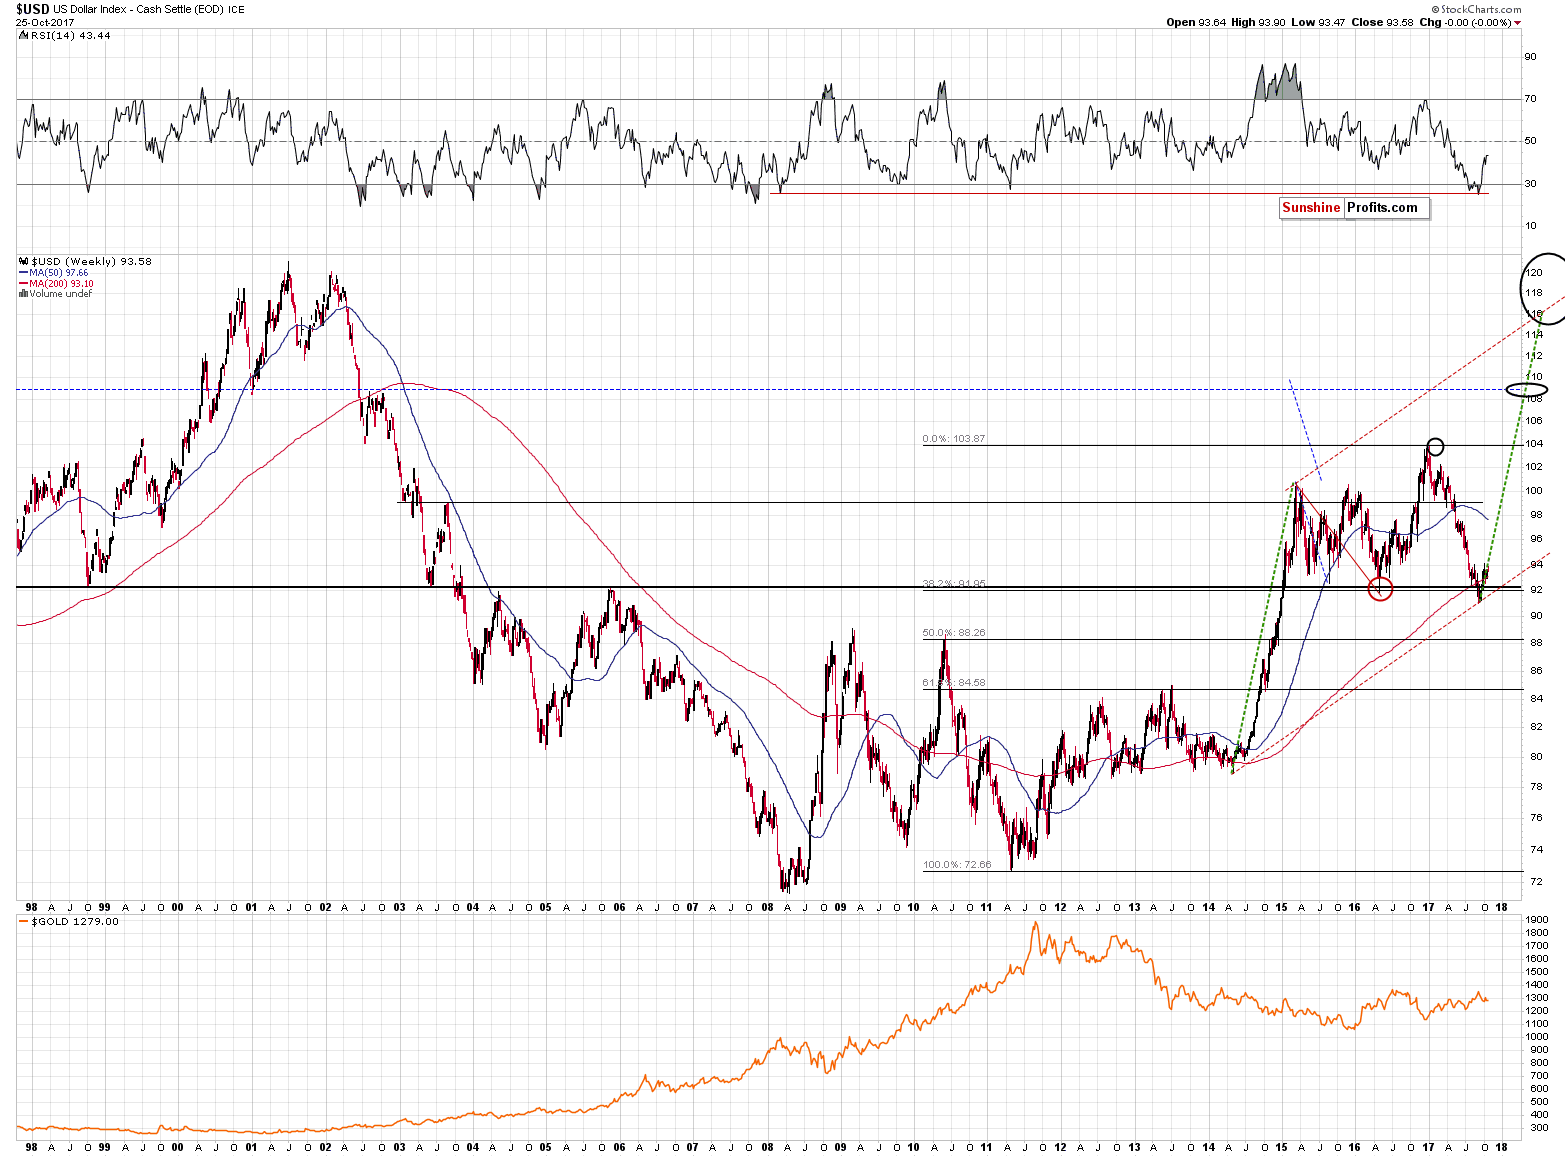
Moreover, let’s not forget that the upside for this market is very significant, so the current daily corrections are not that important.
Summing up, the outlook for the precious metals market remains bearish for the following months and weeks and there are multiple signs that confirm it: gold’s huge monthly volume, the analogy in the HUI Index, the analogy between the two most recent series of interest rate hikes, the breakout in Nikkei and the RSI signal from gold priced in the Japanese yen.
As far as the following weeks are concerned, it seems that we could see another rebound during the decline, but not likely until gold moves to the $1,200 - $1,220 range, which is likely to take place in the first half of November. The analogous range for the USD Index is 95.5 – 96.5 with the 96 level being the most likely target.
As always, we will keep you – our subscribers – informed.
To summarize:
Trading capital (supplementary part of the portfolio; our opinion): Short positions (150% of the full position) in gold, silver and mining stocks are justified from the risk/reward perspective with the following stop-loss orders and exit price levels / profit-take orders:
- Gold: exit price: $1,218; stop-loss: $1,366; exit price for the DGLD ETN: $51.98; stop-loss for the DGLD ETN $38.74
- Silver: exit price: $15.82; stop-loss: $19.22; exit price for the DSLV ETN: $28.88; stop-loss for the DSLV ETN $17.93
- Mining stocks (price levels for the GDX ETF): exit price: $21.23; stop-loss: $26.34; exit price for the DUST ETF: $29.97; stop-loss for the DUST ETF $21.37
In case one wants to bet on junior mining stocks' prices (we do not suggest doing so – we think senior mining stocks are more predictable in the case of short-term trades – if one wants to do it anyway, we provide the details), here are the stop-loss details and exit prices:
- GDXJ ETF: exit price: $30.28; stop-loss: $45.31
- JDST ETF: exit price: $66.27; stop-loss: $43.12
Long-term capital (core part of the portfolio; our opinion): No positions (in other words: cash)
Insurance capital (core part of the portfolio; our opinion): Full position
Important Details for New Subscribers
Whether you already subscribed or not, we encourage you to find out how to make the most of our alerts and read our replies to the most common alert-and-gold-trading-related-questions.
Please note that the in the trading section we describe the situation for the day that the alert is posted. In other words, it we are writing about a speculative position, it means that it is up-to-date on the day it was posted. We are also featuring the initial target prices, so that you can decide whether keeping a position on a given day is something that is in tune with your approach (some moves are too small for medium-term traders and some might appear too big for day-traders).
Plus, you might want to read why our stop-loss orders are usually relatively far from the current price.
Please note that a full position doesn’t mean using all of the capital for a given trade. You will find details on our thoughts on gold portfolio structuring in the Key Insights section on our website.
As a reminder – “initial target price” means exactly that – an “initial” one, it’s not a price level at which we suggest closing positions. If this becomes the case (like it did in the previous trade) we will refer to these levels as levels of exit orders (exactly as we’ve done previously). Stop-loss levels, however, are naturally not “initial”, but something that, in our opinion, might be entered as an order.
Since it is impossible to synchronize target prices and stop-loss levels for all the ETFs and ETNs with the main markets that we provide these levels for (gold, silver and mining stocks – the GDX ETF), the stop-loss levels and target prices for other ETNs and ETF (among other: UGLD, DGLD, USLV, DSLV, NUGT, DUST, JNUG, JDST) are provided as supplementary, and not as “final”. This means that if a stop-loss or a target level is reached for any of the “additional instruments” (DGLD for instance), but not for the “main instrument” (gold in this case), we will view positions in both gold and DGLD as still open and the stop-loss for DGLD would have to be moved lower. On the other hand, if gold moves to a stop-loss level but DGLD doesn’t, then we will view both positions (in gold and DGLD) as closed. In other words, since it’s not possible to be 100% certain that each related instrument moves to a given level when the underlying instrument does, we can’t provide levels that would be binding. The levels that we do provide are our best estimate of the levels that will correspond to the levels in the underlying assets, but it will be the underlying assets that one will need to focus on regarding the signs pointing to closing a given position or keeping it open. We might adjust the levels in the “additional instruments” without adjusting the levels in the “main instruments”, which will simply mean that we have improved our estimation of these levels, not that we changed our outlook on the markets. We are already working on a tool that would update these levels on a daily basis for the most popular ETFs, ETNs and individual mining stocks.
Our preferred ways to invest in and to trade gold along with the reasoning can be found in the how to buy gold section. Additionally, our preferred ETFs and ETNs can be found in our Gold & Silver ETF Ranking.
As a reminder, Gold & Silver Trading Alerts are posted before or on each trading day (we usually post them before the opening bell, but we don't promise doing that each day). If there's anything urgent, we will send you an additional small alert before posting the main one.
=====
Latest Free Trading Alerts:
This week, positive data on the U.S. economy was released, but the markets have seemed to focus on today’s ECB meeting. What does it mean for the gold market?
U.S. Economic Data, ECB, and Gold
Although the euro increased against the greenback yesterday, important resistances continue to keep gains in check. But will they withstand the buying pressure in the coming week?
EUR/USD - For Currency Bulls or Bears?
S&P 500 index lost 0.5% on Wednesday, as investors' sentiment slightly worsened following quarterly earnings, economic data releases. Is this a new downtrend or just downward correction?
More Volatility As Stocks Retrace Some Of Their Recent Rally
=====
Hand-picked precious-metals-related links:
PRECIOUS-Gold steadies on weaker dollar; markets brace for ECB decision
‘Gems and jewellery business down 70 percent’
=====
In other news:
What to Expect From the ECB Meeting
Pound Falls as Brexit Concerns Outweigh BOE Hike Prospects
Yellen Wonders If Fed Inflation Credibility Dented on Her Watch
Greece is on track to exit its bailout plan but doubts over its future remain
Spanish markets rise on report of possible Catalan election
Bitcoin Survives Second Split, New Bitcoin Gold Plummets Over 60%
=====
Thank you.
Sincerely,
Przemyslaw Radomski, CFA
Founder, Editor-in-chief, Gold & Silver Fund Manager
Gold & Silver Trading Alerts
Forex Trading Alerts
Oil Investment Updates
Oil Trading Alerts

