

Briefly: in our opinion, full (250% of the regular size of the position) speculative short positions in gold, silver and mining stocks are justified from the risk/reward perspective at the moment of publishing this alert.
As far as yesterday’s session is concerned, there is no doubt that the mining stocks stole the spotlight. Not much happened in gold, silver and currencies, but miners rallied in a visible manner. Surely, there were many factors pointing to the lower precious metals prices, but given this kind of strength in the mining stocks, maybe the bottom is actually in?
As it is the case on each and every trading day, the bottom may be in or it may not be in. Trading is a game of probabilities, just like a game of poker is. You can never be 100% sure what the result is going to be and you have to take on calculated risk.
The difference between gambling and investing is the research. And if you’ve been following our analyses for at least several days, you know that we’ve been researching the precious metals market extensively. Yesterday, we wrote a big Alert with multiple reasons due to which PMs are likely to decline in a profound manner in the following weeks and we also previously wrote a big summarizing article that had the same bottom line.
Both analyses included multiple links to other analyses that further validate the bearish case. And practically all these strong bearish points remain up-to-date.
What may seem to be an exception from the above rule, and a bullish factor is the recently strong performance of the mining stocks. Consequently, in today’s Alert, we’ll examine them even more thoroughly than we usually do. After all, we are generally more interested in discovering and discussing developments that might invalidate our currently held opinion, than in examining the ones that confirm it.
Let’s move right into charts (charts courtesy of http://stockcharts.com).
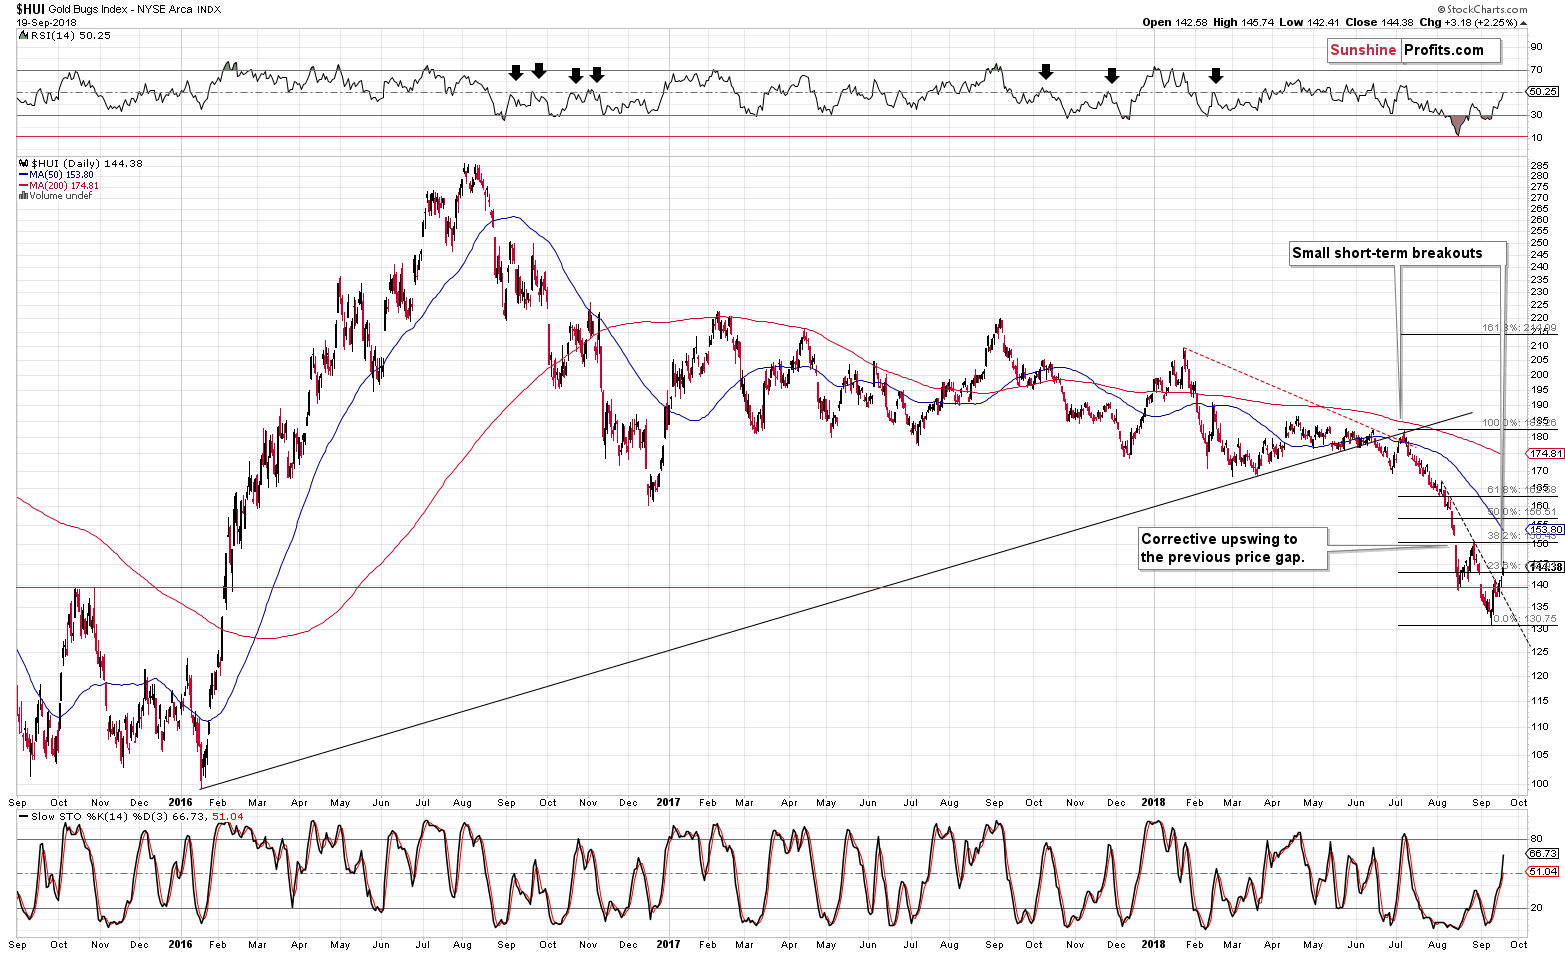
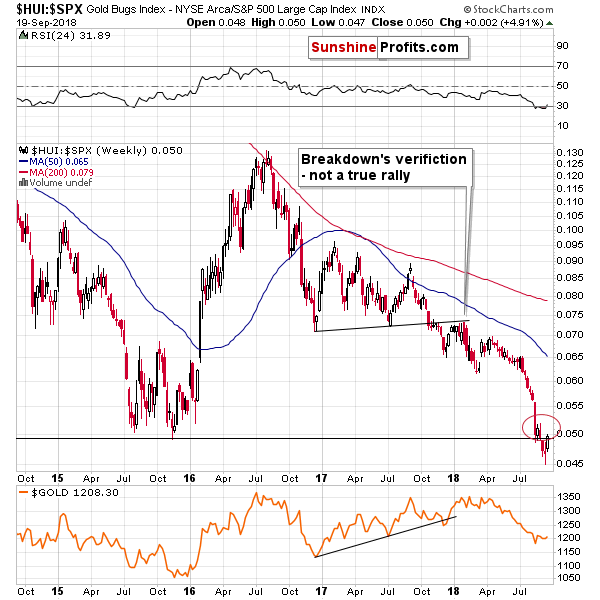
The HUI Index moved above the near-term resistance levels and above the declining short-term resistance line. This has bullish implications for the short term. The possible upside based on the above chart is another re-test of the 150 level – the 2008 bottom, the most recent local high, and the 38.2% Fibonacci retracement level.
The above paragraph is bullish, which may be surprising at the first sight as you already read in the brief summary that short positions remain favored. This shouldn’t be the case – we are reporting things as they are and we are not afraid to report things that contradict our current overall views. We strive to remain objective at all times as that’s what creates value, while being biased destroys it.
Still, just because the above single paragraph is bullish, it doesn’t mean that the risk to reward situation favors any different positions than te current one. In fact, in our view, that’s the only bullish factor that we have right now.
First of all, even on the above chart we can see a big warning sign in the form of the RSI indicator at about 50. That’s more or less where we had very often seen this indicator during the final parts of the counter-trend rallies that were parts of bigger declines. We marked those cases with black arrows on the above chart. The implication is that this rally is likely over or about to be over.
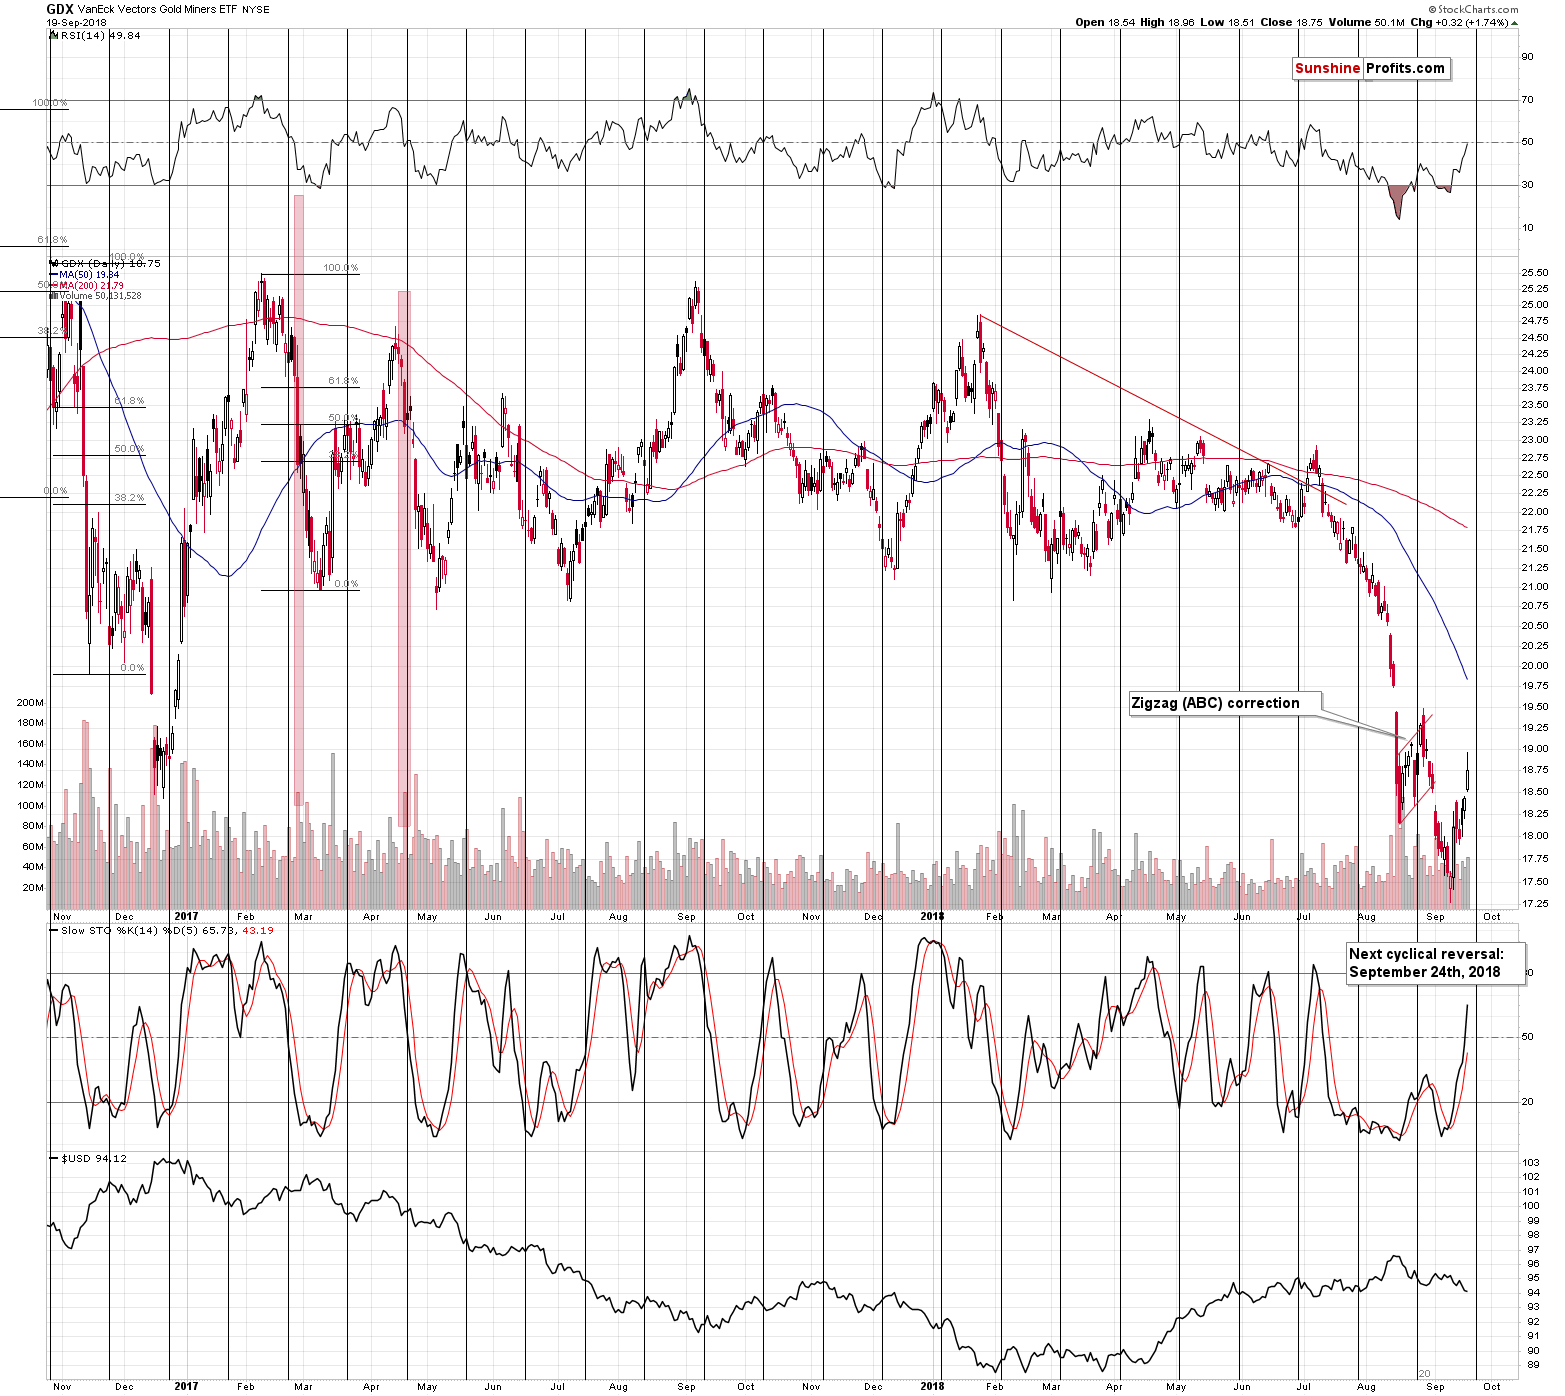
As we discussed yesterday, the next cyclical turning point is on Monday and since these points work on a near-to basis, it means that we could see a reversal any day now, perhaps even today. And perhaps we already saw it yesterday as the value of the GDX ETF declined before the end of the session. The volume was not huge enough to confirm yesterday’s reversal as a major shooting star reversal candlestick, but it was not very low either. Overall, the implications of yesterday’s daily candlestick are only somewhat bearish.
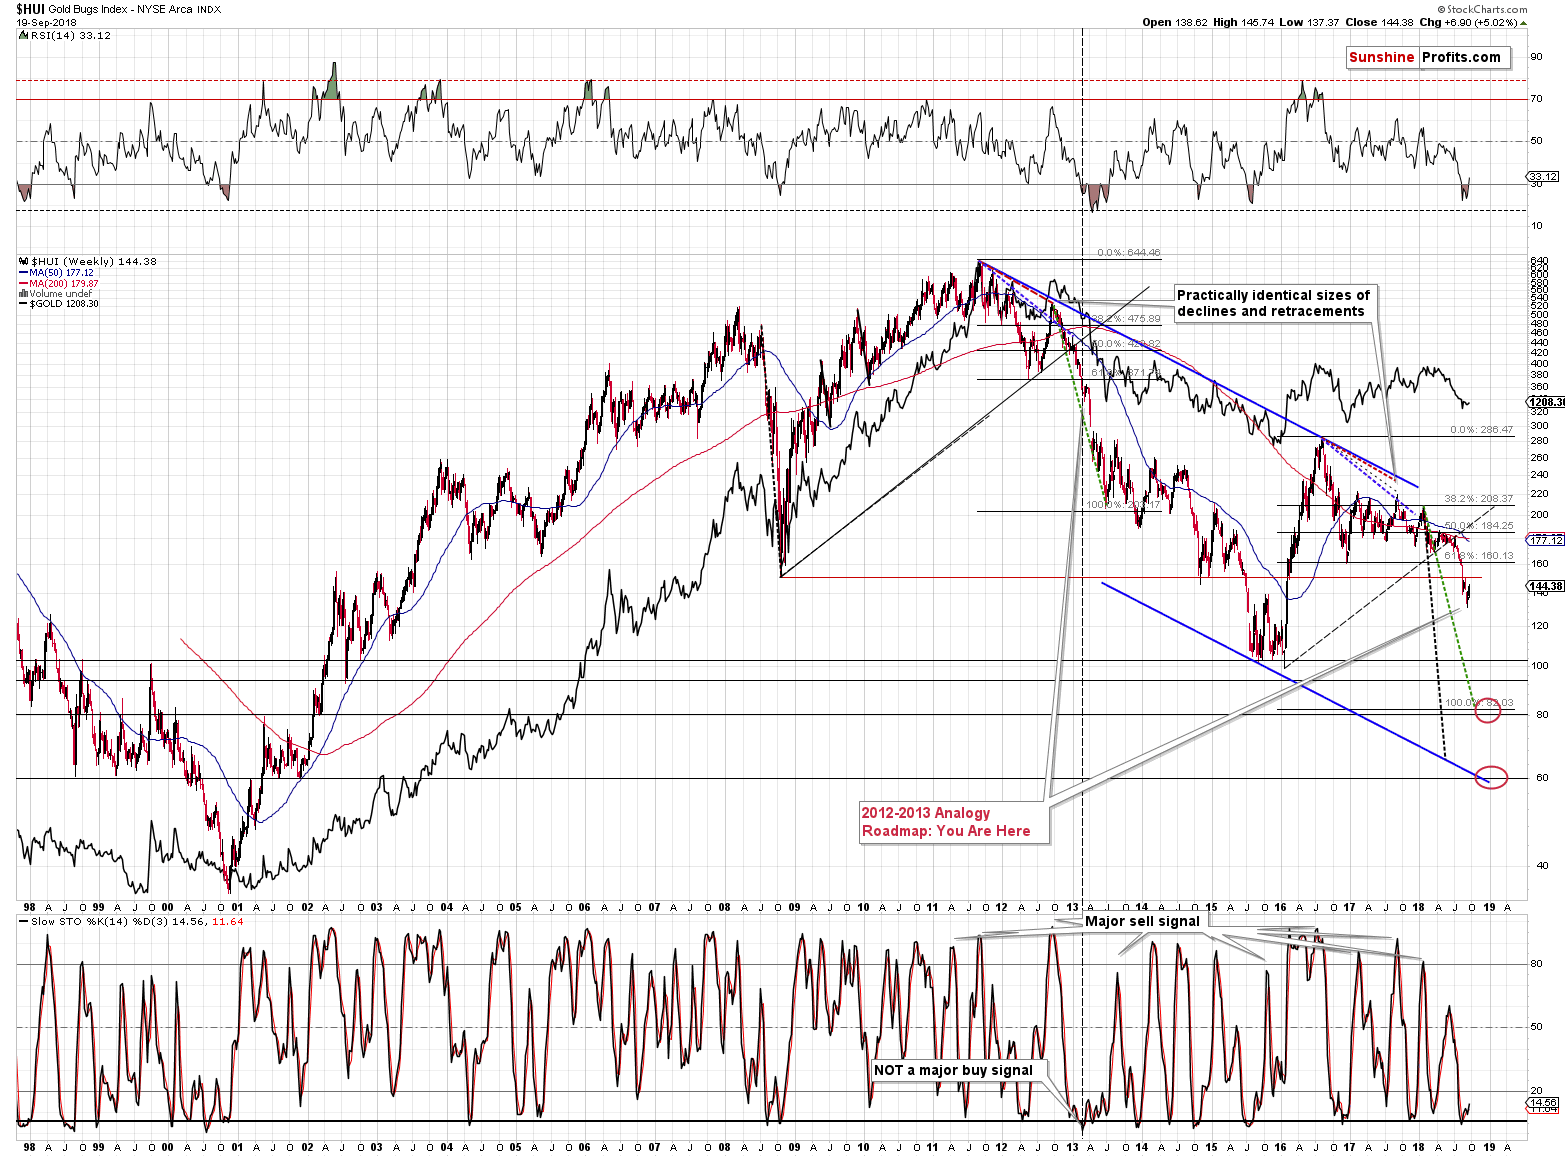
From the long-term point of view, nothing changed based on the most recent upswing. Gold stocks remain below their key resistance created by the 2008 bottom.
Moreover, they provide a perfect confirmation of the analogy to 2013. Back in April, 2013, the Stochastic indicator was right after buy signal from extremely oversold levels (but below 20) and the RSI was just after a comeback above the 30 level. This is in perfect tune with what we are seeing right now. It’s an extremely accurate repeat of the previous pattern, not something bullish.
The implications are strongly bearish.
But, the research involving gold stocks is not only about what happens in gold stocks. It’s also about what happens in its surroundings.
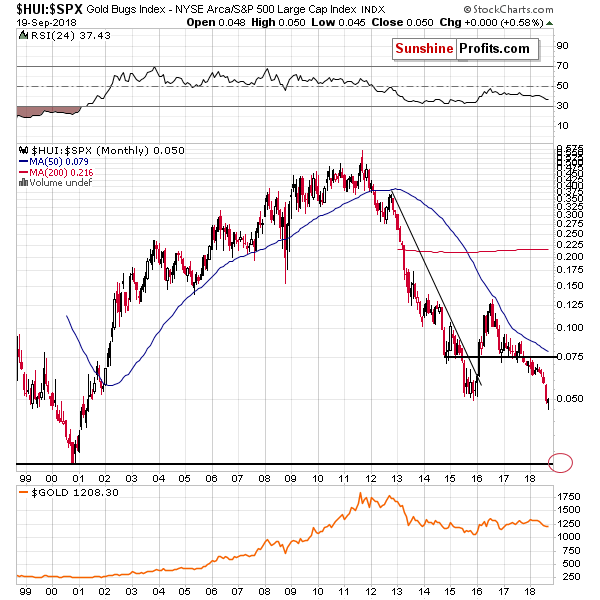
Some time ago, we reported the breakdown in the gold stocks to other stocks ratio. The implications were profoundly bearish for the medium term and they still are. The thing is…
That this breakdown is being verified. The ratio moved slightly above its previous low in intraday terms, but intraday values are of little meaning in case of such long-term price moves. In terms of the closing prices, the breakdown was not invalidated. Conversely, the ratio moved back to the 2015 lows, which suggests that the end of the rally is at hand or it was already reached.
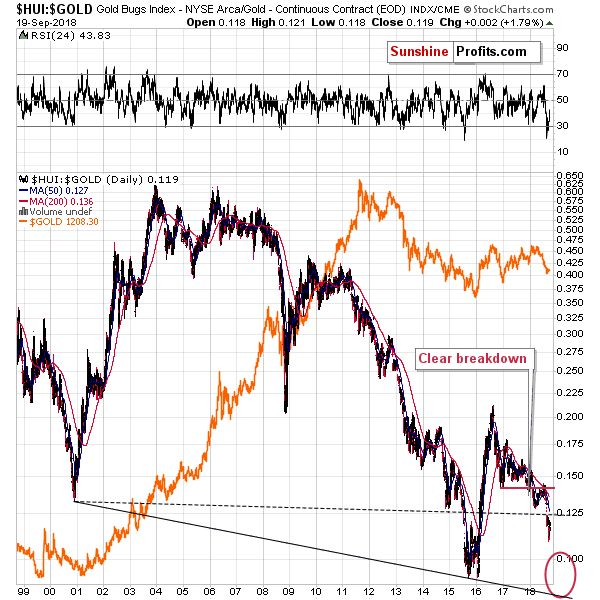
Gold stocks to gold ratio is also after a major breakdown and the trend is clearly down as there was no invalidation of the move below the slightly declining dashed line.
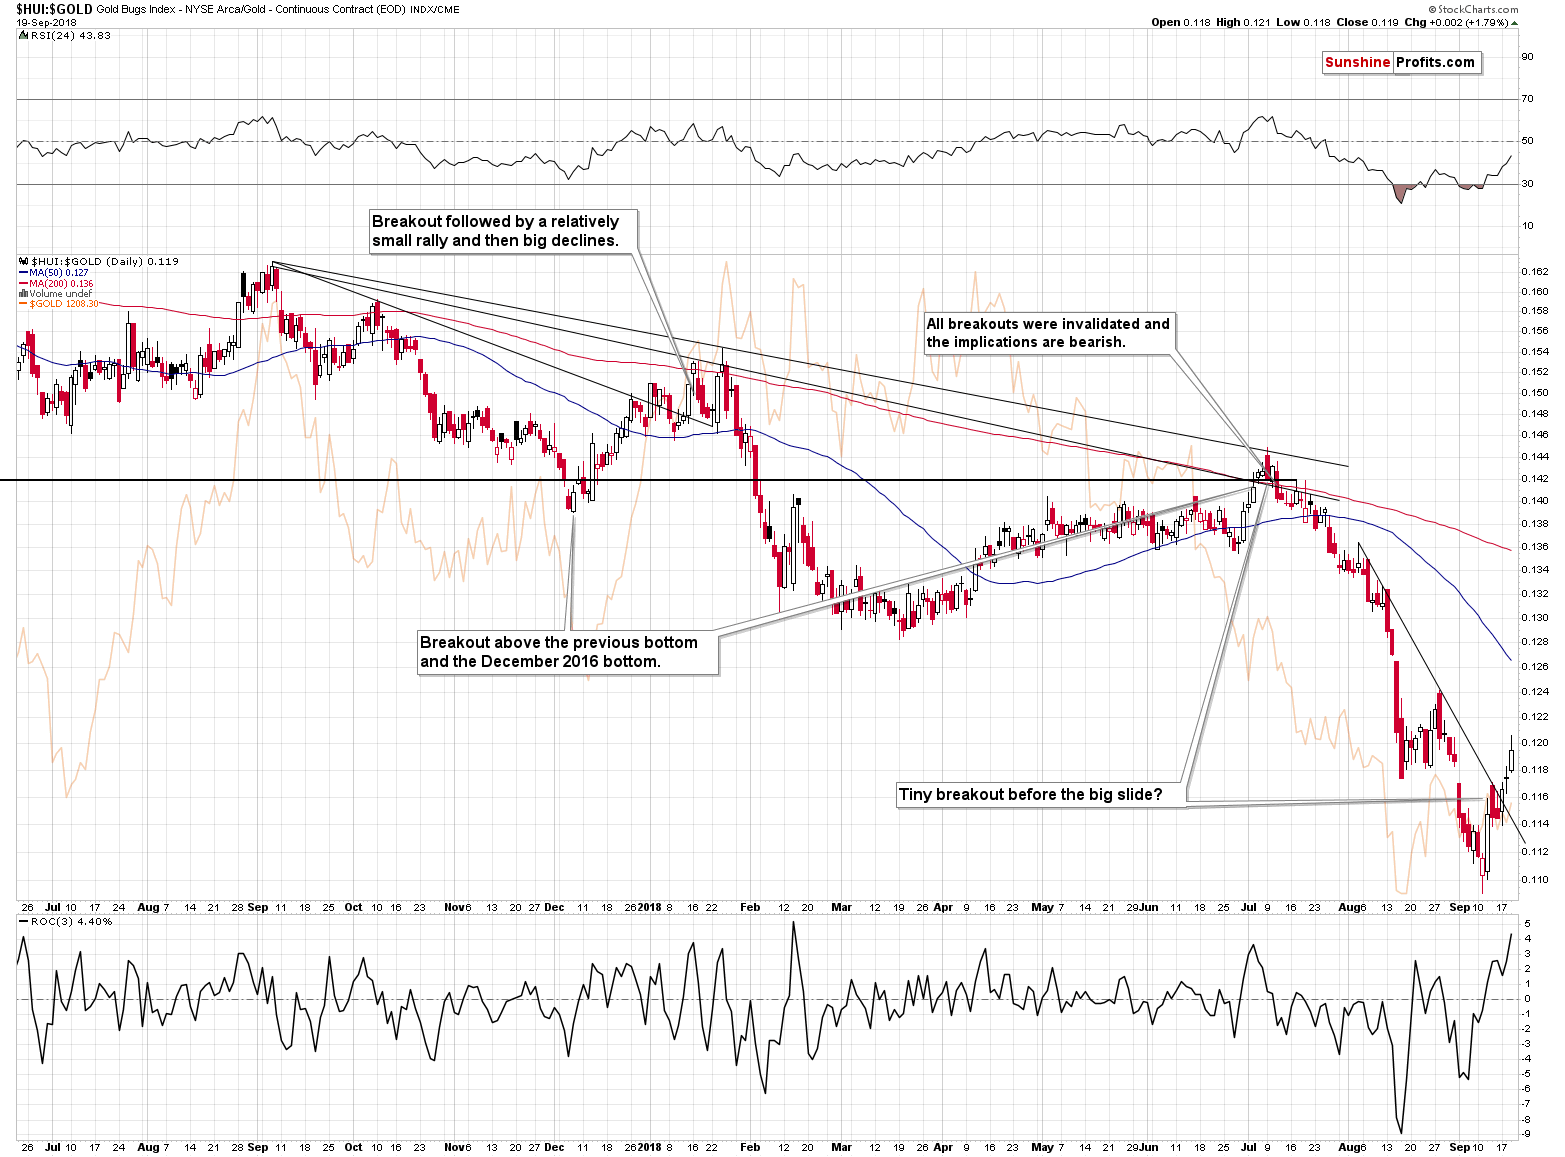
The very short-term resistance line was broken, but it’s hard to call that bullish, as the previous declines in the ratio often started right after short-term breakouts. There were two significant declines in the ratio this year and small breakouts were seen before both of them.
So, doesn’t the price increase in the value of the HUI Index imply anything? It does. It tells us that the triangle-vertex-based reversals that we created many weeks ago remain a very important timing tool. This could be invaluable insight in the following weeks as we move closer to THE final bottom.
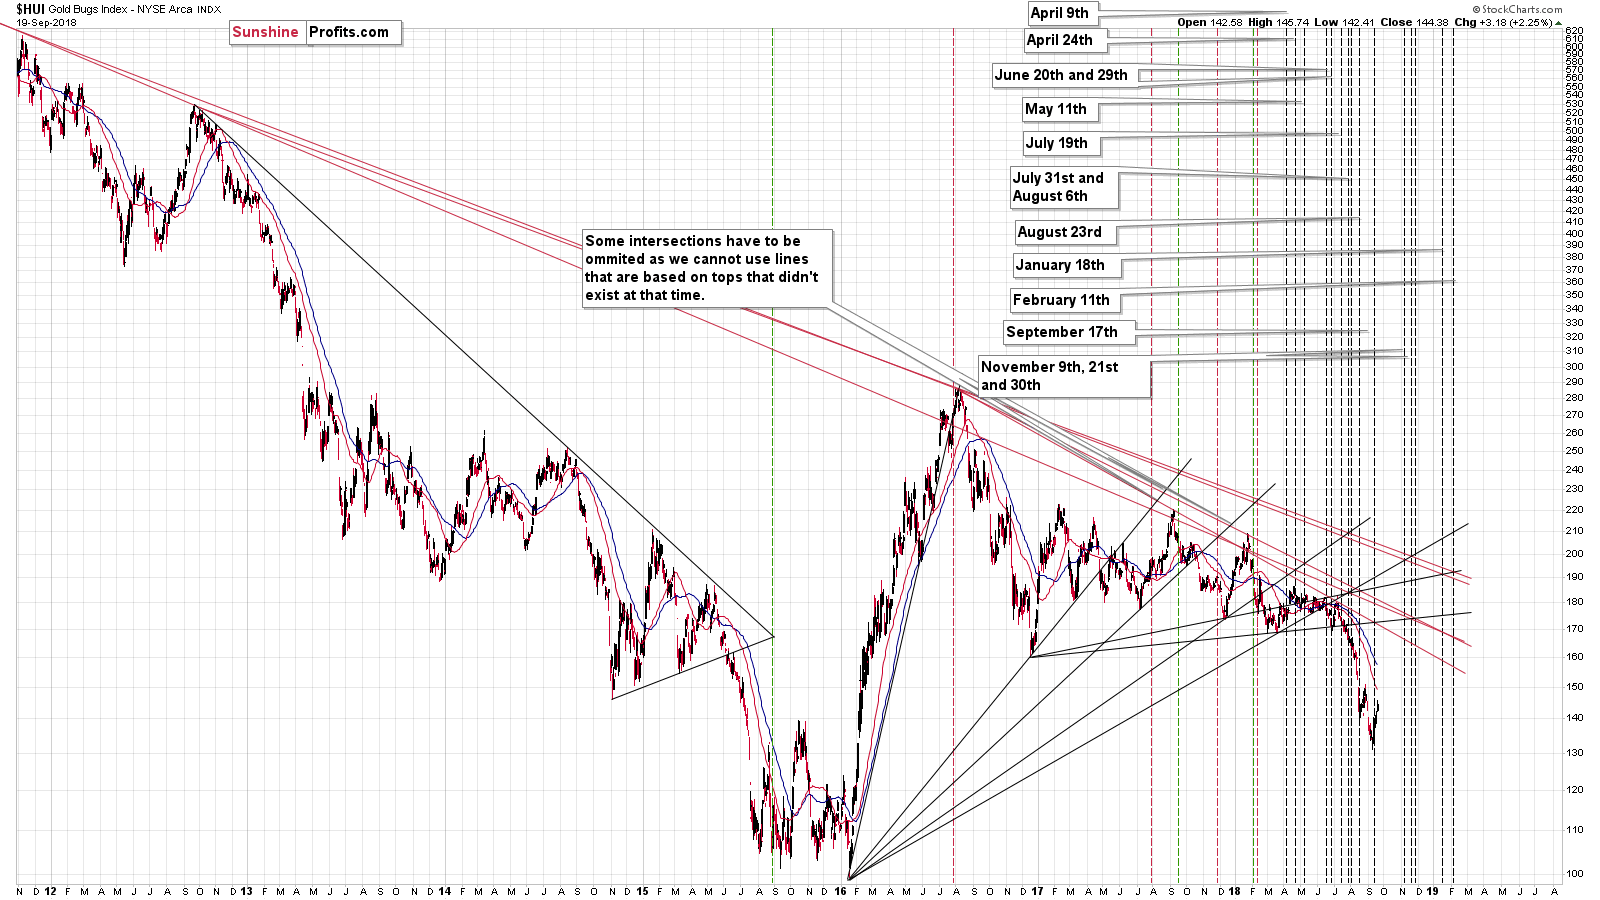
Gold stocks reversed practically right at the most recent reversal. The reversal that preceded it was followed by the late-August rally. Please note that the February 2018 rally that followed the sharp decline was also temporarily reversed after HUI’s triangle-vertex-based reversal. Why does it matter? Because that situation is very similar to what we have right now and guess when the rally stopped back then... When the RSI moved to about 50 and that’s one of the cases that we marked with black arrows on the first chart of today’s analysis.
Summing up, only part of one of all the mining stock charts that we featured today has bullish implications, and it’s a part of the short-term chart. The long-term signals are generally more important than the short-term ones, so the overall implications of the situation in the mining stocks are unclear in case of the next few (0-3) days, but bearish thereafter. And very bearish for the following weeks.
The upside seems limited in terms of both: price (150 in the HUI Index) and time (the turning point is on Monday, so the odds are that the reversal will take place shortly, perhaps even today, but even a reversal on Tuesday would not be anything odd).
The analogous price level for the GDX is $19.50, and about $34 in case of the DUST.
Given all the bearish indications that we featured above, the multiple similarities to 2013 that we discussed yesterday and myriads of strong, bearish signals that we covered in the preceding Alerts, it seems that keeping the short positions intact is justified from the risk to reward perspective, even in light of the above-discussed possibility. It simply makes little sense to risk missing out on enormous profits only to save a little in the meantime.
Having said that, let’s move to other interesting developments. We will not cover gold or silver as nothing really changed in them, but we will feature the ratio between the SLV and GLD.
Strong Top-is-at-Hand Signal from the SLV to GLD Ratio
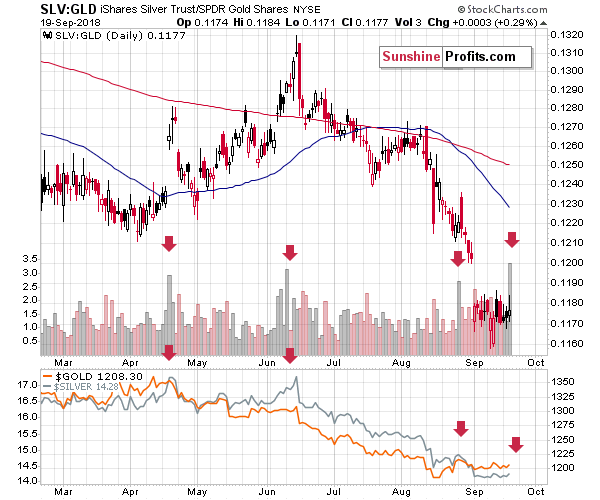
The above chart is quite self-explanatory. The red arrows mark cases when we saw huge volume spikes in the ratio. More precisely, they show spikes in the ratio of volumes, as the ratio, by itself, doesn’t have any volume.
On numerous occasions, we wrote that silver tends to be the metal of choice right before the local tops and before sizable price declines. We don’t want to get into details here, because it’s already after 8 AM EST, and we want to get this analysis to you ASAP, but we want to say that this phenomenon can be seen not only through the relative price movement, but also when looking at volume levels.
This is particularly useful right now, given the long-term breakout in the gold to silver ratio and the technical inability of silver to really outperform gold.
The spike in the ratio of volumes was the highest in months, which makes it very likely that we are at a major top or very close to one. We saw this signal a few times earlier this year and, in all cases, big price declines in gold and silver followed – if not immediately, then shortly.
Platinum’s Breakdown
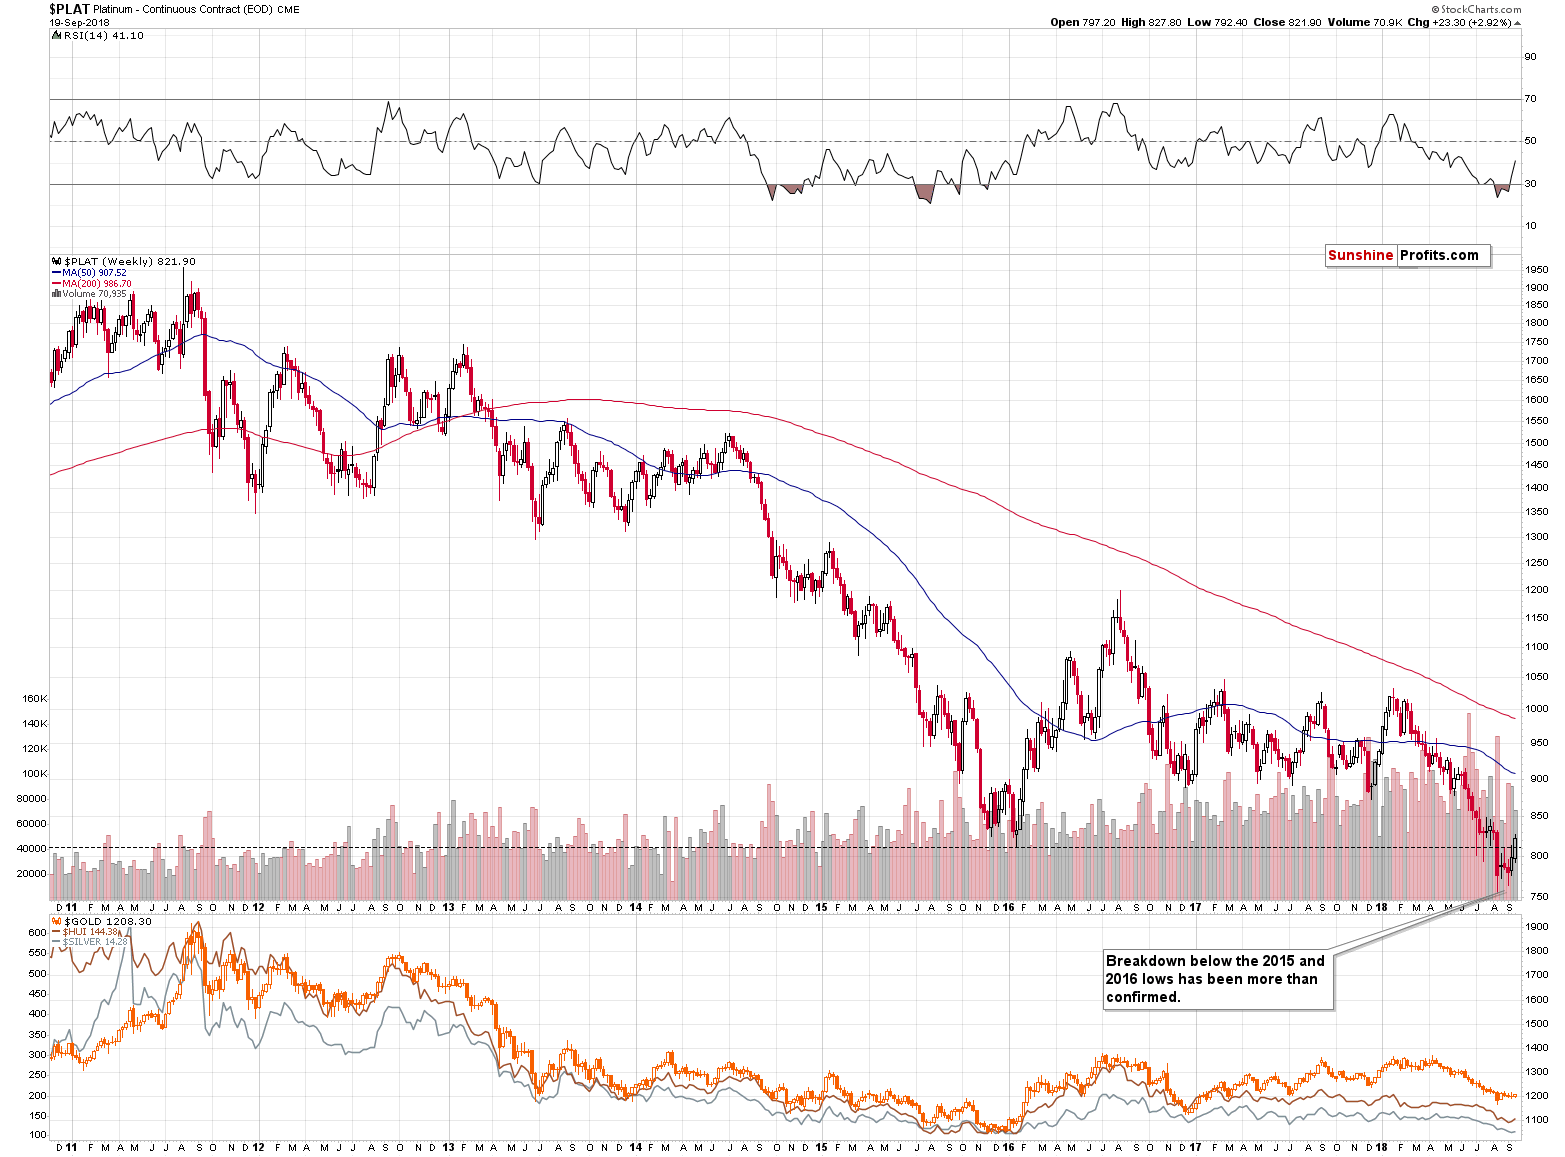
Moreover, the price of platinum is moving to its critical resistance created by the 2016 lows, below which it broke earlier this year. To be precise, platinum already moved above the intraday lows of 2016, but the intraday moves are not as important as the ones based on the closing prices. This means that platinum is still likely to reverse as the long-term resistance is both: at hand, and unbroken.
The implications for the entire precious metal sector are bearish.
Currency Comments
The USD Index moved substantially lower today, most likely as a result of what goes on in the UK. Remember when – in 2016 – we wrote that there will probably be no Brexit as The Powers That Be still have some aces up their sleeves not to let it happen? It was only a matter of figuring out how to do it so that it doesn’t look like it was artificially changed and without any prevailing politician looking stupid. And here we are. We don’t want to get into details as they are not that important – the point is that there are first signs that there will be no Brexit after all. It’s very far from being certain and it’s not even spoken about loudly, but the signs are everywhere (for instance on the sign that’s visible on the picture in the above-linked article).
What does it mean for us – precious metals traders and investors? Shortly after the results of the Brexit vote were announced, gold soared by about $100 and the euro declined. While the impact on the currency market can be different this time as the interest rates are on the rise in the US, the impact on the gold price should be very negative.
Based on today’s lack of real action on the gold market (gold is up by $3, while the USD Index is down by 0.63), the above implications are not clear for investors and traders, but they will be getting clearer. And gold will most likely take a dive. It’s likely based on multiple technical factors, but we now also have a good fundamental trigger (it was not required, though).
Important Analyses
Before summarizing, we would like to emphasize that we have recently posted several analyses that are very important and that one should keep in mind, especially in the next several weeks. If you haven’t had the chance of reading them previously, we encourage you to do so today:
- Dear Gold Investor - Letters from 2013 - Analogy to 2013, which should make it easier to trade the upcoming sizable upswing (if enough factors point to it, that is) and to enter the market close to the final bottom.
- Gold to Soar Above $6,000 - discussion of gold’s long-term upside target of $6,000.
- Preparing for THE Bottom in Gold: Part 6 – What to Buy - extremely important analysis of the portfolio structure for the next huge, multi-year rally in the precious metals.
- Preparing for THE Bottom in Gold: Part 7 – Buy-and-hold on Steroids - description of a strategy dedicated to significantly boosting one’s long-term investment returns while staying invested in the PM sector.
- Gold’s Downside Target, Upcoming Rebound, and Miners’ Buy Plan - details regarding the shape of the following price moves, a buying plan for mining stocks, and a brief discussion of the final price targets for the current decline.
- Gold: What Happened vs. What Changed - discussion of the latest extreme readings from gold’s CoT report
- Key Factors for Gold & Silver Investors - discussion of key, long-term factors that support the bearish outlook for PMs. We are often asked what makes us so bearish – this article is a reply to this question.
- The Upcoming Silver Surprise - two sets of price targets for gold, silver and mining stocks: the initial and the final one.
- Precious Metals Sector: It’s 2013 All Over Again - comparison between 2013 and 2018 throughout the precious metals sector, the general stock market and the USD Index. Multiple similarities point to the repeat of a 2013-style volatile decline in the PMs.
Summary
Summing up, the situation on the precious metals market remains very bearish, as it’s likely that we are right before a major plunge, similar to the one that we saw in April, 2013. This is confirmed not only by what we’re seeing in the gold market, but also by what’s happening in silver, mining stocks, USD Index and the general stock market. It seems that the big profits on our short positions will become much bigger before this trade is completely over.
At the same time however, it might be the case the HUI Index rallies back to 150 or so (analogous price levels for GDX and DUST $19.50, and about $34, respectively, before turning south with vengeance. The next cyclical turning point is on Monday, so any strength here is likely to be limited in terms of time as well. Since it’s likely that the possible short-term upside is limited, and the possible downside is huge, it’s still justified from the risk to reward point of view to keep the profitable speculative short positions intact.
As a reminder, we had taken profits from the previous long positions and had simultaneously opened short positions on July 10, 2018 and we increased the size of the position in the following days. On July 10, the GDX ETF closed at $22.60, and the DUST ETF closed at $23.29. Gold closed at $1,255.40, and silver closed at $16.09. The DGLD and DSLV ETFs closed at $49.18, and $26.15, respectively. Positions in all of the above remain very profitable, especially the position in the DUST. Naturally, the above doesn’t mean what encourage using leverage to everyone – it’s usually better to keep the positions too small than too big, as you can read in the second half of this essay.
As always, we’ll keep you – our subscribers – informed.
To summarize:
Trading capital (supplementary part of the portfolio; our opinion): Full short positions (250% of the full position) in gold, silver and mining stocks are justified from the risk/reward perspective with the following stop-loss orders and exit profit-take price levels:
- Gold: profit-take exit price: $1,062; stop-loss: $1,226; initial target price for the DGLD ETN: $82.96; stop-loss for the DGLD ETN $53.67
- Silver: profit-take exit price: $12.72; stop-loss: $15.16; initial target price for the DSLV ETN: $46.97; stop-loss for the DSLV ETN $31.37
- Mining stocks (price levels for the GDX ETF): profit-take exit price: $13.12; stop-loss: $19.61; initial target price for the DUST ETF: $80.97; stop-loss for the DUST ETF $33.37
Note: the above is a specific preparation for a possible sudden price drop, it does not reflect the most likely outcome. You will find a more detailed explanation in our August 1 Alert. In case one wants to bet on junior mining stocks’ prices (we do not suggest doing so – we think senior mining stocks are more predictable in the case of short-term trades – if one wants to do it anyway, we provide the details), here are the stop-loss details and target prices:
- GDXJ ETF: profit-take exit price: $17.52; stop-loss: $29.43
- JDST ETF: initial target price: $154.97 stop-loss: $64.88
Long-term capital (core part of the portfolio; our opinion): No positions (in other words: cash)
Insurance capital (core part of the portfolio; our opinion): Full position
Important Details for New Subscribers
Whether you already subscribed or not, we encourage you to find out how to make the most of our alerts and read our replies to the most common alert-and-gold-trading-related-questions.
Please note that the in the trading section we describe the situation for the day that the alert is posted. In other words, it we are writing about a speculative position, it means that it is up-to-date on the day it was posted. We are also featuring the initial target prices, so that you can decide whether keeping a position on a given day is something that is in tune with your approach (some moves are too small for medium-term traders and some might appear too big for day-traders).
Plus, you might want to read why our stop-loss orders are usually relatively far from the current price.
Please note that a full position doesn’t mean using all of the capital for a given trade. You will find details on our thoughts on gold portfolio structuring in the Key Insights section on our website.
As a reminder – “initial target price” means exactly that – an “initial” one, it’s not a price level at which we suggest closing positions. If this becomes the case (like it did in the previous trade) we will refer to these levels as levels of exit orders (exactly as we’ve done previously). Stop-loss levels, however, are naturally not “initial”, but something that, in our opinion, might be entered as an order.
Since it is impossible to synchronize target prices and stop-loss levels for all the ETFs and ETNs with the main markets that we provide these levels for (gold, silver and mining stocks – the GDX ETF), the stop-loss levels and target prices for other ETNs and ETF (among other: UGLD, DGLD, USLV, DSLV, NUGT, DUST, JNUG, JDST) are provided as supplementary, and not as “final”. This means that if a stop-loss or a target level is reached for any of the “additional instruments” (DGLD for instance), but not for the “main instrument” (gold in this case), we will view positions in both gold and DGLD as still open and the stop-loss for DGLD would have to be moved lower. On the other hand, if gold moves to a stop-loss level but DGLD doesn’t, then we will view both positions (in gold and DGLD) as closed. In other words, since it’s not possible to be 100% certain that each related instrument moves to a given level when the underlying instrument does, we can’t provide levels that would be binding. The levels that we do provide are our best estimate of the levels that will correspond to the levels in the underlying assets, but it will be the underlying assets that one will need to focus on regarding the signs pointing to closing a given position or keeping it open. We might adjust the levels in the “additional instruments” without adjusting the levels in the “main instruments”, which will simply mean that we have improved our estimation of these levels, not that we changed our outlook on the markets. We are already working on a tool that would update these levels on a daily basis for the most popular ETFs, ETNs and individual mining stocks.
Our preferred ways to invest in and to trade gold along with the reasoning can be found in the how to buy gold section. Additionally, our preferred ETFs and ETNs can be found in our Gold & Silver ETF Ranking.
As a reminder, Gold & Silver Trading Alerts are posted before or on each trading day (we usually post them before the opening bell, but we don't promise doing that each day). If there's anything urgent, we will send you an additional small alert before posting the main one.
=====
Latest Free Trading Alerts:
Have we learned anything from Lehman Brothers’ bankruptcy? On Saturday, there was a 10-year anniversary of the symbolic beginning of the global financial crisis. So it’s a great opportunity to discuss lessons from the Lehman’s collapse and the post-crisis legacy for the gold market.
Stocks were mixed yesterday, as investors continued to hesitate following the recent advance. The S&P 500 index remains relatively very close to its late August new record high of 2,916.50. Will it break above that high? Or is this some topping pattern ahead of a downward reversal?
=====
Thank you.
Sincerely,
Przemyslaw Radomski, CFA
Founder, Editor-in-chief, Gold & Silver Fund Manager
Gold & Silver Trading Alerts
Forex Trading Alerts
Oil Investment Updates
Oil Trading Alerts

