

Briefly: in our opinion, full (250% of the regular size of the position) speculative short positions in gold, silver and mining stocks are justified from the risk/reward perspective at the moment of publishing this alert.
The white metal is something that is often forgotten as gold steals the spotlight. And incorrectly so, because it is often silver where the greatest opportunity lies. In today’s Alert we’ll focus on such opportunity and if we had to describe it in just one word, it would be “epic”.
Today’s Alert is going to be shorter than the previous ones as not much new happened yesterday, but we would still like to take this opportunity to remind you about a critical analogy in the silver market that we haven’t commented on recently. It’s easy to forget something or think that it’s no longer important if it’s not recalled on a more or less regular basis, and this factor definitely remains in place. And it’s really of critical importance.
But, before we move to silver, we would like to show you what happened in the USD Index.
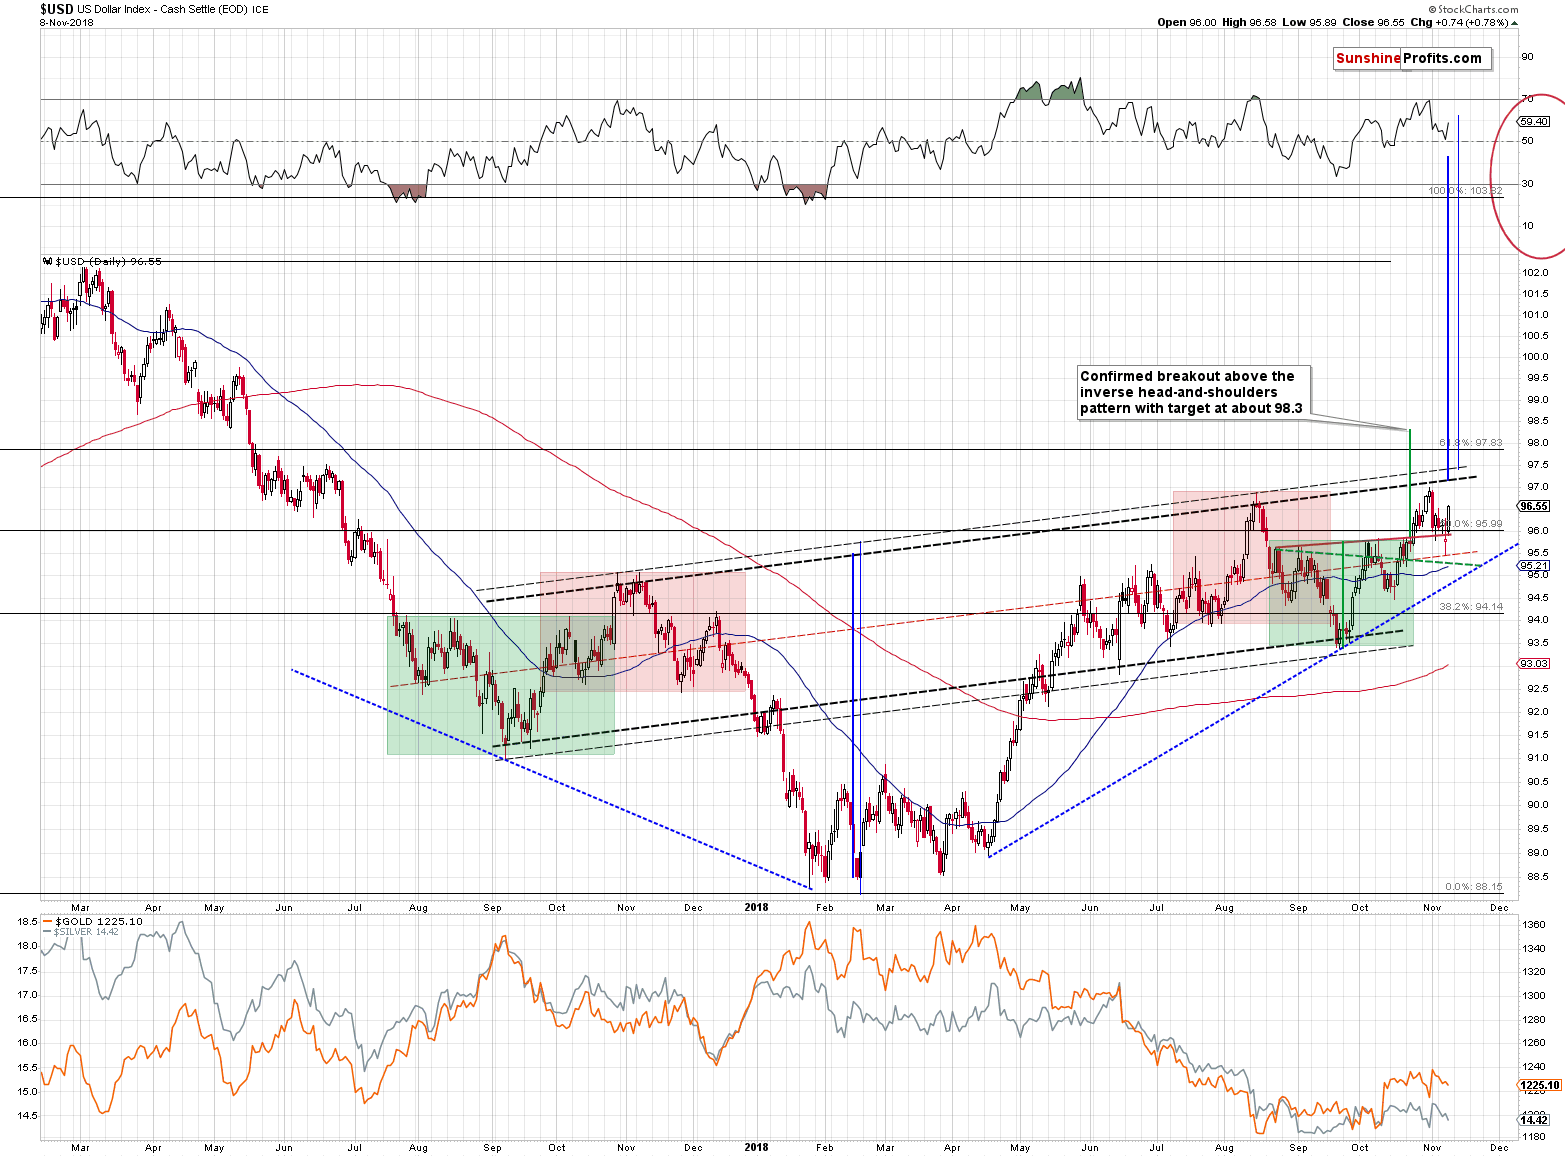
The USD moved higher after a very brief move back to the middle of its rising trading range that we marked with a red dashed line. It’s worth noting, because something similar happened in early August 2017 and since this year’s rally is the reflection of last year’s decline, it could mean that this was the bottom and that higher values of the USD Index will follow. The outlook for the medium term has been bullish for a long time, but this time it finally seems that the multi-month consolidation is over. The implications are very bearish for the precious metals sector.
Having said that, let’s take a look at the silver market.
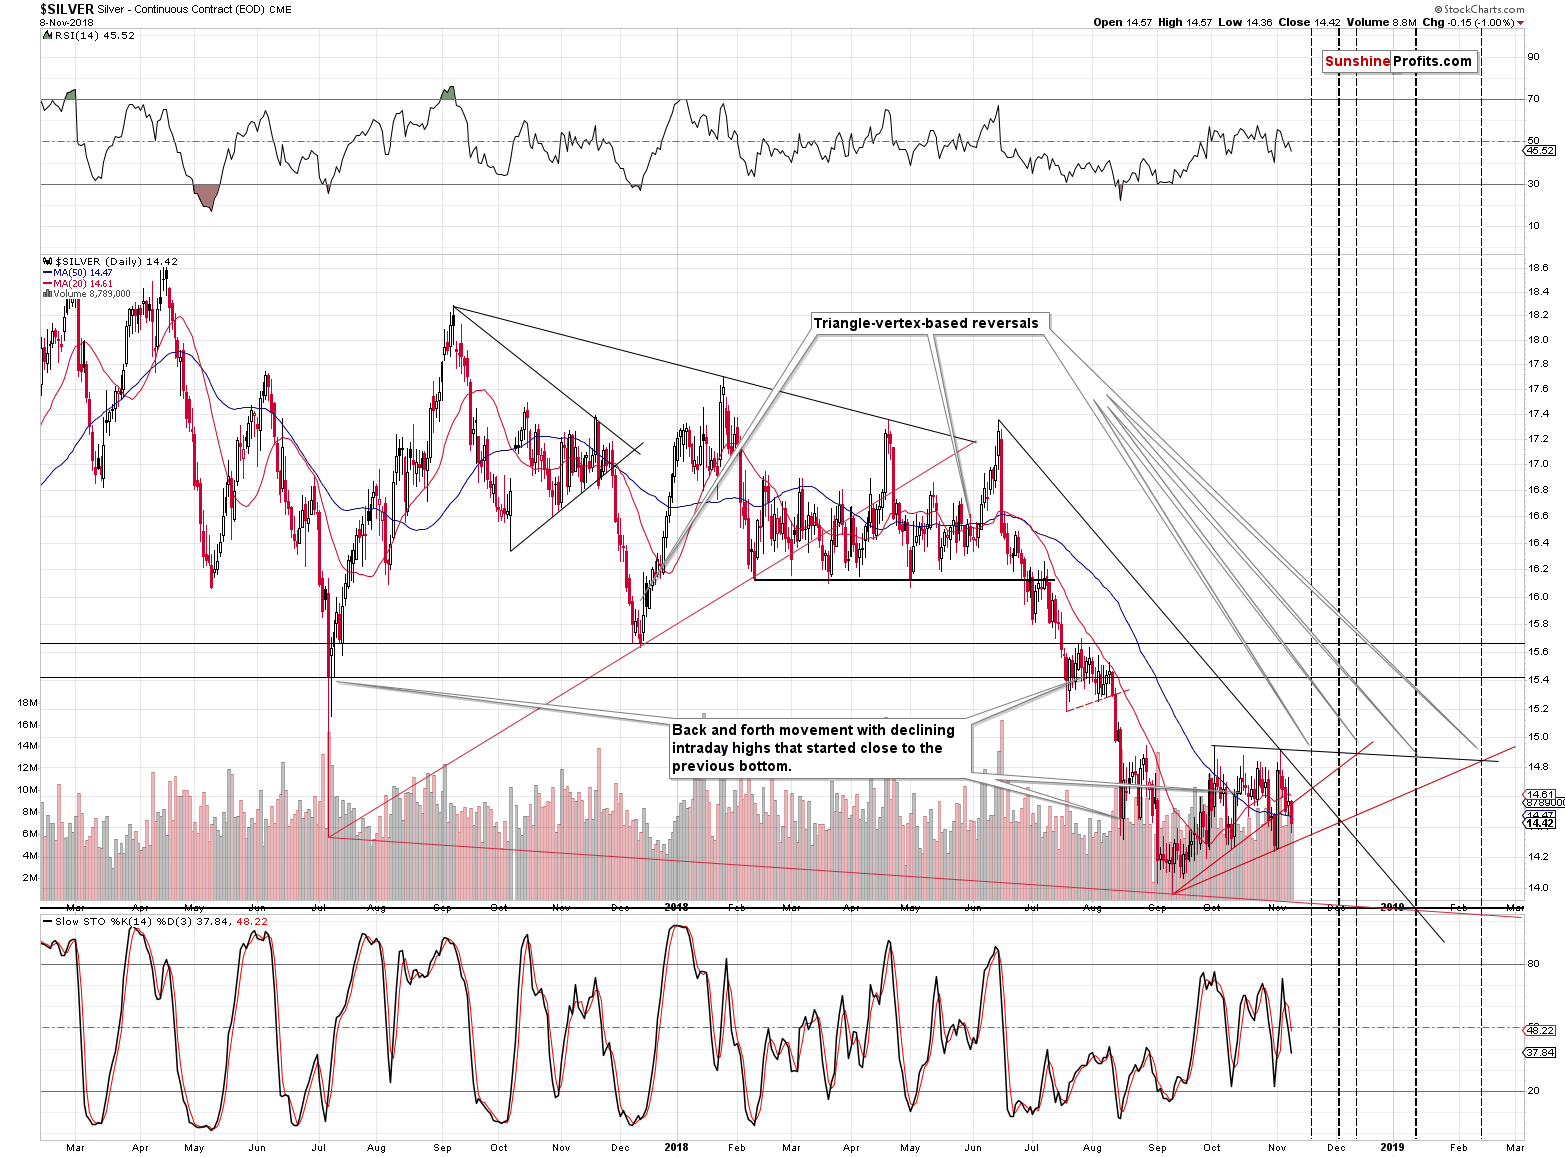
At the first sight there are no major changes on the above chart. There is something that is worth noting, though. It’s the position of the RSI indicator that we have right now. It’s close to 50 – the middle of the trading range, suggesting that the market is ready to move in any direction and then to continue the move for a reasonable amount of time. This is particularly interesting in comparison to RSI’s value on August 15th. Silver closed at $14.45 and it was after a volatile slide. The RSI was below 25. Yesterday’s closing price is $14.42 and RSI is close to 50.
Shocking? Critical? At least interesting? …Not really.
And that’s the point. It doesn’t seem to be anything important and nothing seems to be going on. This means that the emotions accompanying the slide have cooled down and investors accepted silver in the mid-14s as something normal. Even though this price level was the ending point (very approximately) for the decline several weeks ago, it can now easily become a starting point of another powerful slide.
Moreover, please note how all previous cases when silver’s RSI moved below 30 resulted in a move of this indicator above, or at least close to the 70 level. This was not the case this time, suggesting that something important has changed. Indeed, the thing that changed was the medium-term trend. We had a prolonged consolidation where silver moved back and forth, and we now have a medium-term decline, where the corrective upswing was relatively small. And this corrective upswing appears to have ended.
The really bearish implications, however, come from silver’s long-term chart.
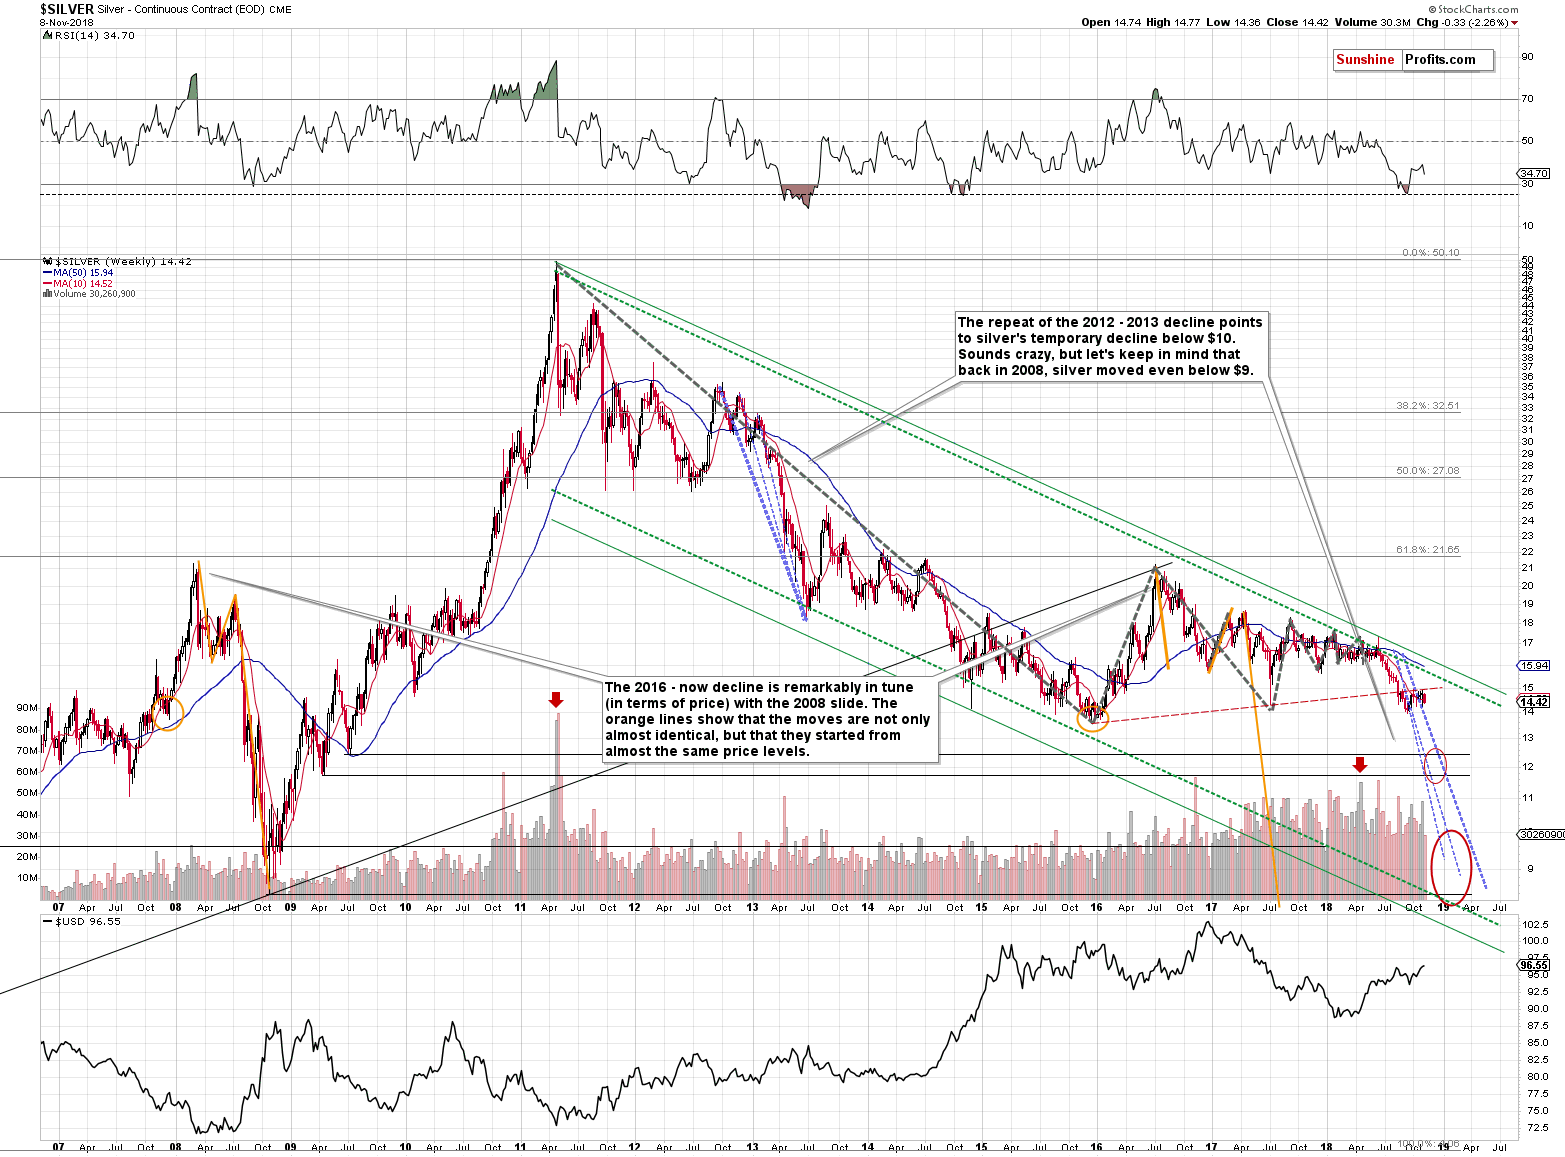
Let’s get right to the point. Please focus on the orange lines on the above chart and the orange ellipses. There are two sets of identical lines. The first set is connecting the key parts of the 2008 downswing and the first ellipse marks the starting point of the final upswing before the 2008 top. The second (right) set of lines is a 100% copy of the 2008 lines.
There is no similarity in time. There is little similarity in shape. But the similarity in price is breathtaking.
And it’s not just because the size of the moves are identical. There’s more than that. The price moves actually start and end at almost the same price levels!
Silver started the final upswing a bit below $14. Applies to both cases: late 2007 and late 2015
Then silver topped a bit above $21. Applies to both cases: early 2008 top and the 2016 top.
Then silver declined to about $16. Applies to both: early 2008 decline and the 2016 decline.
Then silver moved back up to about $19. Applies to both: mid-2008 rally and late-2016 – early-2017 rally. Note: the 2008 move started a bit higher and it ended a bit higher as well – the biggest similarity was in the size of the move.
Then silver declined below $9 in 2008. Now, silver is moving lower and is now after a breakdown below the rising medium-term support line and a multi-week consolidation below it. The above analogy suggests another move below $9 in the upcoming months. Sounds ridiculous, but how impossible can it be if it already happened?
If silver repeats its 2013 performance (in analogy to what we expect gold to do), we can really expect it to move close to the $9 level.
The long-term resistance for the gold to silver ratio is at about 100 level and since we expect gold to move to $890, then $9 silver definitely appears to be something possible.
Of course, the white metal would be a steal at those prices and we would expect it to reverse and rally shortly and we would – I’ll take the risk of sounding unprofessional and write the first thing that came to my mind – be likely buying like crazy. Naturally, only if nothing major changed on the fundamental side of the market, but we doubt that it would be the case.
Silver doesn’t have to decline to $9, but based on the above analogies it appears something that needs to be considered. There is a huge opportunity in taking advantage of the upcoming slide and then taking on big positions close to the final bottom, when others will be too scared to do so.
Important Analyses
Before summarizing, we would like to emphasize that we have recently posted several analyses that are very important and that one should keep in mind, especially in the next several weeks. If you haven’t had the chance of reading them previously, we encourage you to do so today:
- Dear Gold Investor - Letters from 2013 - Analogy to 2013, which should make it easier to trade the upcoming sizable upswing (if enough factors point to it, that is) and to enter the market close to the final bottom.
- Gold to Soar Above $6,000 - discussion of gold’s long-term upside target of $6,000.
- Preparing for THE Bottom in Gold: Part 6 – What to Buy - extremely important analysis of the portfolio structure for the next huge, multi-year rally in the precious metals.
- Preparing for THE Bottom in Gold: Part 7 – Buy-and-hold on Steroids - description of a strategy dedicated to significantly boosting one’s long-term investment returns while staying invested in the PM sector.
- Gold’s Downside Target, Upcoming Rebound, and Miners’ Buy Plan - details regarding the shape of the following price moves, a buying plan for mining stocks, and a brief discussion of the final price targets for the current decline.
- Gold: What Happened vs. What Changed - discussion of the latest extreme readings from gold’s CoT report
- Key Factors for Gold & Silver Investors - discussion of key, long-term factors that support the bearish outlook for PMs. We are often asked what makes us so bearish – this article is a reply to this question.
- The Upcoming Silver Surprise - two sets of price targets for gold, silver and mining stocks: the initial and the final one.
- Precious Metals Sector: It’s 2013 All Over Again - comparison between 2013 and 2018 throughout the precious metals sector, the general stock market and the USD Index. Multiple similarities point to the repeat of a 2013-style volatile decline in the PMs.
- Changing One's Mind - Why, When, and How – discussing the way of analyzing the market that helps to stay focused on growing one’s capital while not being influenced by the loss aversion bias. This essay might be particularly useful in light of the recent upswing in the PMs.
- Inverse H&S Patterns and Something Even More Extreme - gold targets for the current decline in terms of price and time.
E-mail Notification Information
As you know, whenever we are posting a regular Alert, we are sending a notification about it via e-mail. However, we would like to make sure that everyone knows that it’s just a notification, and not the Alert itself (the intraday messages are usually copies of the Alert that is posted on the website) and that it can be accessed online even without the use of the e-mail. In the vast majority of cases, our e-mail will be received normally (we put a lot of effort into keeping the high deliverability of our messages), but at times you may still not get the notification to your e-mail inbox. In order to maximize the chance of receiving it, we suggest that you add us ([email protected]) to your address book / safe-senders list and that you make sure that your e-mail inbox has enough free space to receive new messages. Moreover, please note that you can always check the Alerts section on the website for new Alerts and access them using your login details.
We were recently contacted by one of our subscribers (hello Ali) via e-mail with information that our notification messages are no longer appearing in the inbox. We investigated, and it turns out that we are receiving e-mail bounces that say that the e-mail inbox is full. We tried replying to this e-mail, but our reply also bounced, and since we don’t have a phone number in this specific case, there’s not much more that we can do – except for posting a message over here, right in the Alert.
Summary
Summing up, the outlook remains strongly bearish for the precious metals sector. There is a huge opportunity in taking advantage of the upcoming slide and then taking on big positions close to the final bottom, when others will be too scared to do so. Based on the action in the USD Index, and relative price moves in gold, silver, and mining stocks it seems that we will likely not have to wait much longer before the big move lower resumes.
As always, we’ll keep you – our subscribers – informed.
To summarize:
Trading capital (supplementary part of the portfolio; our opinion): Full short positions (250% of the full position) in gold, silver and mining stocks are justified from the risk/reward perspective with the following stop-loss orders and exit profit-take price levels:
- Gold: profit-take exit price: $1,062; stop-loss: $1,257; initial target price for the DGLD ETN: $82.96; stop-loss for the DGLD ETN $49.27
- Silver: profit-take exit price: $12.72; stop-loss: $15.76; initial target price for the DSLV ETN: $46.97; stop-loss for the DSLV ETN $27.37
- Mining stocks (price levels for the GDX ETF): profit-take exit price: $13.12; stop-loss: $20.83; initial target price for the DUST ETF: $80.97; stop-loss for the DUST ETF $27.67
Note: the above is a specific preparation for a possible sudden price drop, it does not reflect the most likely outcome. You will find a more detailed explanation in our August 1 Alert. In case one wants to bet on junior mining stocks’ prices (we do not suggest doing so – we think senior mining stocks are more predictable in the case of short-term trades – if one wants to do it anyway, we provide the details), here are the stop-loss details and target prices:
- GDXJ ETF: profit-take exit price: $17.52; stop-loss: $31.23
- JDST ETF: initial target price: $154.97 stop-loss: $51.78
Long-term capital (core part of the portfolio; our opinion): No positions (in other words: cash)
Insurance capital (core part of the portfolio; our opinion): Full position
Important Details for New Subscribers
Whether you already subscribed or not, we encourage you to find out how to make the most of our alerts and read our replies to the most common alert-and-gold-trading-related-questions.
Please note that the in the trading section we describe the situation for the day that the alert is posted. In other words, it we are writing about a speculative position, it means that it is up-to-date on the day it was posted. We are also featuring the initial target prices, so that you can decide whether keeping a position on a given day is something that is in tune with your approach (some moves are too small for medium-term traders and some might appear too big for day-traders).
Plus, you might want to read why our stop-loss orders are usually relatively far from the current price.
Please note that a full position doesn’t mean using all of the capital for a given trade. You will find details on our thoughts on gold portfolio structuring in the Key Insights section on our website.
As a reminder – “initial target price” means exactly that – an “initial” one, it’s not a price level at which we suggest closing positions. If this becomes the case (like it did in the previous trade) we will refer to these levels as levels of exit orders (exactly as we’ve done previously). Stop-loss levels, however, are naturally not “initial”, but something that, in our opinion, might be entered as an order.
Since it is impossible to synchronize target prices and stop-loss levels for all the ETFs and ETNs with the main markets that we provide these levels for (gold, silver and mining stocks – the GDX ETF), the stop-loss levels and target prices for other ETNs and ETF (among other: UGLD, DGLD, USLV, DSLV, NUGT, DUST, JNUG, JDST) are provided as supplementary, and not as “final”. This means that if a stop-loss or a target level is reached for any of the “additional instruments” (DGLD for instance), but not for the “main instrument” (gold in this case), we will view positions in both gold and DGLD as still open and the stop-loss for DGLD would have to be moved lower. On the other hand, if gold moves to a stop-loss level but DGLD doesn’t, then we will view both positions (in gold and DGLD) as closed. In other words, since it’s not possible to be 100% certain that each related instrument moves to a given level when the underlying instrument does, we can’t provide levels that would be binding. The levels that we do provide are our best estimate of the levels that will correspond to the levels in the underlying assets, but it will be the underlying assets that one will need to focus on regarding the signs pointing to closing a given position or keeping it open. We might adjust the levels in the “additional instruments” without adjusting the levels in the “main instruments”, which will simply mean that we have improved our estimation of these levels, not that we changed our outlook on the markets. We are already working on a tool that would update these levels on a daily basis for the most popular ETFs, ETNs and individual mining stocks.
Our preferred ways to invest in and to trade gold along with the reasoning can be found in the how to buy gold section. Additionally, our preferred ETFs and ETNs can be found in our Gold & Silver ETF Ranking.
As a reminder, Gold & Silver Trading Alerts are posted before or on each trading day (we usually post them before the opening bell, but we don't promise doing that each day). If there's anything urgent, we will send you an additional small alert before posting the main one.
=====
Latest Free Trading Alerts:
“We are in a bond market bubble that’s beginning to unwind.” This is the statement of Alan Greenspan. Is he right? We invite you to read our today’s article about the US bond market and find out whether it is in bubble or not – and what does it all mean for the precious metals market.
Gold Asks: Are US Bonds Overvalued?
=====
Thank you.
Sincerely,
Przemyslaw Radomski, CFA
Editor-in-chief, Gold & Silver Fund Manager
Gold & Silver Trading Alerts
Forex Trading Alerts
Oil Investment Updates
Oil Trading Alerts

