

Briefly: In our opinion, full (150% of the regular full position) speculative short positions in gold, silver and mining stocks are justified from the risk/reward perspective at the moment of publishing this alert.
Mining stocks moved higher once again and they just closed at the levels that had not been seen for over a month. Does this rally – as in many other cases – indicate higher prices for the entire precious metals sector?
That’s not likely and there are several reasons for it. Let’s discuss them, starting with the short-term GDX ETF chart (chart courtesy of http://stockcharts.com).
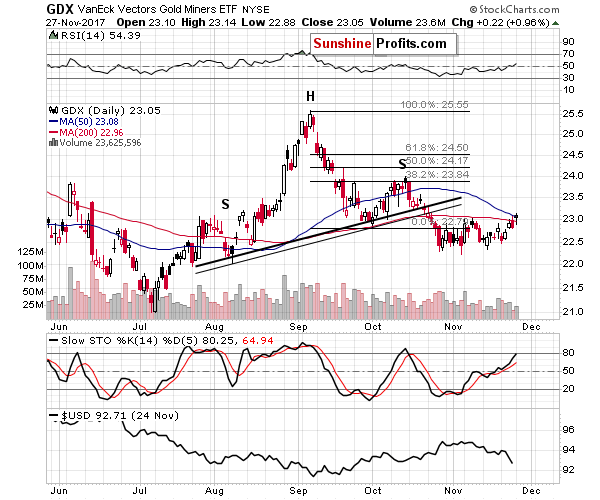
Mining stocks rallied on relatively low volume, which is a bearish sign in general. Another thing is that the Stochastic moved to the 80 level, which indicates topping action (just like it was the case in June and October). Finally, mining stocks moved to the 50-day moving average, without breaking above it. The latter could easily serve as the key resistance - that was more or less the case in June and October (just like it was the case with Stochastic).
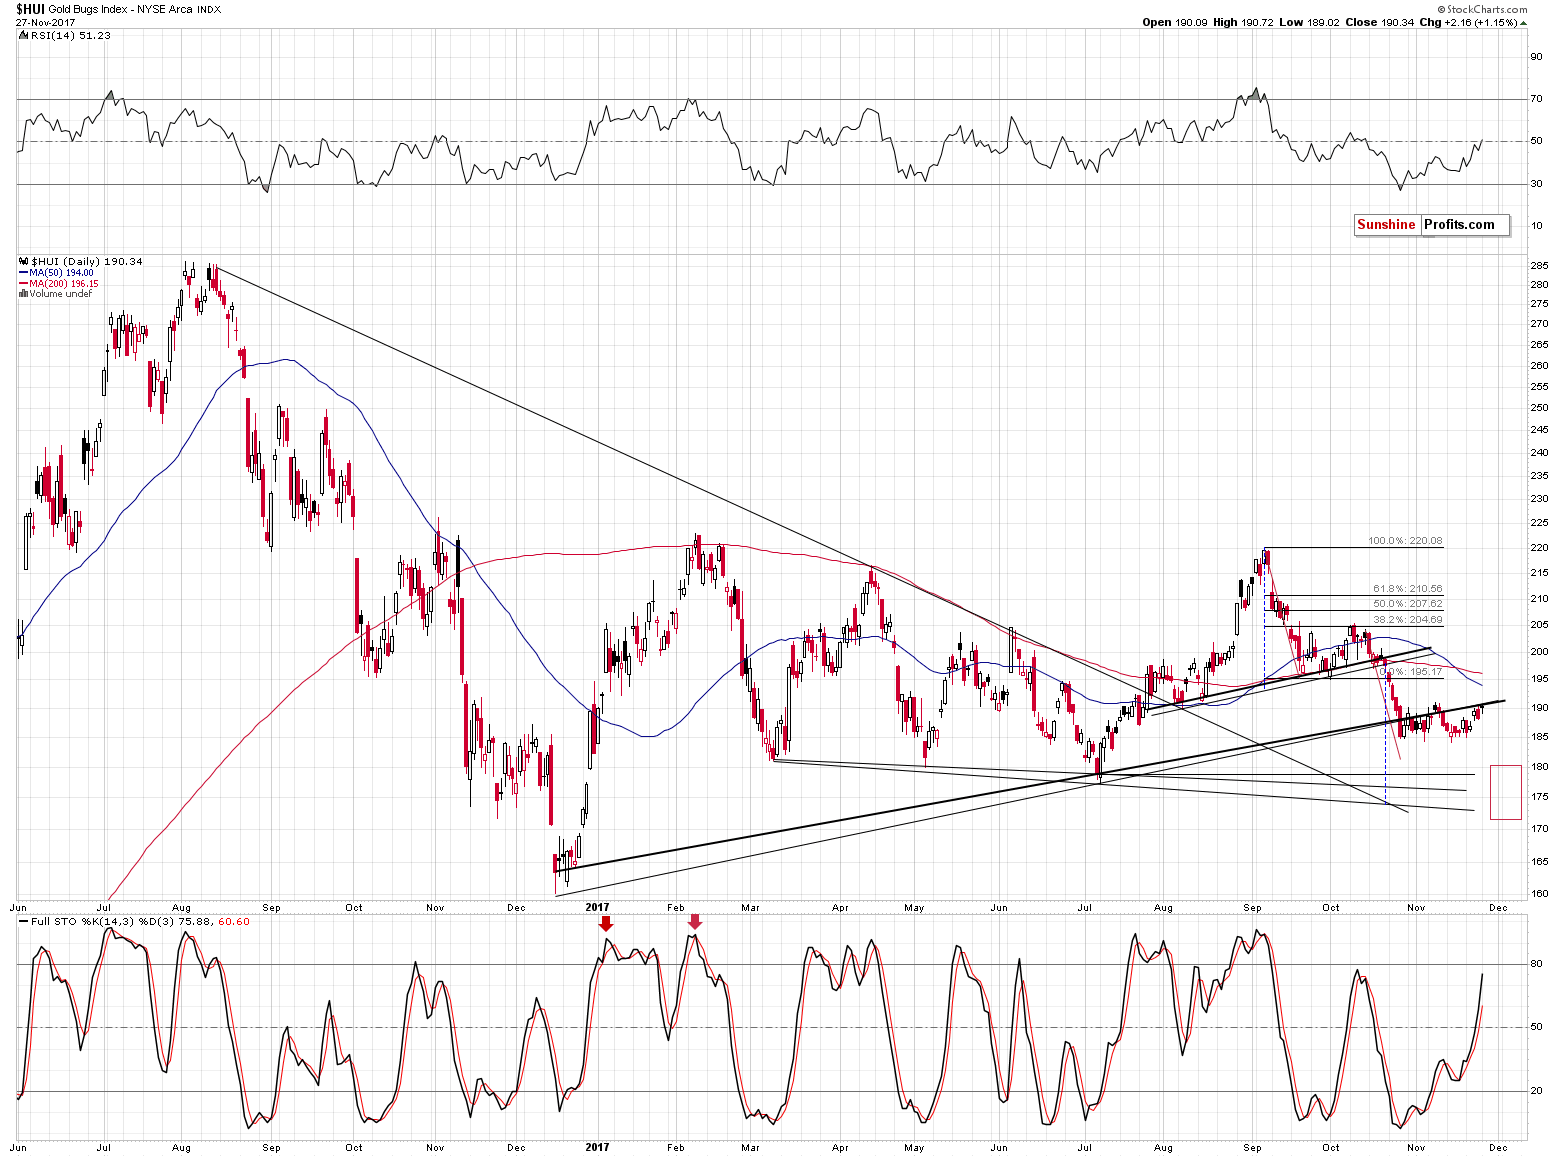
The rising support lines seen on the HUI Index chart remain unbroken and our previous comments remain up-to-date:
The above HUI Index chart shows that last week’s rally didn’t change anything – it was yet another move to the previously broken lines, which once again proved to be strong resistance.
At the same time the RSI and Stochastic moved visibly higher, which suggests that the monthly pause managed to cool down the investors’ emotions and that makes room for another downswing. The RSI level close to 50 was quite often seen at local tops during bigger declines (especially in 2016), which serves as another bearish sign.
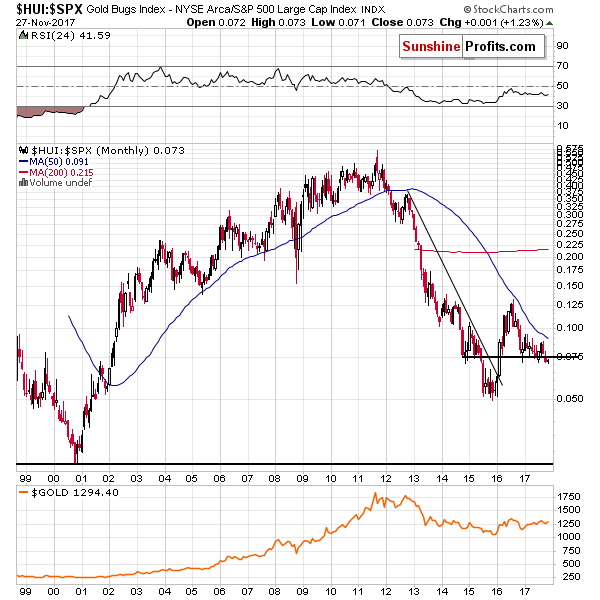
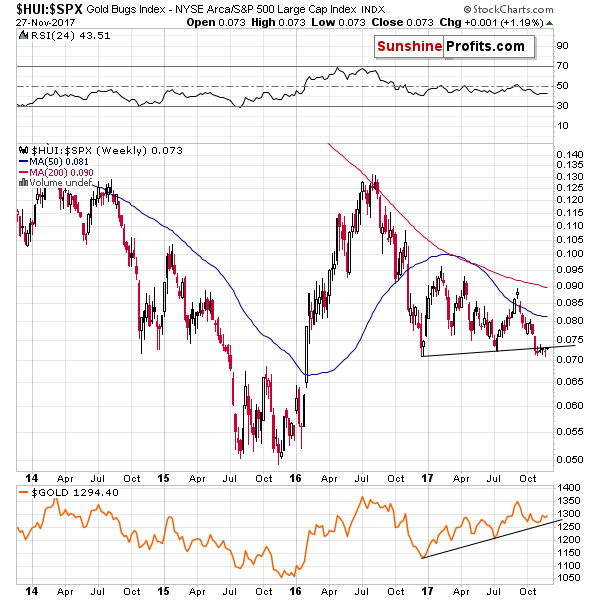
Finally, comparing the performance of gold stocks to the one of the general stock market shows that what appears to be strength in the former, is actually a lengthy verification of the breakdown below the previous lows and the slightly rising support line based on the late-2016 and 2017 lows.
Think about it – the USD index just declined about 2 index points and yet gold stocks were unable to invalidate the relatively small breakdown below a very important support/resistance line. If the previous decline and breakdown had been accidental, it would have surely been invalidated by now – but that’s not what happened. Conversely, mining stocks are verifying their breakdown even though the USD Index is “trying hard” to interrupt it.
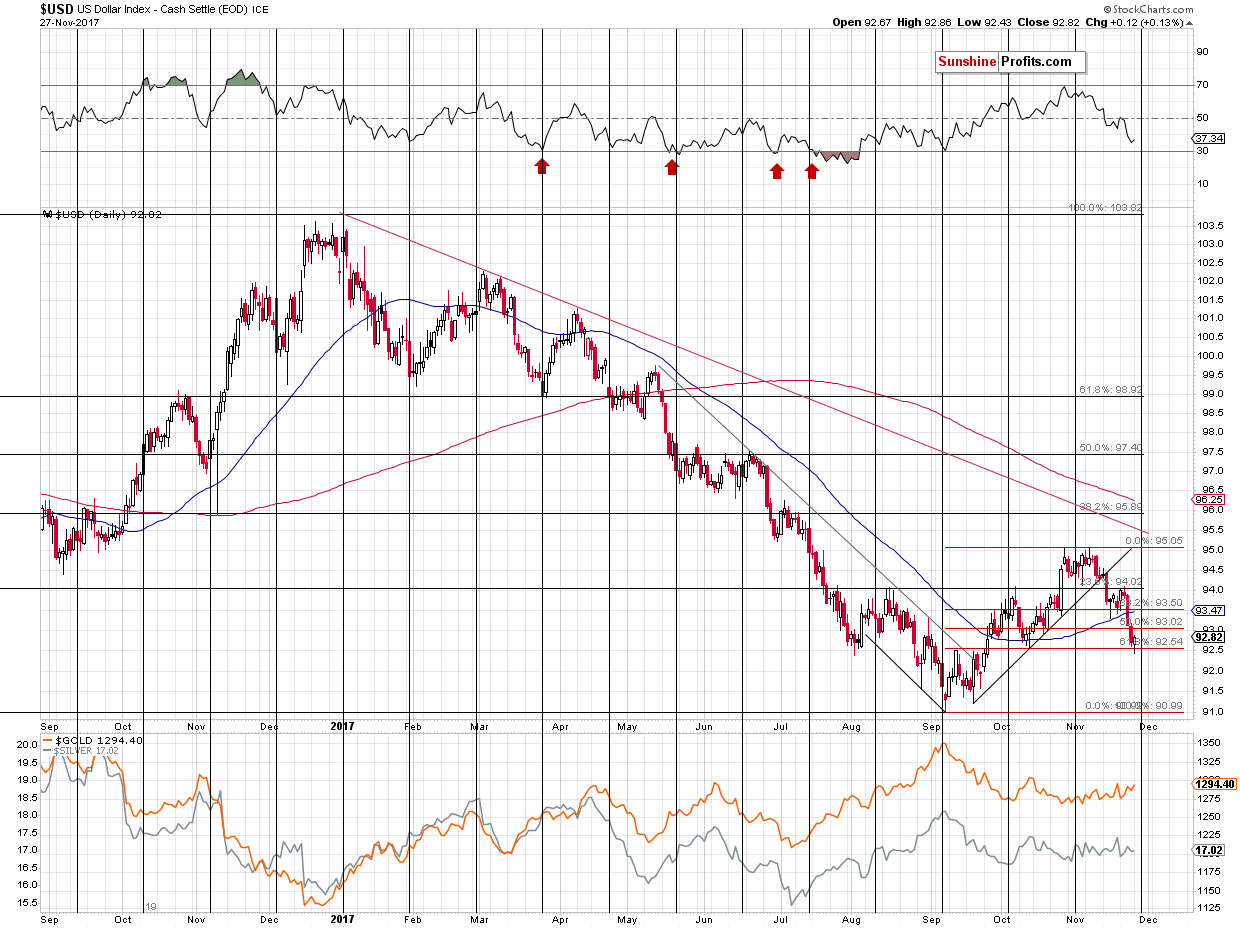
Speaking of the USD Index, in yesterday’s alert we wrote about a possible move below the 61.8% Fibonacci retracement level and a subsequent invalidation – that’s exactly what we saw during yesterday’s session.
The reversal took place quite close to the cyclical turning point, so it could be the case that the bottom is already in. Based on the analogy in terms of time to the previous corrections in the early parts of major rallies in the USD, this is likely.
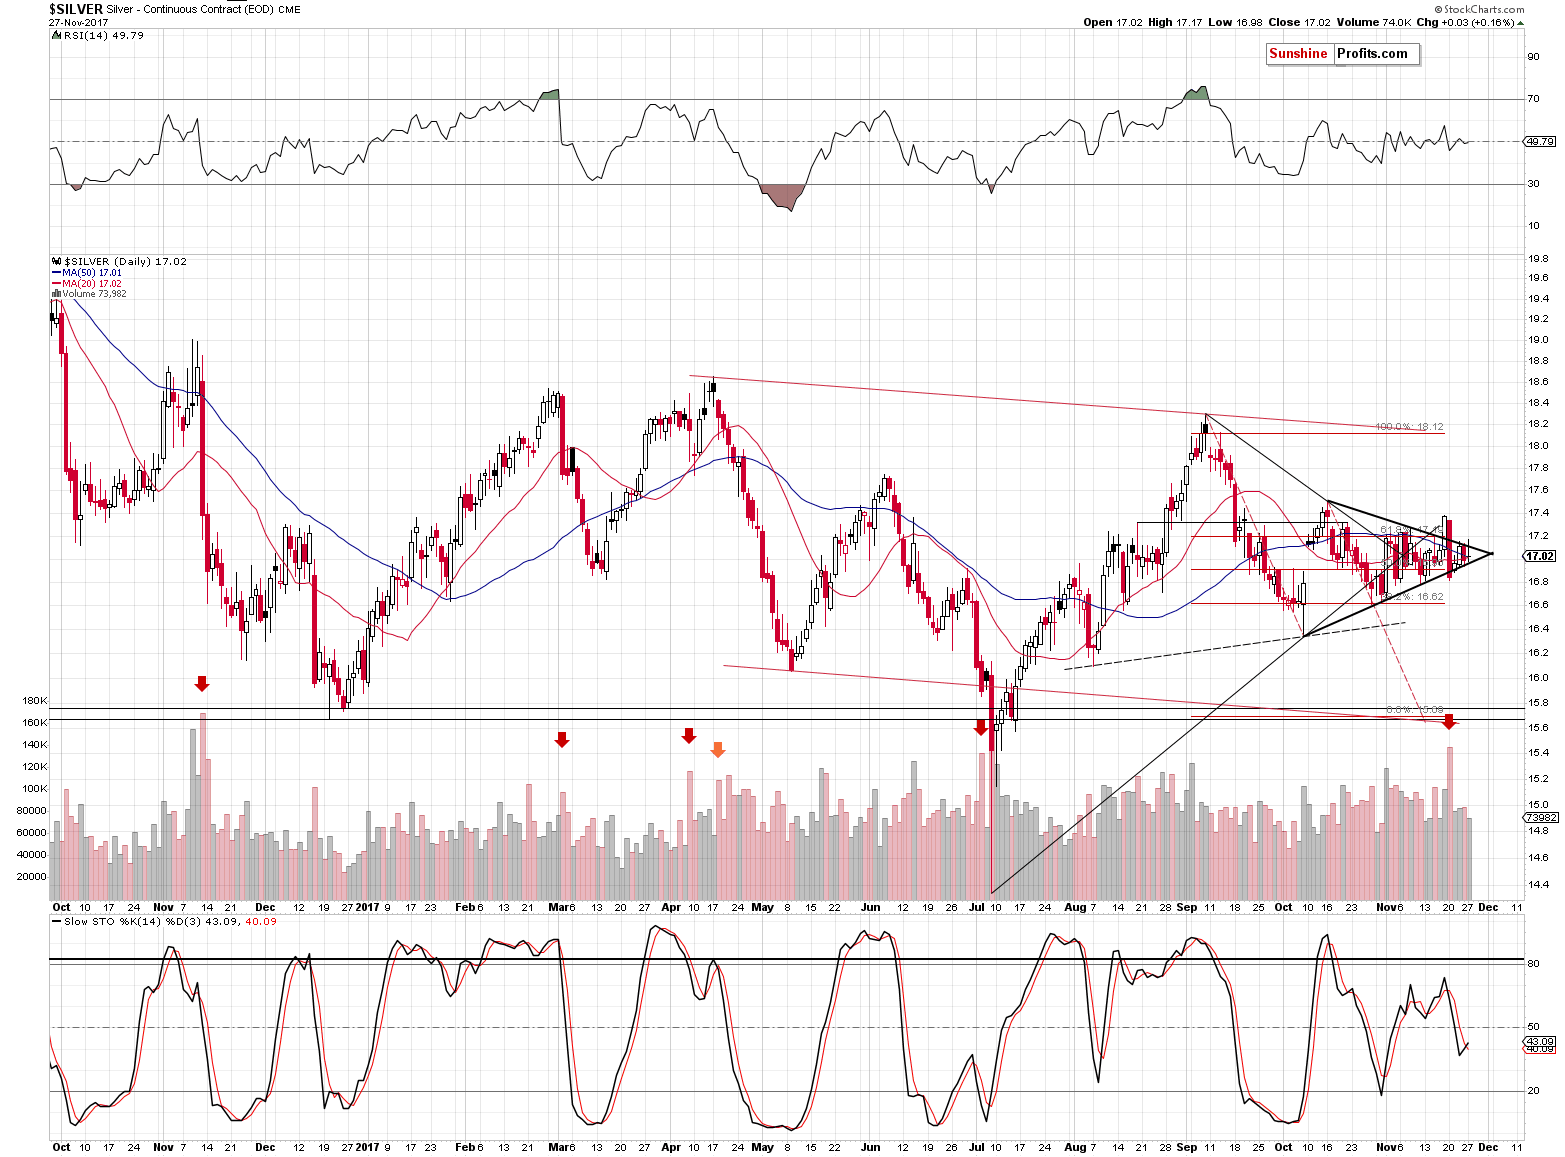
Silver moved higher only on an intraday basis and closed without a visible change. Consequently, what we wrote yesterday, remains up-to-date:
Silver didn’t do much – it continues to trade back and for within the triangle. The apex of the triangle is in early December and we therefore expect to see an important turnaround at that time.
We previously expected this turning point to be the next local bottom, but at this time, in light of the situation in the USD Index and the fact that it’s only a few days left until the end of November, we need to adjust this expectation and take into account the possibility that the turnaround will be seen at a local top.
So, the situation could go in the following way: silver breaks above the triangle this week as the USD declines and forms a bottom. That would be very close to the end of the month and the apex-based turning point would come into play. The USD would start a multi-week rally and silver would decline, invalidating the previous breakout above the triangle pattern and sliding well below it, likely moving below the $16 level before the next pause.
Naturally, the above is just one of the ways things could evolve from here, but it seems that it’s quite likely.
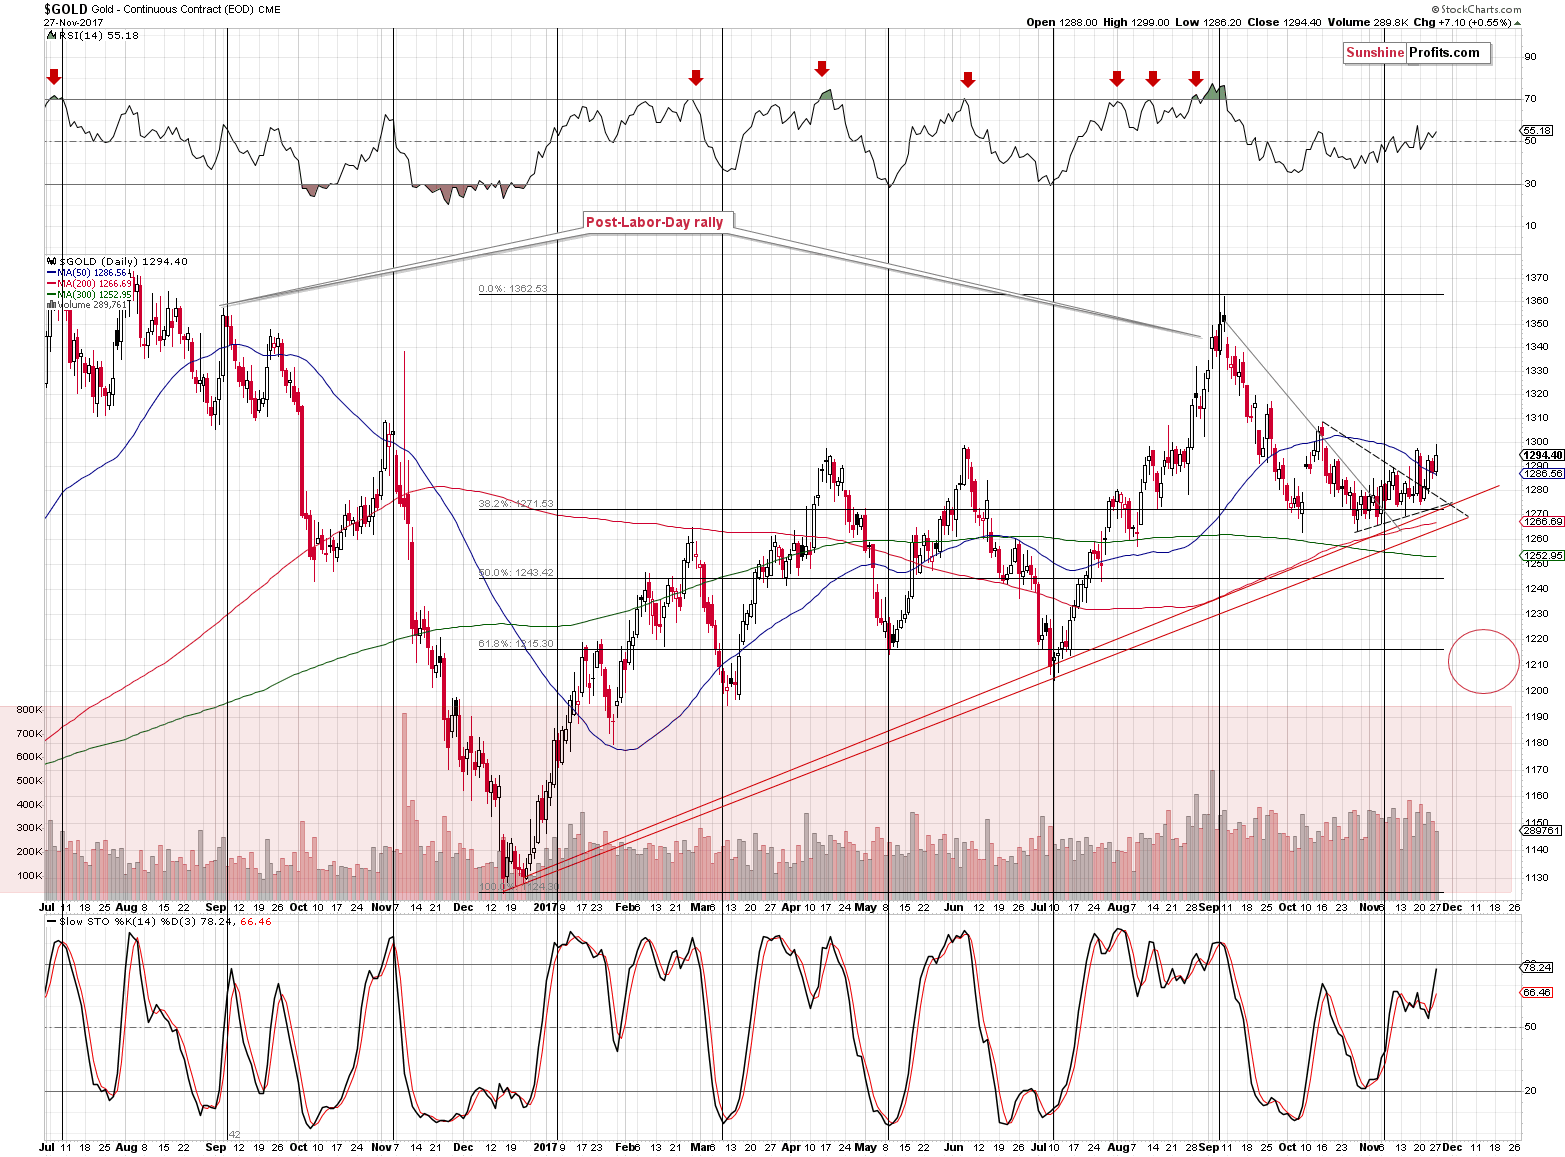
Gold moved higher on declining volume yesterday, but overall it continues to move back and forth below the $1,300 level. Its move above the 50-day moving average and then 2 closes above are somewhat similar to the October top. The Stochastic and RSI levels are similar as well. The above is a weak, but still, bearish sign. Even though Stochastic is at similar levels, we can see that the current reading is higher. In a way, even though the price of gold is lower, the above means that gold is closer to being overbought now, than it was in October.
On a bullish note, gold confirmed the breakout above the triangle pattern, which could result in a short-term rally. Still, we don’t expect the upswing to take gold much higher – the October high seems to be a likely target if gold’s rally continues. Again, that’s a big if, as based i.a. on the 61.8% Fibonacci retracement in the USD, the latter could rally immediately and gold could decline immediately as a result.
Summing up, what seems to be strength in mining stocks is actually a prolonged verification of a breakdown – in terms of both mining stocks and their ratio to the general stock market. Even though the USD Index declined visibly in the past weeks, mining stocks were unable to invalidate the breakdown and the implications are actually bearish. There are many signs pointing to a big move lower in the coming weeks and it seems that any short-term strength will be reversed sooner rather than later.
Naturally, the medium-term outlook remains bearish, especially that the analogy to the 2012-2013 decline remains in place and the previously discussed long-term signals remain in place: gold’s huge monthly volume, the analogy in the HUI Index, the analogy between the two most recent series of interest rate hikes, and the RSI signal from gold priced in the Japanese yen.
As always, we will keep you – our subscribers – informed.
To summarize:
Trading capital (supplementary part of the portfolio; our opinion): Short positions (150% of the full position) in gold, silver and mining stocks are justified from the risk/reward perspective with the following stop-loss orders and exit price levels / profit-take orders:
- Gold: exit price: $1,218; stop-loss: $1,366; exit price for the DGLD ETN: $51.98; stop-loss for the DGLD ETN $38.74
- Silver: exit price: $15.82; stop-loss: $19.22; exit price for the DSLV ETN: $28.88; stop-loss for the DSLV ETN $17.93
- Mining stocks (price levels for the GDX ETF): exit price: $21.23; stop-loss: $26.34; exit price for the DUST ETF: $29.97; stop-loss for the DUST ETF $21.37
In case one wants to bet on junior mining stocks' prices (we do not suggest doing so – we think senior mining stocks are more predictable in the case of short-term trades – if one wants to do it anyway, we provide the details), here are the stop-loss details and exit prices:
- GDXJ ETF: exit price: $30.28; stop-loss: $45.31
- JDST ETF: exit price: $66.27; stop-loss: $43.12
Long-term capital (core part of the portfolio; our opinion): No positions (in other words: cash)
Insurance capital (core part of the portfolio; our opinion): Full position
Important Details for New Subscribers
Whether you already subscribed or not, we encourage you to find out how to make the most of our alerts and read our replies to the most common alert-and-gold-trading-related-questions.
Please note that the in the trading section we describe the situation for the day that the alert is posted. In other words, it we are writing about a speculative position, it means that it is up-to-date on the day it was posted. We are also featuring the initial target prices, so that you can decide whether keeping a position on a given day is something that is in tune with your approach (some moves are too small for medium-term traders and some might appear too big for day-traders).
Plus, you might want to read why our stop-loss orders are usually relatively far from the current price.
Please note that a full position doesn’t mean using all of the capital for a given trade. You will find details on our thoughts on gold portfolio structuring in the Key Insights section on our website.
As a reminder – “initial target price” means exactly that – an “initial” one, it’s not a price level at which we suggest closing positions. If this becomes the case (like it did in the previous trade) we will refer to these levels as levels of exit orders (exactly as we’ve done previously). Stop-loss levels, however, are naturally not “initial”, but something that, in our opinion, might be entered as an order.
Since it is impossible to synchronize target prices and stop-loss levels for all the ETFs and ETNs with the main markets that we provide these levels for (gold, silver and mining stocks – the GDX ETF), the stop-loss levels and target prices for other ETNs and ETF (among other: UGLD, DGLD, USLV, DSLV, NUGT, DUST, JNUG, JDST) are provided as supplementary, and not as “final”. This means that if a stop-loss or a target level is reached for any of the “additional instruments” (DGLD for instance), but not for the “main instrument” (gold in this case), we will view positions in both gold and DGLD as still open and the stop-loss for DGLD would have to be moved lower. On the other hand, if gold moves to a stop-loss level but DGLD doesn’t, then we will view both positions (in gold and DGLD) as closed. In other words, since it’s not possible to be 100% certain that each related instrument moves to a given level when the underlying instrument does, we can’t provide levels that would be binding. The levels that we do provide are our best estimate of the levels that will correspond to the levels in the underlying assets, but it will be the underlying assets that one will need to focus on regarding the signs pointing to closing a given position or keeping it open. We might adjust the levels in the “additional instruments” without adjusting the levels in the “main instruments”, which will simply mean that we have improved our estimation of these levels, not that we changed our outlook on the markets. We are already working on a tool that would update these levels on a daily basis for the most popular ETFs, ETNs and individual mining stocks.
Our preferred ways to invest in and to trade gold along with the reasoning can be found in the how to buy gold section. Additionally, our preferred ETFs and ETNs can be found in our Gold & Silver ETF Ranking.
As a reminder, Gold & Silver Trading Alerts are posted before or on each trading day (we usually post them before the opening bell, but we don't promise doing that each day). If there's anything urgent, we will send you an additional small alert before posting the main one.
=====
Latest Free Trading Alerts:
The Federal Reserve’s unwinding program started in October. What does it mean for the gold market?
The central banks’ inability to achieve their inflation targets led some analysts to argue for modifying these targets. We invite you to read our today’s article about the issue of changing the Fed’s inflation target or adopting a Taylor rule and find out what would such modifications imply for the gold market.
Inflation Target, Taylor Rule and Gold
=====
Hand-picked precious-metals-related links:
PRECIOUS-Gold eases from six-week high ahead of Fed chair confirmation
India Gold imports likely to reach above 700 tons in FY 18
=====
In other news:
Fed nominee Powell, once hawkish, now champions Yellen's focus on jobs
Morning Brief: Powell expects Fed to raise rates further
Senate tax drama intensifies as bill faces key panel vote
OECD Warns Markets Too Optimistic as Global Economy Peaks
Bitcoin Uses Up More Power Than Any Of These 159 Countries
There's a big math problem with the FCC chairman's main argument for repealing net neutrality
=====
Thank you.
Sincerely,
Przemyslaw Radomski, CFA
Founder, Editor-in-chief, Gold & Silver Fund Manager
Gold & Silver Trading Alerts
Forex Trading Alerts
Oil Investment Updates
Oil Trading Alerts

