

Briefly: in our opinion, full (250% of the regular size of the position) speculative short position in gold, silver, and mining stocks is justified from the risk/reward perspective at the moment of publishing this Alert.
In yesterday's analysis we explained what the upside might be if the miners were not bluffing with their Tuesday's strength. We also emphasized that it was most likely the case that they actually were bluffing, and even if they weren't, that the upside was very limited. Miners didn't even manage to get as high - they reversed within the first 20 minutes of yesterday's session. At the same time, gold formed a perfect shooting start reversal pattern on relatively big volume. What comes next? You know what does. The question is whether are you prepared.
Because, if you aren't, this might be the final chance to do so. The analogy in the gold market shows why, but we'll get to that in just a minute. Let's start with the mining stocks.
Miners' Plunge
In yesterday's Alert we wrote the following:
The correct question would be if yesterday's upswing has actually changed anything. And the quick reply, is that it opened the door for possible bullish signs today and in the following days but that it was not yet one on its own.
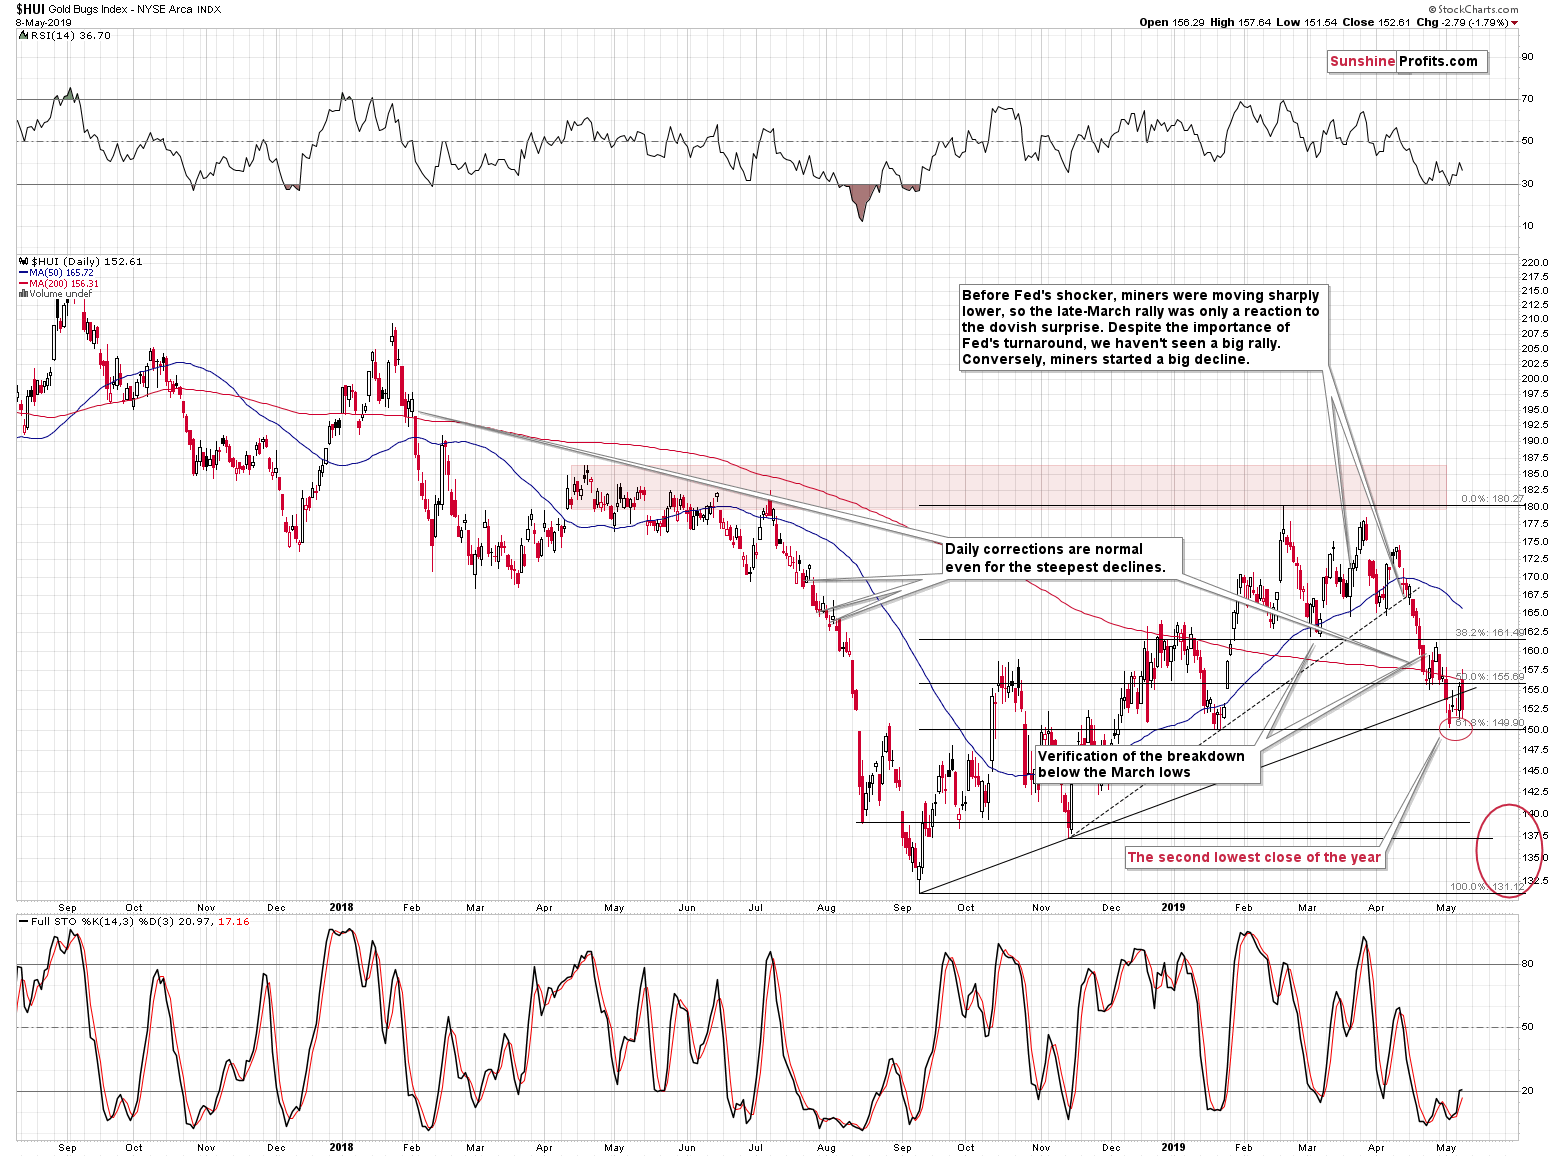
The reasons are present in the surrounding markets (most notably in gold and the USD Index) and in the mining stock themselves. Yes, the mining stocks moved higher, but they already reached an important short-term resistance yesterday. Miners moved to the April low, thus verifying the breakdown below it. Moreover, the move higher that followed the April low took exactly 3 trading days and the most visible part of the decline took place on the third day. Exactly the same thing happened once again. And what followed next in the previous case? The miners declined and their underperformance came back with vengeance.
Yes, the HUI Index moved above the rising resistance line, but:
- It has done so after already confirming the breakdown below this line, which makes the current move suspicious to say the least.
- There was no analogous move in the GDX ETF or the XAU Index.
Consequently, we are not making much of yesterday's move just yet. If the miners are truly strong, they will show this strong performance in the following days as well. For now, it seems that yesterday's move was either accidental, or that it was actually the case of miners providing a fake signal just before the turnaround. You know, the same thing happened in 2012.
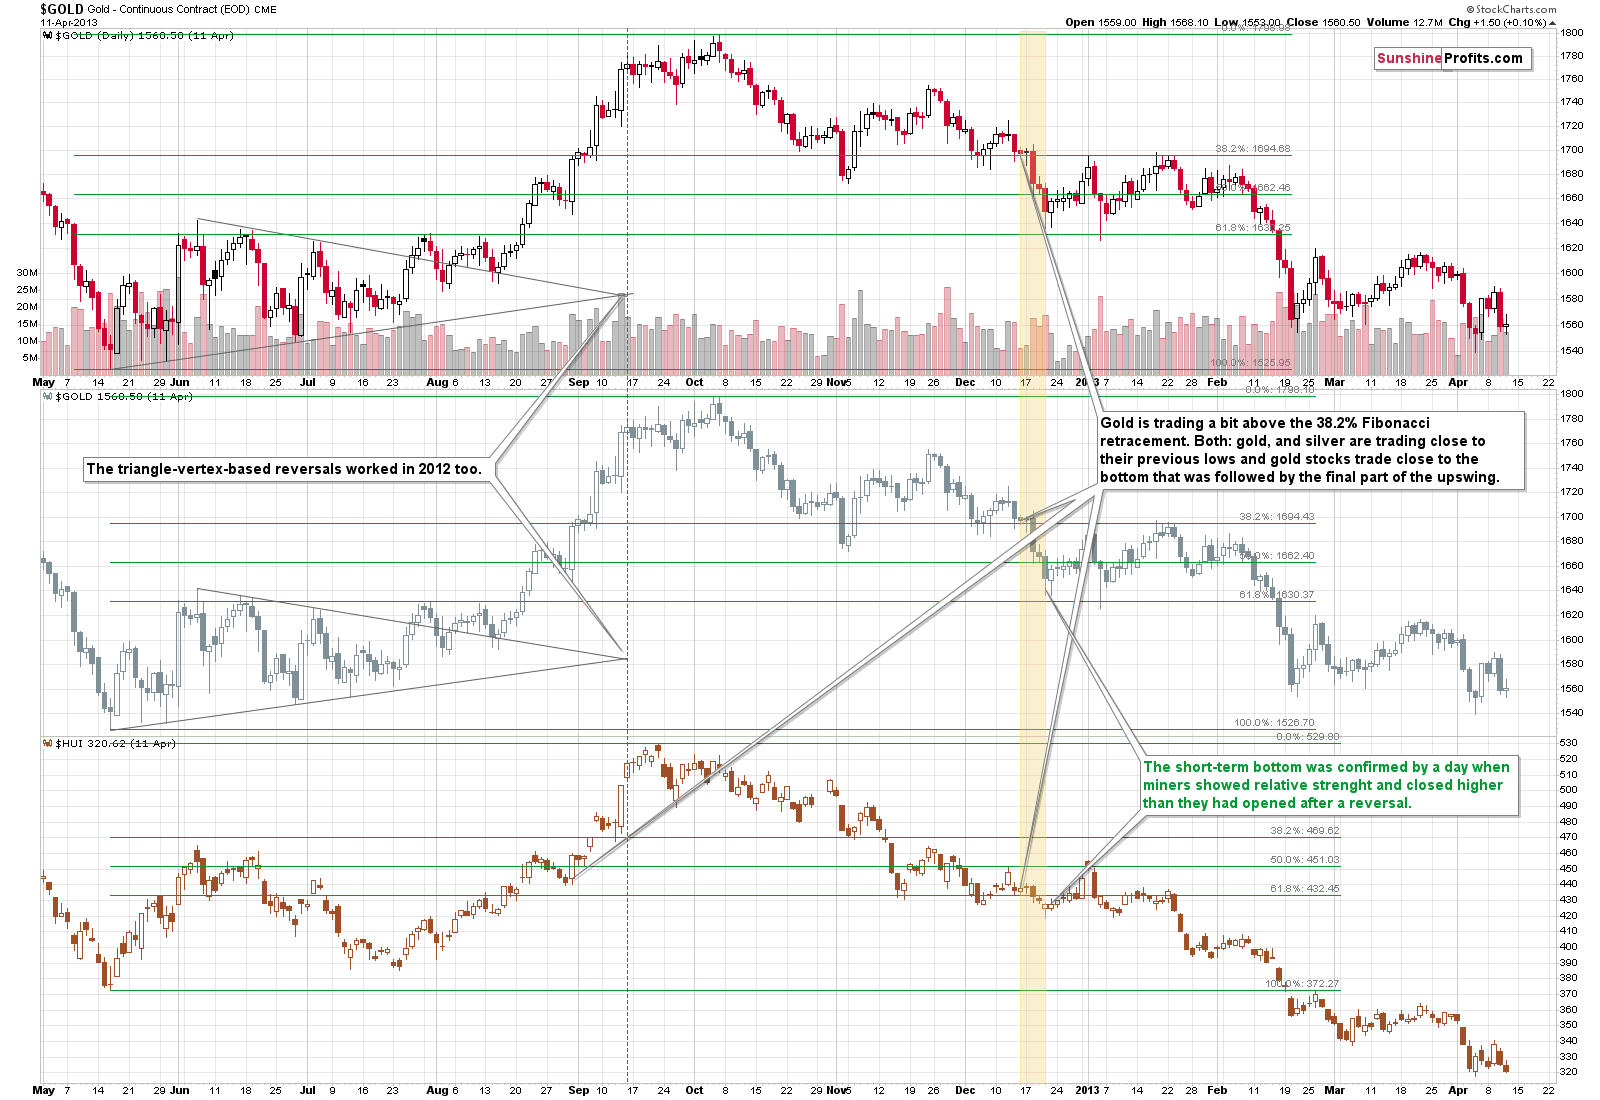
On December 12, 2012, the gold mining stock index soared for a day only to disappoint and decline in the following days. And it was during the part of the decline that is similar to what we see in the precious metals market right now.
So, we now have both: long-term similarity and very short-term analogy to the late-April 2019 upswing that suggest that yesterday's upswing was not a sign of strength, but rather something bearish.
Yesterday's powerful reversal was in perfect tune with the above. Please note that back in 2012, the corrective upswing in the HUI Index that took place before the slide, took it from a bit below 61.8% Fibonacci retracement, to the 50% retracement. The very recent move took miners from the 61.8% Fibonacci retracement to slightly above the 50% retracement. The upcoming and expected plunge of 2019 will finish the analogy. Both moves were remarkably similar even though it's now 6.5 years later.
Yesterday's decline invalidated the daily attempt to break back above the rising resistance line in the HUI Index.
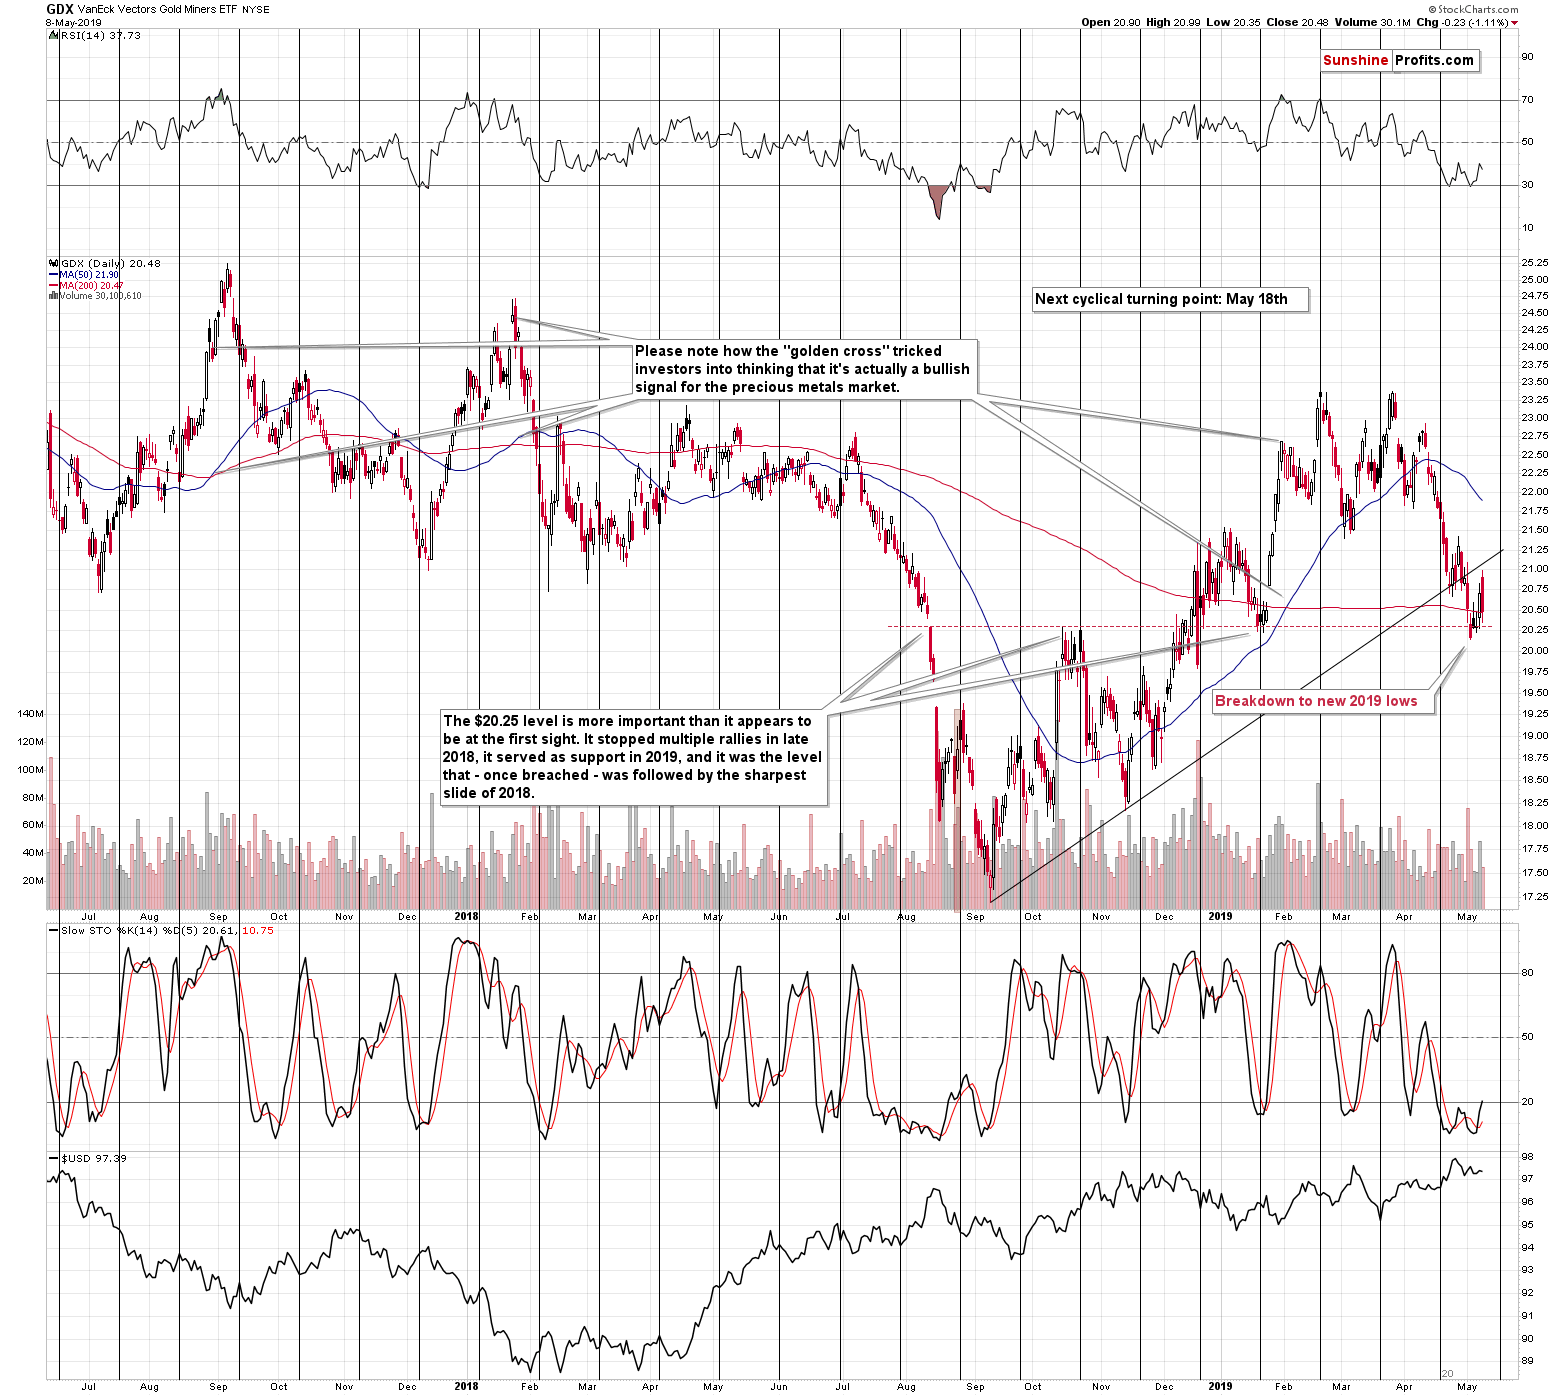
In case of the GDX ETF, there was no invalidation, but only because there was no move back above rising resistance line beforehand. The most recent upswing and the subsequent decline served as a perfect confirmation of the breakdown. This means that the mining stocks can now slide further.
There is also another very important implication of yesterday's decline. Namely, it makes the current situation unlike what we saw in the second half of January. At that time, we also saw a few days of back-and-forth trading that was then followed by a sharp rally. Tuesday's upswing made both cases somewhat similar. Yesterday's decline, however, has already invalidated this similarity, so any potentially bullish implications are already gone.
Before moving to gold, we take a moment to consider the most recent upswing in terms of trading opportunities. This might have been something utilized by day traders, but it's not something that we aimed to profit on and it seems that it was a good decision. The first few days of the move higher were the days when miners did almost nothing and it appeared to be just a pause within a decline. There was just one day when the miners moved higher in a visible manner, and after this single day - meaning, after this very first indication that could have been viewed as bullish - the opportunity was already gone. 20 minutes were all it took for the rally to end yesterday. This means that those who bought early in the day based on Tuesday's rally, were caught by surprise and became the victims of miners' bluff. Fortunately, you were safe. And if the history repeats itself, these traders will not be able to get out flat for months. So, while it might have appeared to be a good decision to exit short positions and perhaps go long on Tuesday, it was exactly the wrong thing to do.
Especially, when we take a look at the most recent analogy in gold.
Turning to Gold
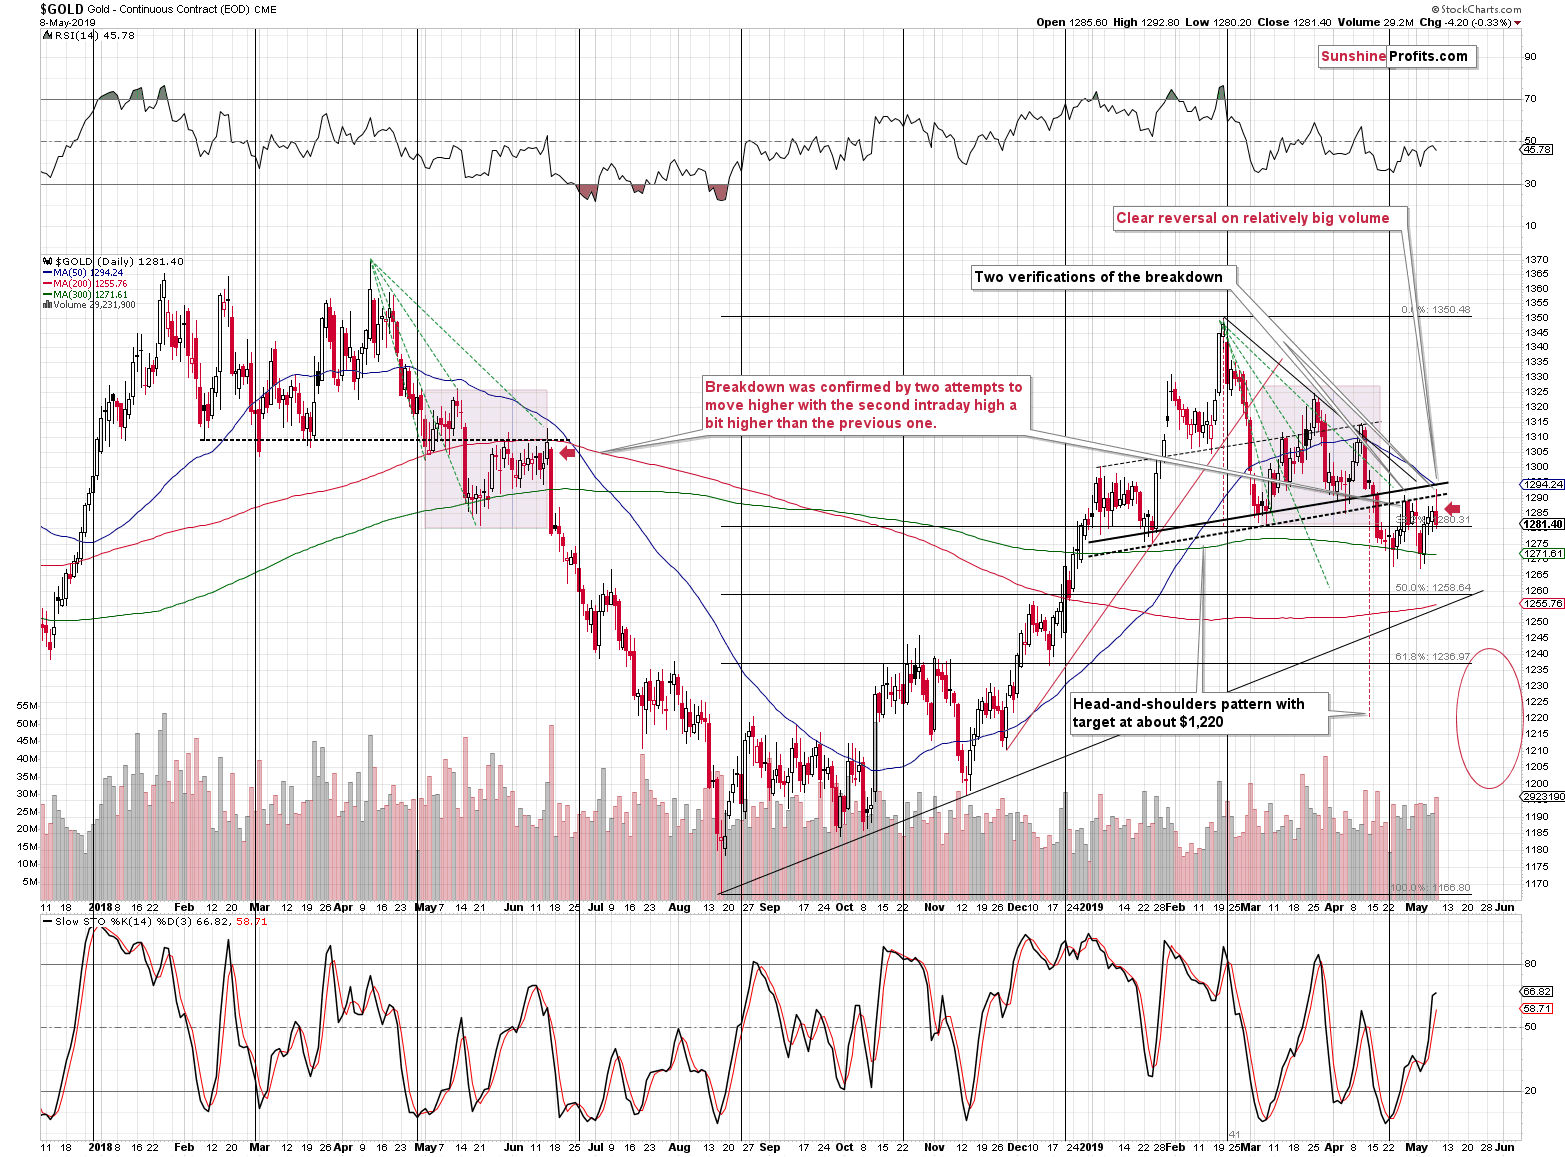
We had previously marked the analogy to the 2018 decline with a blue arrow, but based on the most recent gold price movement, it seems that we are actually in a slightly different part of the analogy - earlier than previously assumed. Consequently, we adjusted the arrows on the above chart and to emphasize the change, we also changed their color to red.
We previously based the analogy on the sizes of daily moves and price levels that were reached. However, based on the shape of the recent post-breakdown consolidation it seems that the declines are similar in a bit different way. Considering the breakdowns below the previous short-term support lines (marked with black, dashed lines), we see that the post-breakdown actions are quite similar to each other. In other words, the mid-May 2018 breakdown's aftermath is similar to the mid-April 2019 one.
The May 2018 breakdown was volatile and the bottom was formed by a series of slightly lower lows. Then we saw an initial upswing back to the previously broken support line that was verified as resistance. Then another move lower, and finally, another verification of the previously broken resistance. The second intraday high (the second verification) was slightly higher than the first one.
We saw exactly the same thing recently.
The April 2019 breakdown was volatile and the bottom was formed by a series of slightly lower lows. Then we saw an initial upswing back to the previously broken support line that was verified as resistance. Then another move lower, and finally, another verification of the previously broken resistance. The second intraday high (the second verification) was slightly higher than the first one.
Back in 2018, that was just before the biggest slide and the beginning of the decline acceleration. The same thing appears likely also this time. The slide might take place today or tomorrow, but even if it doesn't, the implications will still remain very bearish.
Moreover, please note that gold just formed a bearish shooting star candlestick and it took place on relatively big volume, which is a classic way for a decline to start.
We will skip silver analysis today as it hasn't done much and practically everything that we wrote about it recently remains up-to-date. Instead, we will provide you with an updated price path for gold.
Gold Price Path for 2019
When we first posted our gold price path chart on April 24, it seemed likely that gold will continue to decline and reach $1,240 shortly. However, we saw a correction and verification of the breakdown instead. This can be partially explained by a regular market breather, and partially by the surprisingly good jobs report. This didn't change anything with regard to targets in terms of price, but you may be wondering how much it had changed with regard to the time aspect. After all, timing is critical in case of trading.
Many new subscribers joined us recently, so it might be a good idea to remind you all of the logic behind the above chart. We will therefore quote the entire section that we previously dedicated to it. The quote will be adjusted in its lower part, by broadening the time targets for the near-term turnarounds and lowering the upside target for the next corrective upswing. We will soon explain why.
"
Today, we'll provide you with all the gold price targets in between.
Pretty bold, right? Of course, with this kind of forecast, it will be impossible to get 100% of them right and we don't claim that we will always have all the answers right - nobody ever will. However, the roadmap that we are about to present, is based on multiple techniques that we have found to be reliable over many years, and the analogies that stand behind the price paths have been confirmed over and over again, even in the most recent past. It may look like just a few colorful lines, but in reality, this is the essence and result of hundreds of hours of research just in one chart. Gold might deviate from the price path, especially if some unexpected news pops up, but it's thousandfold times better to have an approximate roadmap, than to have none at all.
Let's get right to it.
The Golden Roadmap
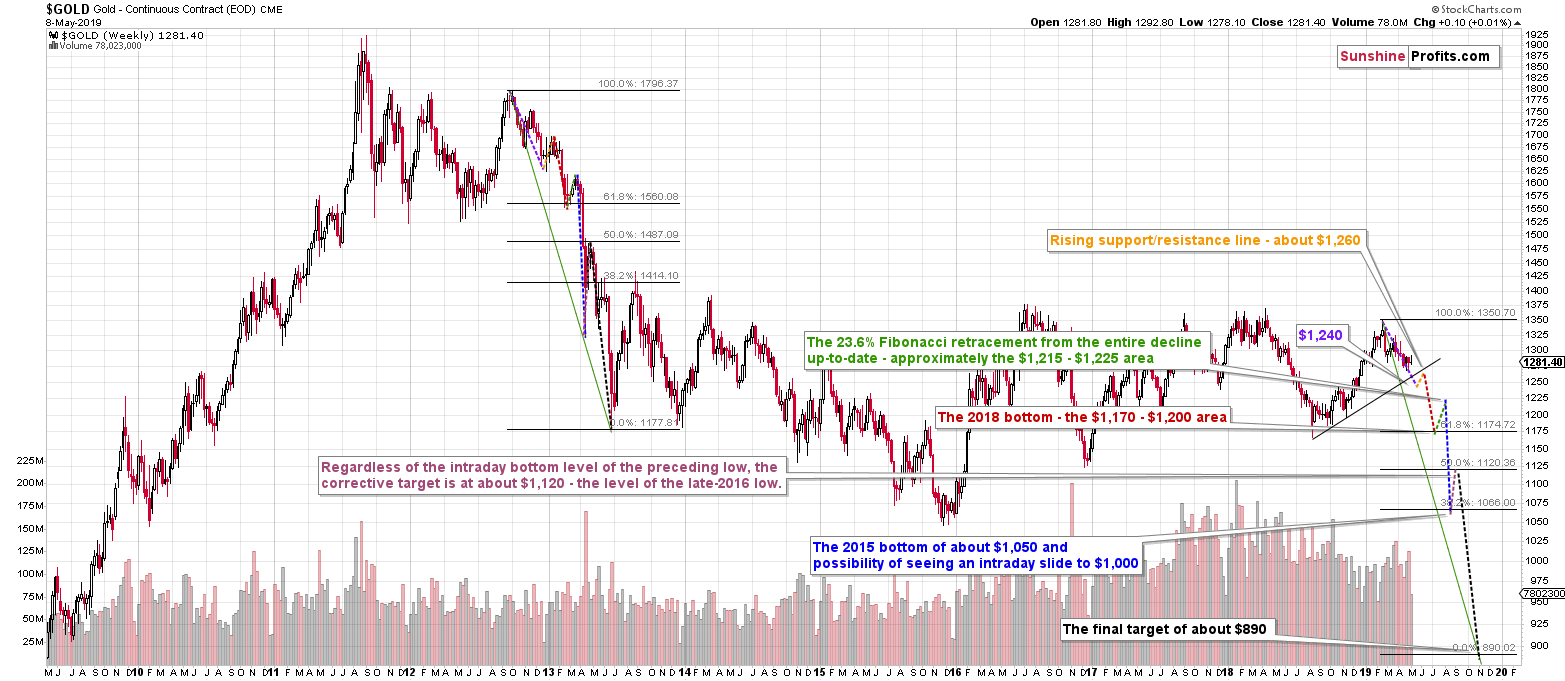
Based on the bullishness that accompanied gold's bottom in 2015, it was very unlikely that it was the final bottom for the decline. Consequently, it has been likely that gold will move below the 2015 low before the slide begins. Based i.a. on the 61.8% Fibonacci retracement based on the entire 2000 - 2011 bull market, the next strong support is at about $890, which makes it a natural long-term target.
Based on the long-term analogy between 2012-2013 and the current decline, the latter is likely to be very similar to the 2013 slide. In fact, it already is - the short-term price moves confirm it. We don't want to go into details today as it would take a lot of space to cover all the details once again - please visit the above links for more information.
Based on the recent extremely weak reaction of the entire precious metals sector to the last month's Fed dovish surprise, it seems that the major decline has already started.
The third paragraph gives us the initial price of the decline, the first paragraph provides the final price, and the second paragraph tells us what the decline is more or less likely to look like.
We intentionally started these three paragraphs with "based", because all the above provides us with exactly that - a base. Base that needs to be adjusted to the current support levels. You see, the analogies work much better on a relative than absolute basis. One of the ways where we see this, is the popular Fibonacci retracement tool. It's not based on absolute, but relative (percentage) price moves. Think about it - back in 2013 gold didn't just end a given decline only because it declined by precisely $142. It ended the decline, because it reached a specific support level that was provided by previous lows, support lines and/or retracements. At least the latter is much more likely than a decline that ends based on its size in terms of dollars.
Replicating the individual lines in dollar terms might be misleading. Better, but still not ideal would be to apply the analogy in percentage terms. In case of logarithmic charts that we use, it simply means copying a line from one part of the chart to another part thereof. This is better than simple dollar terms, because it takes into account the similar level of excitement and it is ultimately emotionality that drives the markets in the short run.
For instance, a move from $300 to $450 in gold was just as exciting or important as the move from $1000 to $1500 - it provided the same profits. On a side note, this is one of the reasons why waiting to re-enter the market at lower prices is so important - $200 now is just as important as $1000 will be when gold will be trading close to $6,000 in the future.
In order to further improve the simple relativity, we took into account other techniques, i.a. True Seasonality, the current support levels and more short-term Fibonacci retracements. Based on them, we adjusted the "base" price targets and arrived at the final ones.
The best thing about this technique is that we didn't have to change the size of the decline - it almost perfectly aligns with the final $890 target. All that we had to do was to adjust the interim targets and we actually didn't need to make the huge adjustments either. The analogy to the 2013 slide fits the current situation quite well. Of course, being off $50 on both long- and short trades can result in major change in the overall profitability, so our adjustments are a critical improvement, even though they may not appear to be huge from the long-term point of view.
In our view, the most surprising thing that the 2013 - now analogy suggests is that the late-2016 low is not likely to stop the decline (it is likely to provide strong resistance, though). Of course, this might be the case after all, but it's not the most likely outcome. Without the analogy, we would view this level as strong support.
You already saw the details on the chart, but let's describe them once again for greater clarity:
- The first projected bottom is the one that is likely to be reached in May - at about $1,240.
- The second target is the next top that is likely to be reached in May or June at about $1,260 (the rising support/resistance line).
- The next target is the bottom at about $1,170 - $1,200 area. This target is based on the 2018 bottom an is likely to take place between the middle part of June (this timing is relatively unclear at this moment) and early July.
- The next target is the top at about $1,215 - $1,220. That's based on the (less popular, but still important) 23.6% Fibonacci retracement level. Time-wise, the target for this top is the middle part of July (this timing is relatively unclear at this moment).
- The next target is the bottom at about $1,050, with a good chance of seeing an intraday move to $1,000. This target is based on the 2015 bottom and the intraday possibility is based on the analogy to the April 2013 volatility. This is likely to take place in August, or at the beginning of September.
- The next target is the top at about $1,120, which means that the correction from the $2015 lows should be quite sizable. This will also very likely be accompanied by cheerful "the bottom is in!" comments in various gold forums and the final slide is likely to start amid them. This top is likely to form between late September and mid-October.
- The final target is the bottom at about $890, which is likely to take place in late October or early November.
In other words, this year is likely to be busy but very rewarding.
"
The reason for both (price and time) changes in the nearby reversals is the delay in the current decline. Let's once again quote one of the opening statements from late April: gold might deviate from the price path, especially if some unexpected news pops up. That's exactly what happened. The surprisingly good employment numbers triggered another move higher and caused a change in the likely trends.
On the upside, the change made the period before the next bottom longer. And on the downside, it made the upcoming corrective upswing (point 2 from the above list) less prominent. Given the time that gold spent consolidating now, it's more likely that the next move will be bigger or interrupted by a smaller correction. The saying goes "the bigger the base, the stronger the move", and the current consolidation can be viewed as the base.
Moreover, since some time has passed, the rising support line in gold is now higher. In fact, it's high enough to be a good target for both: declines and rallies. It's not likely to stop the decline, though, because it would mean a relatively tiny move below the big, medium-term bearish head-and-shoulders pattern, which is very unlikely. What is much more likely, though, is that this level would stop the gold price during its corrective upswing.
All other price targets remain intact.
As far as time targets are concerned, there were no changes with regard to the distant targets, but we made the near-term targets less precise. Why? Actually, it doesn't mean that the situation became more bullish or bearish. We simply want to emphasize that the situation is relatively unclear in terms of time if we base the targets on the adjusted analogy to the 2012-2013 move alone. We even considered removing the time targets altogether, because they might be more confusing than informative for many people. We finally decided to only broaden them, so that it's clear that one should not expect certain dates to be written in stone.
In fact, one might even say that the near-term reversals can be viewed on a +/- 1 month basis and the distant reversals can be viewed on a +/- 2 month basis. It all depends how the situation develops and what the markets are surprised with in the meantime.
The best approach in our view is to look at the chart without zooming in. Can you tell the exact date of a reversal? No. But can you more or less see when gold is likely to move lower and when higher? Yes. Precise? No. Useful? You bet.
The golden roadmap was never meant to be used as the final and unchangeable set of price and time targets, which is why we emphasized that gold might deviate from its price path in light of unexpected news. The final price target ($890) is very probable in our view, but the interim price targets and all time targets are a set of ballpark figures that should help you prepare for what's to come later this year. However, we would like to stress that the roadmap is not enough - on its own - to trade the near-term moves. If it was, we would simply stop publishing anything after providing it. Why waste keyboards on additional comments if the initial roadmap was all there was to take into account? Why flirt with eyeglasses if there were nothing actionable to tell you along the way?
Unexpected events will keep on popping up and we will be adjusting the price path accordingly, while keeping you informed on the short-term moves using the full arsenal of other techniques that we researched and found useful over the years. Some of the moves will be tradable (such as probably the move higher that starts once gold moves to $1,240 or so, silver moves below $14, and HUI moves to about 140), but some will not (like the quick upswing that just ended with a trick on many gold traders). Naturally, we will keep you - our subscribers - informed.
Summary
Summing up, yesterday's profound move lower in the mining stocks confirmed the bearish outlook and we can say the same thing about the bearish reversal candlestick in gold. Based on the confirmed head-and-shoulders top in gold, the building pressure in the USD Index, and the analogy to the way the precious metals market declined in 2012 and 2013, the next short-term bottom might be reached as early as this or the next week - in a volatile manner. This upcoming bottom might be a good opportunity to go long, but we are definitely not in this kind of situation right now. Conversely, in our view, short positions in the PMs are likely to generate sizable profits.
To summarize:
Trading capital (supplementary part of the portfolio; our opinion): Full short position (250% of the full position) in gold, silver, and mining stocks is justified from the risk/reward perspective with the following stop-loss orders and exit profit-take price levels:
- Gold: profit-take exit price: $1,241; stop-loss: $1,357; initial target price for the DGLD ETN: $51.87; stop-loss for the DGLD ETN $39.87
- Silver: profit-take exit price: $13.81; stop-loss: $15.72; initial target price for the DSLV ETN: $39.38; stop-loss for the DSLV ETN $26.97
- Mining stocks (price levels for the GDX ETF): profit-take exit price: $18.41; stop-loss: $24.17; initial target price for the DUST ETF: $34.28; stop-loss for the DUST ETF $15.47
In case one wants to bet on junior mining stocks' prices (we do not suggest doing so - we think senior mining stocks are more predictable in the case of short-term trades - if one wants to do it anyway, we provide the details), here are the stop-loss details and target prices:
- GDXJ ETF: profit-take exit price: $26.42; stop-loss: $35.67
- JDST ETF: profit-take exit price: $78.21 stop-loss: $30.97
Long-term capital (core part of the portfolio; our opinion): No positions (in other words: cash)
Insurance capital (core part of the portfolio; our opinion): Full position
Whether you already subscribed or not, we encourage you to find out how to make the most of our alerts and read our replies to the most common alert-and-gold-trading-related-questions.
Please note that the in the trading section we describe the situation for the day that the alert is posted. In other words, it we are writing about a speculative position, it means that it is up-to-date on the day it was posted. We are also featuring the initial target prices, so that you can decide whether keeping a position on a given day is something that is in tune with your approach (some moves are too small for medium-term traders and some might appear too big for day-traders).
Plus, you might want to read why our stop-loss orders are usually relatively far from the current price.
Please note that a full position doesn't mean using all of the capital for a given trade. You will find details on our thoughts on gold portfolio structuring in the Key Insights section on our website.
As a reminder - "initial target price" means exactly that - an "initial" one, it's not a price level at which we suggest closing positions. If this becomes the case (like it did in the previous trade) we will refer to these levels as levels of exit orders (exactly as we've done previously). Stop-loss levels, however, are naturally not "initial", but something that, in our opinion, might be entered as an order.
Since it is impossible to synchronize target prices and stop-loss levels for all the ETFs and ETNs with the main markets that we provide these levels for (gold, silver and mining stocks - the GDX ETF), the stop-loss levels and target prices for other ETNs and ETF (among other: UGLD, DGLD, USLV, DSLV, NUGT, DUST, JNUG, JDST) are provided as supplementary, and not as "final". This means that if a stop-loss or a target level is reached for any of the "additional instruments" (DGLD for instance), but not for the "main instrument" (gold in this case), we will view positions in both gold and DGLD as still open and the stop-loss for DGLD would have to be moved lower. On the other hand, if gold moves to a stop-loss level but DGLD doesn't, then we will view both positions (in gold and DGLD) as closed. In other words, since it's not possible to be 100% certain that each related instrument moves to a given level when the underlying instrument does, we can't provide levels that would be binding. The levels that we do provide are our best estimate of the levels that will correspond to the levels in the underlying assets, but it will be the underlying assets that one will need to focus on regarding the signs pointing to closing a given position or keeping it open. We might adjust the levels in the "additional instruments" without adjusting the levels in the "main instruments", which will simply mean that we have improved our estimation of these levels, not that we changed our outlook on the markets. We are already working on a tool that would update these levels on a daily basis for the most popular ETFs, ETNs and individual mining stocks.
Our preferred ways to invest in and to trade gold along with the reasoning can be found in the how to buy gold section. Additionally, our preferred ETFs and ETNs can be found in our Gold & Silver ETF Ranking.
As a reminder, Gold & Silver Trading Alerts are posted before or on each trading day (we usually post them before the opening bell, but we don't promise doing that each day). If there's anything urgent, we will send you an additional small alert before posting the main one.
=====
Latest Free Trading Alerts:
Stocks were mixed on Wednesday, as investors hesitated following the recent decline. The S&P 500 index remained below the 2,900 mark. On Tuesday it was the lowest since the early April. Is this still just a downward correction or a new downtrend?
S&P 500 Remains Below 2,900 Mark, Will Downtrend Continue?
=====
Thank you.
Sincerely,
Przemyslaw Radomski, CFA
Editor-in-chief, Gold & Silver Fund Manager

