

Briefly: in our opinion, full (250% of the regular size of the position) speculative short position in gold, silver, and mining stocks is justified from the risk/reward perspective at the moment of publishing this Alert.
The stock market took a dive, and gold with silver barely moved higher. Miners had little reason to rally, especially that they have been underperforming gold for many days now. And yet, gold stocks and silver stocks moved visibly higher. What if it isn't just a bluff? What if it's the first sign that the near-term bottom is already in?
Well, if this is the case, then the upside for the miners is very limited.
Gold Stocks and the PMs Perspective
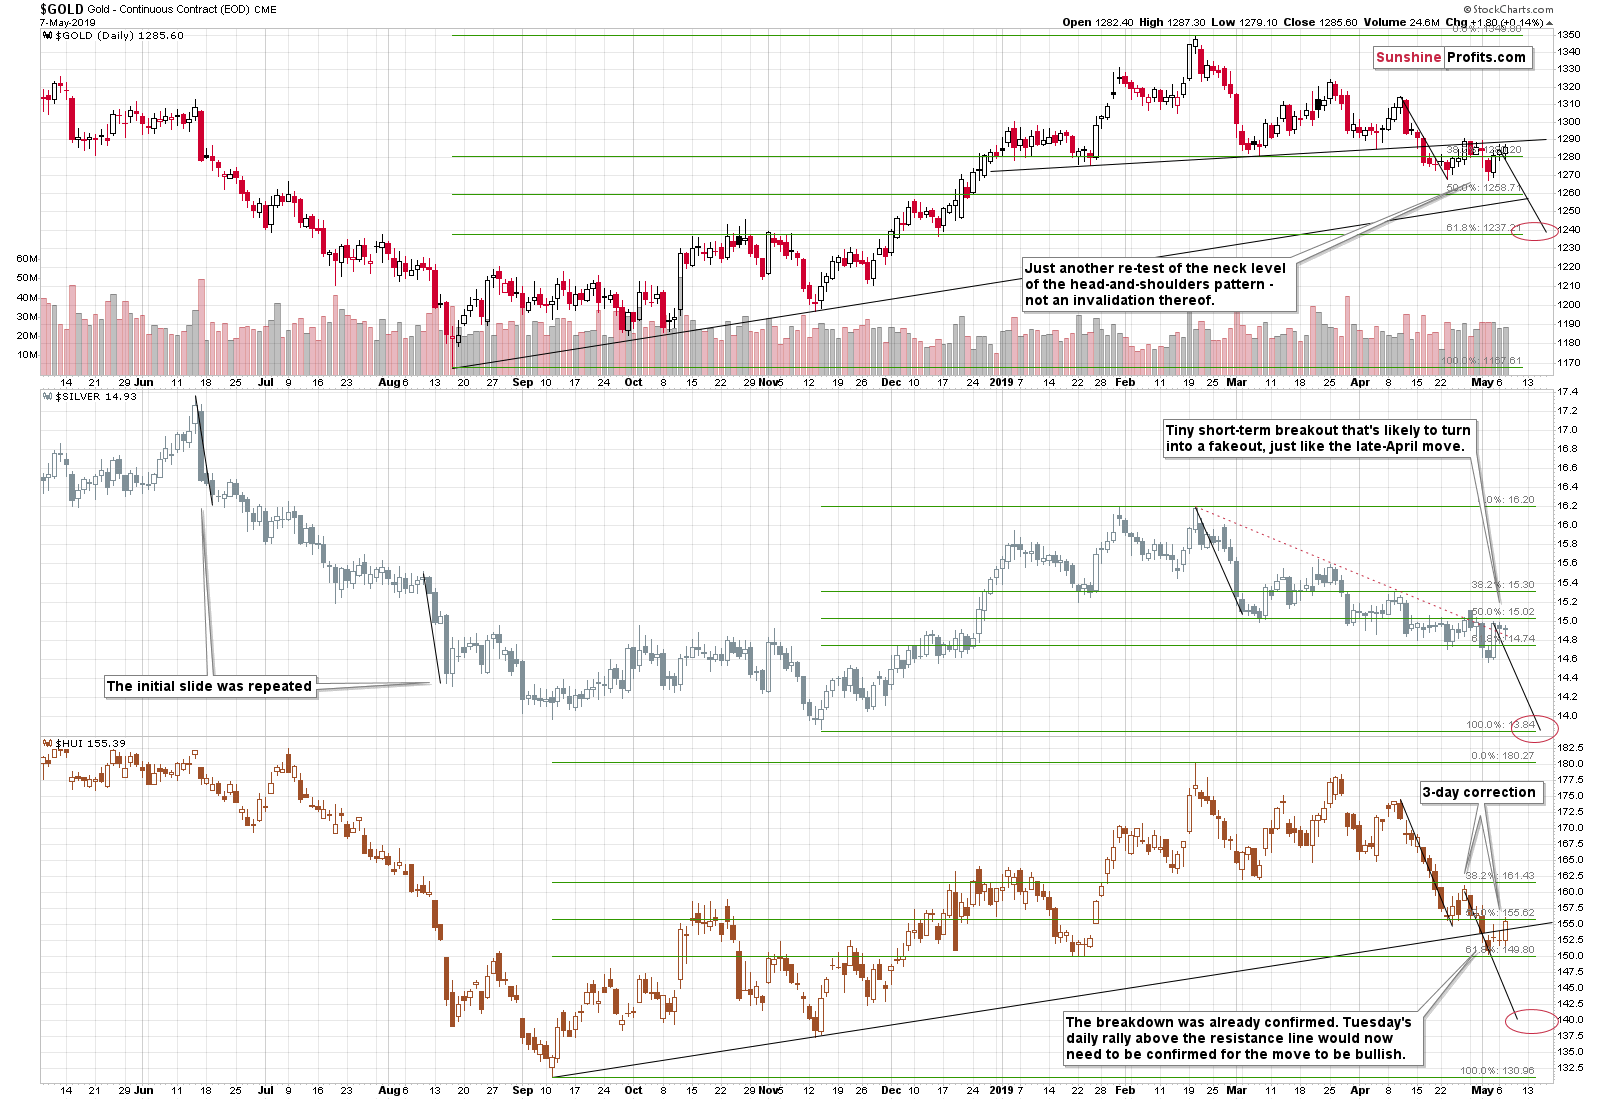
Gold stocks (at the very bottom on the above chart) might move to the late-April highs, the 38.2% Fibonacci retracement, or the early January highs, which would make the current upswing symmetrical to the early-January decline. As far as the latter is concerned, it might be likely (assuming that miners would move higher from here at all) as the miners have already proved to form such symmetrical patterns in the past. For instance, the early-November 2018 rally and top, was symmetrical to the early-October action. All the above points to approximately 162.5 as the possible upside target. "Possible" doesn't mean "likely", though.
However, the question in the title is a little biased, because it makes the additional upswing seem more likely than it actually is. The correct question would be if yesterday's upswing has actually changed anything. And the quick reply, is that it opened the door for possible bullish signs today and in the following days but that it was not yet one on its own.
The reasons are present in the surrounding markets (most notably in gold and the USD Index) and in the mining stock themselves. Yes, the mining stocks moved higher, but they already reached an important short-term resistance yesterday. Miners moved to the April low, thus verifying the breakdown below it. Moreover, the move higher that followed the April low took exactly 3 trading days and the most visible part of the decline took place on the third day. Exactly the same thing happened once again. And what followed next in the previous case? The miners declined and their underperformance came back with vengeance.
Yes, the HUI Index moved above the rising resistance line, but:
- It has done so after already confirming the breakdown below this line, which makes the current move suspicious to say the least.
- There was no analogous move in the GDX ETF or the XAU Index.
Consequently, we are not making much of yesterday's move just yet. If the miners are truly strong, they will show this strong performance in the following days as well. For now, it seems that yesterday's move was either accidental, or that it was actually the case of miners providing a fake signal just before the turnaround. You know, the same thing happened in 2012.
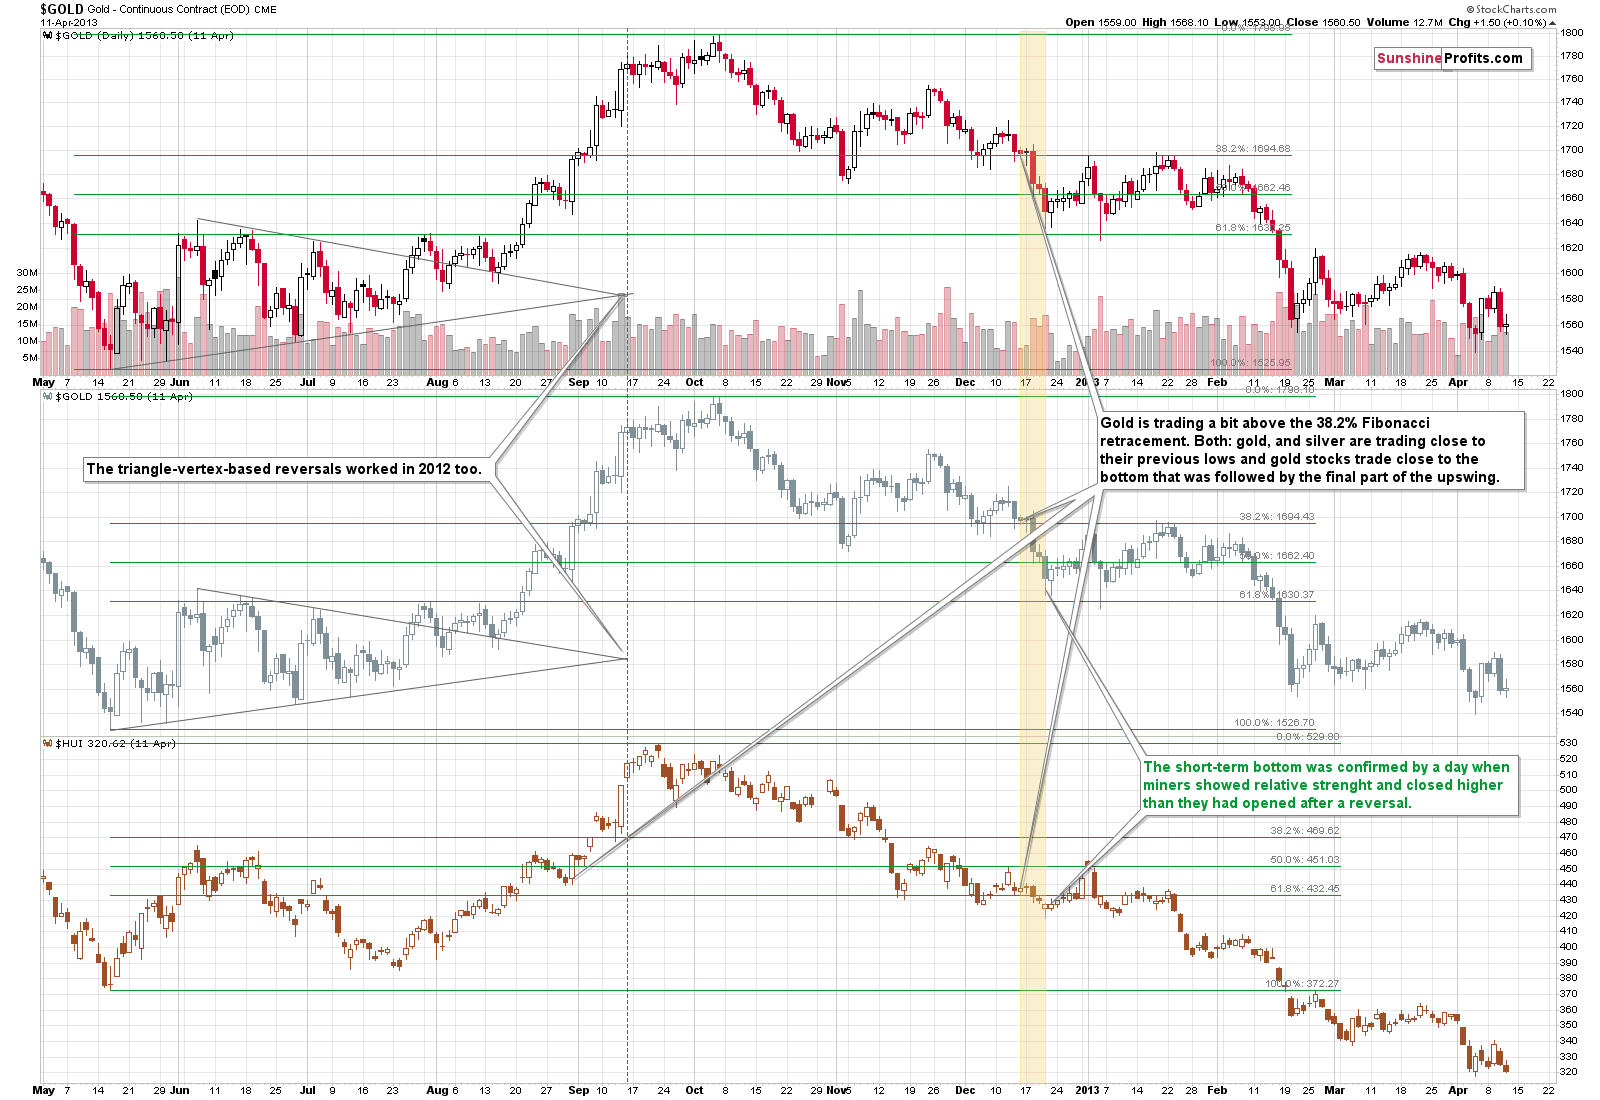
On December 12, 2012, the gold mining stock index soared for a day only to disappoint and decline in the following days. And it was during the part of the decline that is similar to what we see in the precious metals market right now.
So, we now have both: long-term similarity and very short-term analogy to the late-April 2019 upswing that suggest that yesterday's upswing was not a sign of strength, but rather something bearish.
Enter gold.
The yellow metal is still below the neck level of the head-and-shoulders pattern, which means that it's about to slide any day now. This formation has been confirmed in terms of time and by 2 verifications of the breakdown below the neck level. Gold moved back to this level without breaking higher. The neck level is proving to be a solid resistance, just like it should.
This is exactly the situation where one better be very suspicious of any signs that are bullish at first sight, including mining stocks' rally. Given the bearish forecast for gold price, it's very likely that the entire precious metals sector will shortly move lower, not higher. Mining stocks' rally was therefore much more likely a bluff than anything more.
Let's recall our recent Alert about the powerful analogies to the 2012-2013 decline and their confirmations. Here's another inspiration when looking for the short-term signs of the upcoming PMs moves.
The likely impact of the USD Index is also something that's worth keeping in mind.
Checking on the USD Index
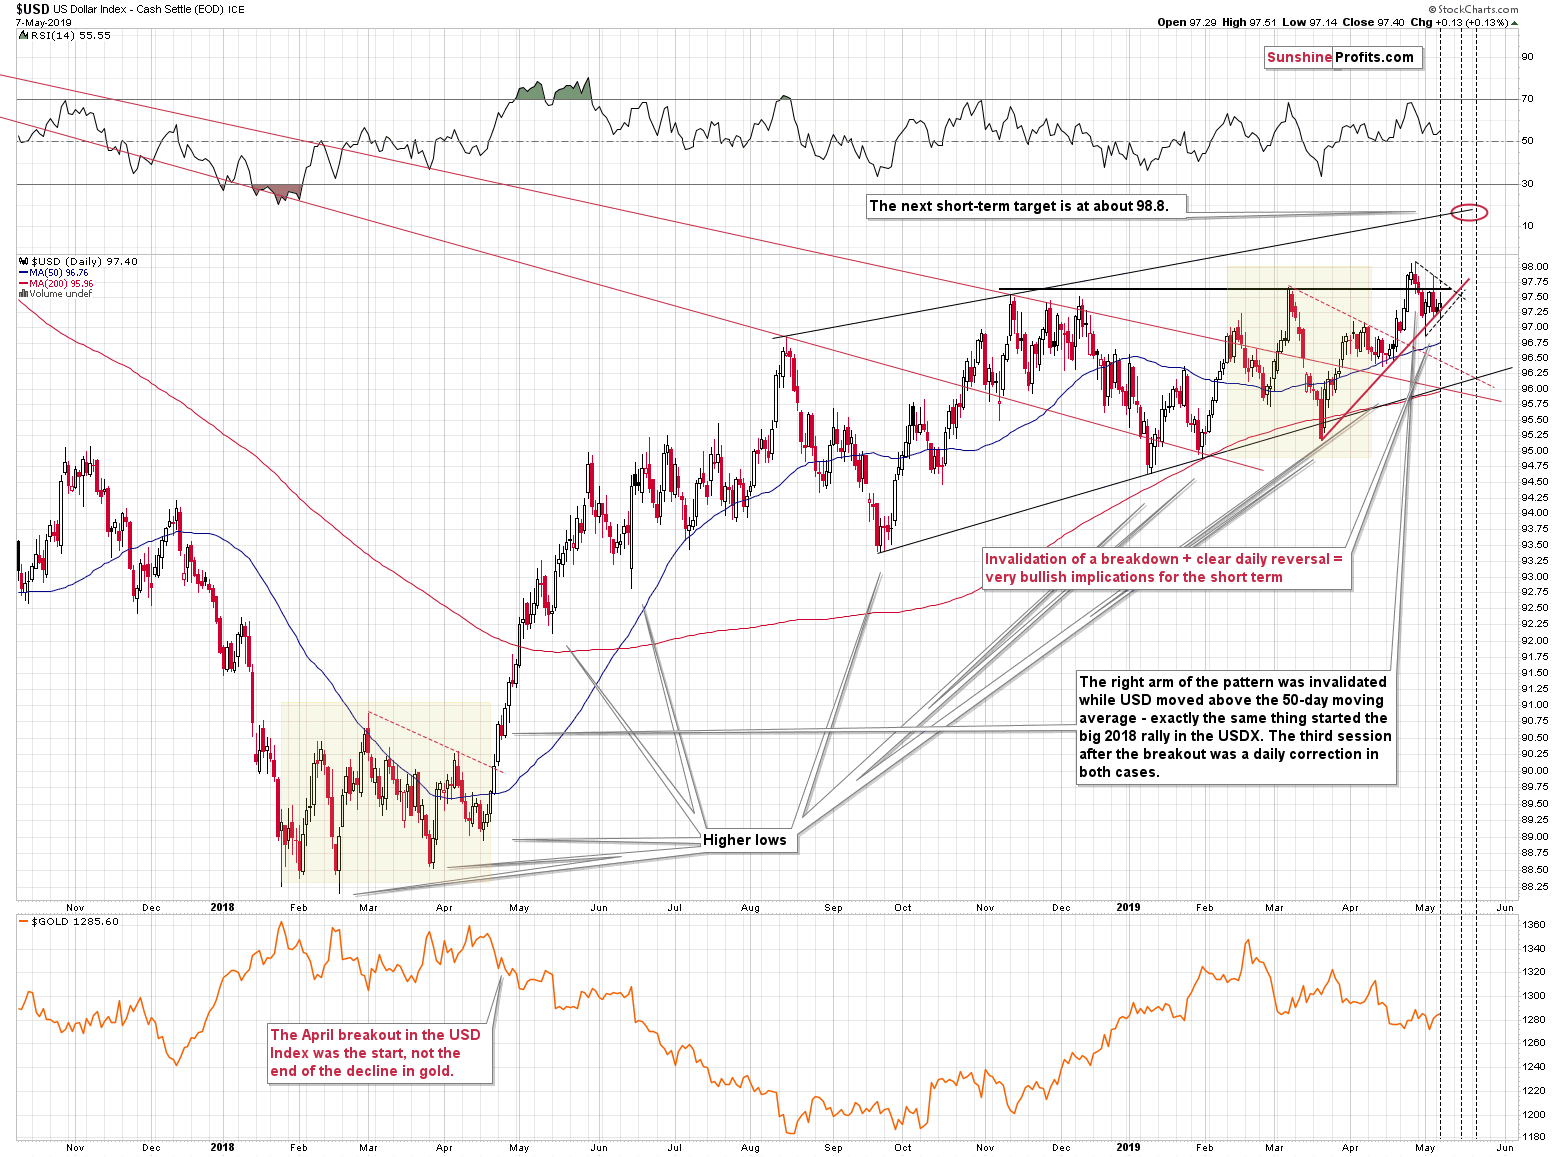
The US currency is trading very close to this and last year's highs and it seems ready to finally break above them. Why should it be successful this time? Naturally, there is no certainty here, but the simple fact that we saw higher lows for so many months suggests that the accumulated bullish pressure is enormous. Like in a coiled spring.
For months, the USD Index wanted to rally, but every time it moved to or above 97, it was hammered down. But it recovered each time. And each time it was stronger than before. That's what the higher lows actually mean - more buying power and less selling pressure that has is reflected in the bottoms being formed incrementally higher.
Even the late-March dovish surprise from the Fed wasn't able to break the above pattern. Yes, the USD Index declined as it was practically forced to, but since it really wanted to move higher, it recovered and rallied back up. In fact, about a month later, it temporarily moved to new medium-term highs.
This breakout was invalidated but unlike what we saw in March, the USDX didn't just keep on declining. It formed a big bullish daily reversal at the rising short-term support line, and it managed to stay above this line ever since. In fact, it's trading at it right now.
All this makes it likely that the USD Index will finally manage to break above the 2018 highs and to confirm this breakout. And what happens next? The enormous bullish pressure that has been building for months, will unfold and the USDX would likely soar - perhaps as sharply as it did in April and May last year.
And what if it doesn't? Then we'd probably have another higher low and then the breakout to new highs. The action in the USDX that followed Fed's dovish comments in March shows that it's much more likely that we will not have to wait long for the USD's breakout. The implications for the precious metals market are bearish.
Is this a situation, where a daily rally in the miners would make things bullish for the entire PM sector? No.
Gold Options' Expiration
Before summarizing, we would like to address a request that we received from our subscriber. One question is about the implications of the upcoming gold options' expirations:
My theory- the significant drop in price of both gold and silver will occur during the 30 days after the May 17 option expiration and both metals will see a price rebound prior to the June 21 option expiration. This is based on the current volume of put/call options at certain prices in the May 17 and June 21 contracts. Your comments are appreciated.
In our opinion, this might very well be the case, but it doesn't have to be so. There are certain days or news releases after which the uncertainty is removed from the market (temporarily, but still) to a considerable extent. Before these days, the investors kind of "hold their breath" waiting what happens and only after the given day, or announcement, can the markets resume their previous trends (or change them at least for some time, if the news is significant enough). This mechanism is quite powerful, and it often dwarfs the logical implication of the news that is being announced. "Buy the rumor, sell the news" is quite often what happens. Remember how everyone thought that silver will go "todamoon" after the first silver ETF (SLV) starts trading? Silver indeed rallied, but only before the launch - after the ETF started operating, silver plunged.
These crucial moments can be based on news announcements, like the above-mentioned case with the SLV ETF. They can be based on technical formations or on cyclical turning points. And they can be based on derivatives' expiration dates. It's no secret that when there's a lot of volume and open interest in the derivative products (futures and options), weird price moves tend to take place. Quick Internet search for "triple witching" or "quad witching" will prove it. In short, there are big tensions on the market close to the expiration date, because both sides of the contract want to push the underlying asset in their favorable direction.
There are actually two effects in play: one that's exactly as outlined above, and the second is that people expect things to get weird around option expiration dates, and thus that they may choose to have a nice cold pint and wait for all this to blow over.
Both effects could mean that the decline in the gold price is delayed for another 9-10 days. "Could mean" doesn't mean that it "will mean" it. There are also other factors, investors might be waiting for that will actually trigger the decline. And - let's not forget what the ultimate trigger for gold is (we just posted the above article, please click the above link for more details or navigate to the Gold News section under Services & Products menu on our website).
Another thing that could make the markets move right away is the triangle-vertex-based reversal in the USD Index. There are three nearby reversals of this kind and one of them was yesterday. The other ones are on May 15th and May 21st. This suggests that the USD Index is likely to move right away and then form reversals on the above dates. The first of the dates is very close to the May 17th expiration date, so it might be the case that we'll see a reversal at that time. However, given the current reversal, it might be the case that the USDX actually soars right away and forms a temporary top at that time. In this case, gold would slide now, and form a temporary bottom next week.
What's the takeaway? That while the exact day-to-day structure of the decline is not crystal clear, it might be better to focus on what is very clear. And that is gold's likelihood to decline at all. It's better to be prepared for the very likely outcome, while accepting some kind of uncertainty on a day-to-day basis. Our take on this situation is a tactical one. We'll position ourselves where it appears that we have the edge, without exposing ourselves (for instance by staying on the sidelines now, aiming to enter on the day when the slide starts) to the risk of missing the opportunity. In other words, it seems best to keep the short positions intact.
Summary
Summing up, the link to the 2012-2013 decline continues to support much lower prices in the following months, weeks, and - likely - days. Just as one swallow doesn't make a summer, one day of strength in the mining stocks doesn't change the overall trend of underperformance. Don't let this short-term back-and-forth trading fool you. Based on the confirmed head-and-shoulders top in gold, the building pressure in the USD Index, and the analogy to the way the precious metals market declined in 2012 and 2013, the next short-term bottom might be reached as early as this or the next week - in a volatile manner. This upcoming bottom might be a good opportunity to go long, but we are definitely not in this kind of situation right now. Conversely, in our view, short positions in the PMs are likely to generate sizable profits, just like the ones in forex and crude oil just did.
To summarize:
Trading capital (supplementary part of the portfolio; our opinion): Full short position (250% of the full position) in gold, silver, and mining stocks is justified from the risk/reward perspective with the following stop-loss orders and exit profit-take price levels:
- Gold: profit-take exit price: $1,241; stop-loss: $1,357; initial target price for the DGLD ETN: $51.87; stop-loss for the DGLD ETN $39.87
- Silver: profit-take exit price: $13.81; stop-loss: $15.72; initial target price for the DSLV ETN: $39.38; stop-loss for the DSLV ETN $26.97
- Mining stocks (price levels for the GDX ETF): profit-take exit price: $18.41; stop-loss: $24.17; initial target price for the DUST ETF: $34.28; stop-loss for the DUST ETF $15.47
In case one wants to bet on junior mining stocks' prices (we do not suggest doing so - we think senior mining stocks are more predictable in the case of short-term trades - if one wants to do it anyway, we provide the details), here are the stop-loss details and target prices:
- GDXJ ETF: profit-take exit price: $26.42; stop-loss: $35.67
- JDST ETF: profit-take exit price: $78.21 stop-loss: $30.97
Long-term capital (core part of the portfolio; our opinion): No positions (in other words: cash)
Insurance capital (core part of the portfolio; our opinion): Full position
Whether you already subscribed or not, we encourage you to find out how to make the most of our alerts and read our replies to the most common alert-and-gold-trading-related-questions.
Please note that the in the trading section we describe the situation for the day that the alert is posted. In other words, it we are writing about a speculative position, it means that it is up-to-date on the day it was posted. We are also featuring the initial target prices, so that you can decide whether keeping a position on a given day is something that is in tune with your approach (some moves are too small for medium-term traders and some might appear too big for day-traders).
Plus, you might want to read why our stop-loss orders are usually relatively far from the current price.
Please note that a full position doesn't mean using all of the capital for a given trade. You will find details on our thoughts on gold portfolio structuring in the Key Insights section on our website.
As a reminder - "initial target price" means exactly that - an "initial" one, it's not a price level at which we suggest closing positions. If this becomes the case (like it did in the previous trade) we will refer to these levels as levels of exit orders (exactly as we've done previously). Stop-loss levels, however, are naturally not "initial", but something that, in our opinion, might be entered as an order.
Since it is impossible to synchronize target prices and stop-loss levels for all the ETFs and ETNs with the main markets that we provide these levels for (gold, silver and mining stocks - the GDX ETF), the stop-loss levels and target prices for other ETNs and ETF (among other: UGLD, DGLD, USLV, DSLV, NUGT, DUST, JNUG, JDST) are provided as supplementary, and not as "final". This means that if a stop-loss or a target level is reached for any of the "additional instruments" (DGLD for instance), but not for the "main instrument" (gold in this case), we will view positions in both gold and DGLD as still open and the stop-loss for DGLD would have to be moved lower. On the other hand, if gold moves to a stop-loss level but DGLD doesn't, then we will view both positions (in gold and DGLD) as closed. In other words, since it's not possible to be 100% certain that each related instrument moves to a given level when the underlying instrument does, we can't provide levels that would be binding. The levels that we do provide are our best estimate of the levels that will correspond to the levels in the underlying assets, but it will be the underlying assets that one will need to focus on regarding the signs pointing to closing a given position or keeping it open. We might adjust the levels in the "additional instruments" without adjusting the levels in the "main instruments", which will simply mean that we have improved our estimation of these levels, not that we changed our outlook on the markets. We are already working on a tool that would update these levels on a daily basis for the most popular ETFs, ETNs and individual mining stocks.
Our preferred ways to invest in and to trade gold along with the reasoning can be found in the how to buy gold section. Additionally, our preferred ETFs and ETNs can be found in our Gold & Silver ETF Ranking.
As a reminder, Gold & Silver Trading Alerts are posted before or on each trading day (we usually post them before the opening bell, but we don't promise doing that each day). If there's anything urgent, we will send you an additional small alert before posting the main one.
=====
Latest Free Trading Alerts:
Crude oil has had an eventful session yesterday. It has closed the opening gap and the bulls have been building upon their gains till the session's close. Earlier today however, the price appears to be rolling over and heading south. Is all hope for higher oil lost? The bulls have shown to be quite tireless. Can they pull a rabbit out of their hats shortly?
Do the Oil Bulls Have Any Aces Left Up Their Sleeves?
The US unemployment rate dropped in April to 3.6 percent, a level not seen since December 1969. So, everything must be great. With the exception of the renewed worries about the U.S.-China trade deal. On Sunday, President Trump surprised the markets again. What did he write exactly and how could his tweets affect the gold market?
Record-Low Unemployment and Trump's Message to China: Implications for Gold
=====
Thank you.
Sincerely,
Przemyslaw Radomski, CFA
Editor-in-chief, Gold & Silver Fund Manager

