

Briefly: in our opinion, full (250% of the regular size of the position) speculative short position in gold, silver, and mining stocks is justified from the risk/reward perspective at the moment of publishing this Alert.
Gold has apparently turned the corner and we were not surprised by the upside move. However, there is more to this than meets the eye. Today, we’ll interpret this upswing, the expectations it carries and set it all in the larger context. Yes, it’s time to discuss the striking similarity and implications of the 2012-2013 – now link in gold. Its meaning and the likely path forward for the yellow metal. Would it justify going long gold? If so, then when and based on what? We want you to be as prepared as we are - it’s high time.
Last Monday we outlined the breathtaking similarity between what’s happening now and what happened in 2012 and 2013. The similarity is based not only on what happened in gold and multiple details that we can notice on gold’s chart. There’s much more to this analogy than just the gold market. Silver’s price moves and details regarding it (even the recent triple-top formation) as well as the way in which the mining stocks moved lower (and – at times – higher) provide multiple confirmations of the existence of the 2012-2013 – now link. The long-term analogy is likely to have long- and medium-term implications. However, there is still a good chance that gold is going to repeat its previous moves also over the short term. While the history doesn’t have to repeat itself to the letter (it barely ever does), it could rhyme to the extent that makes forecasting gold’s next short-term price swings much easier. These are the details that we will focus on in today’s analysis.
But first, let’s look at what happened from the weekly point of view – after all, a weekly reversal appears to be a huge deal. But is it really?
The Apparent Bullishness of Gold’s Reversal
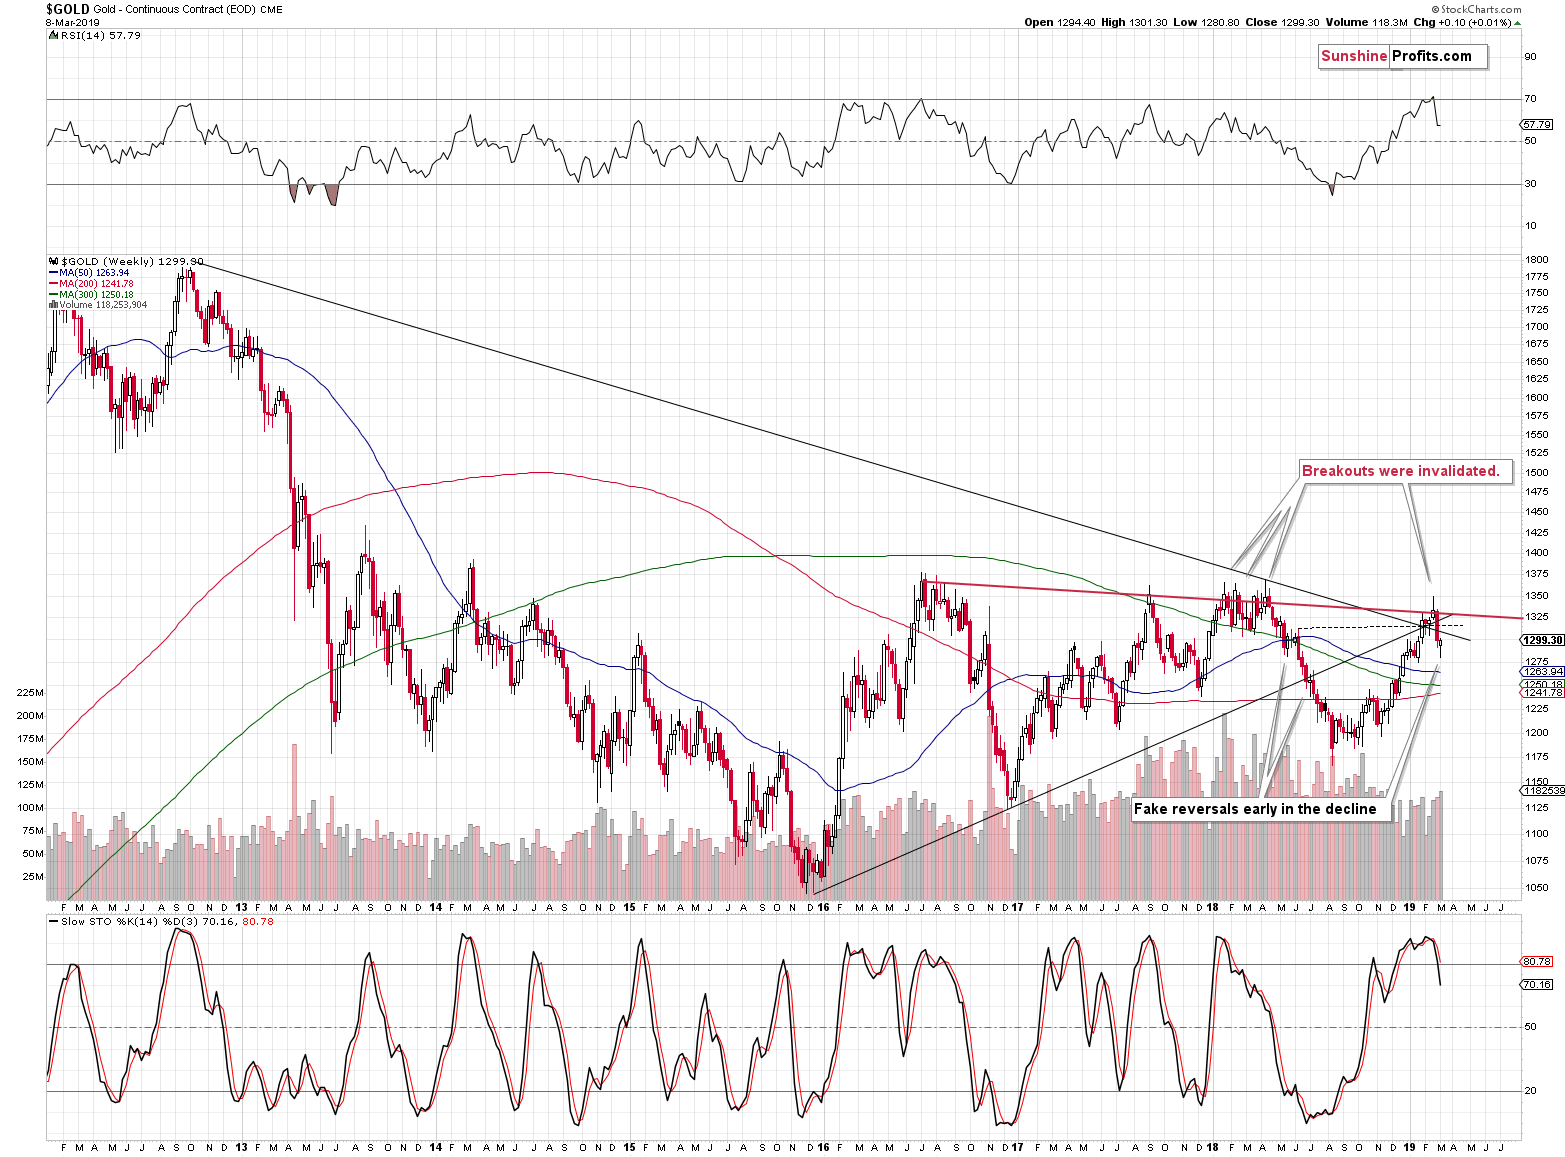
It’s bullish on a stand-alone basis, but comparing last week’s reversal to the most similar moves form the recent past – the mid-2018 reversals – suggests otherwise. The early-May 2018 reversal and the early-July 2018 reversal were both just pauses within the broader decline. The weekly reversals were followed by only slightly higher prices and then by much bigger declines. It seems to have been a better choice to simply have waited out the tiny (from the medium-term point of view) corrections than chase the market higher. That proved to be a very tricky business.
On the bullish note, last week’s reversal was confirmed by significant volume, which adds to its credibility.
Should we therefore take last week’s candlestick regular implications into account, or should we pay attention to the most recent analogy? Should we view it as bullish or bearish? Both interpretations have their merits, so it seems prudent to view last week’s performance as neutral. This means that it didn’t change the very bearish implications for the next several months.
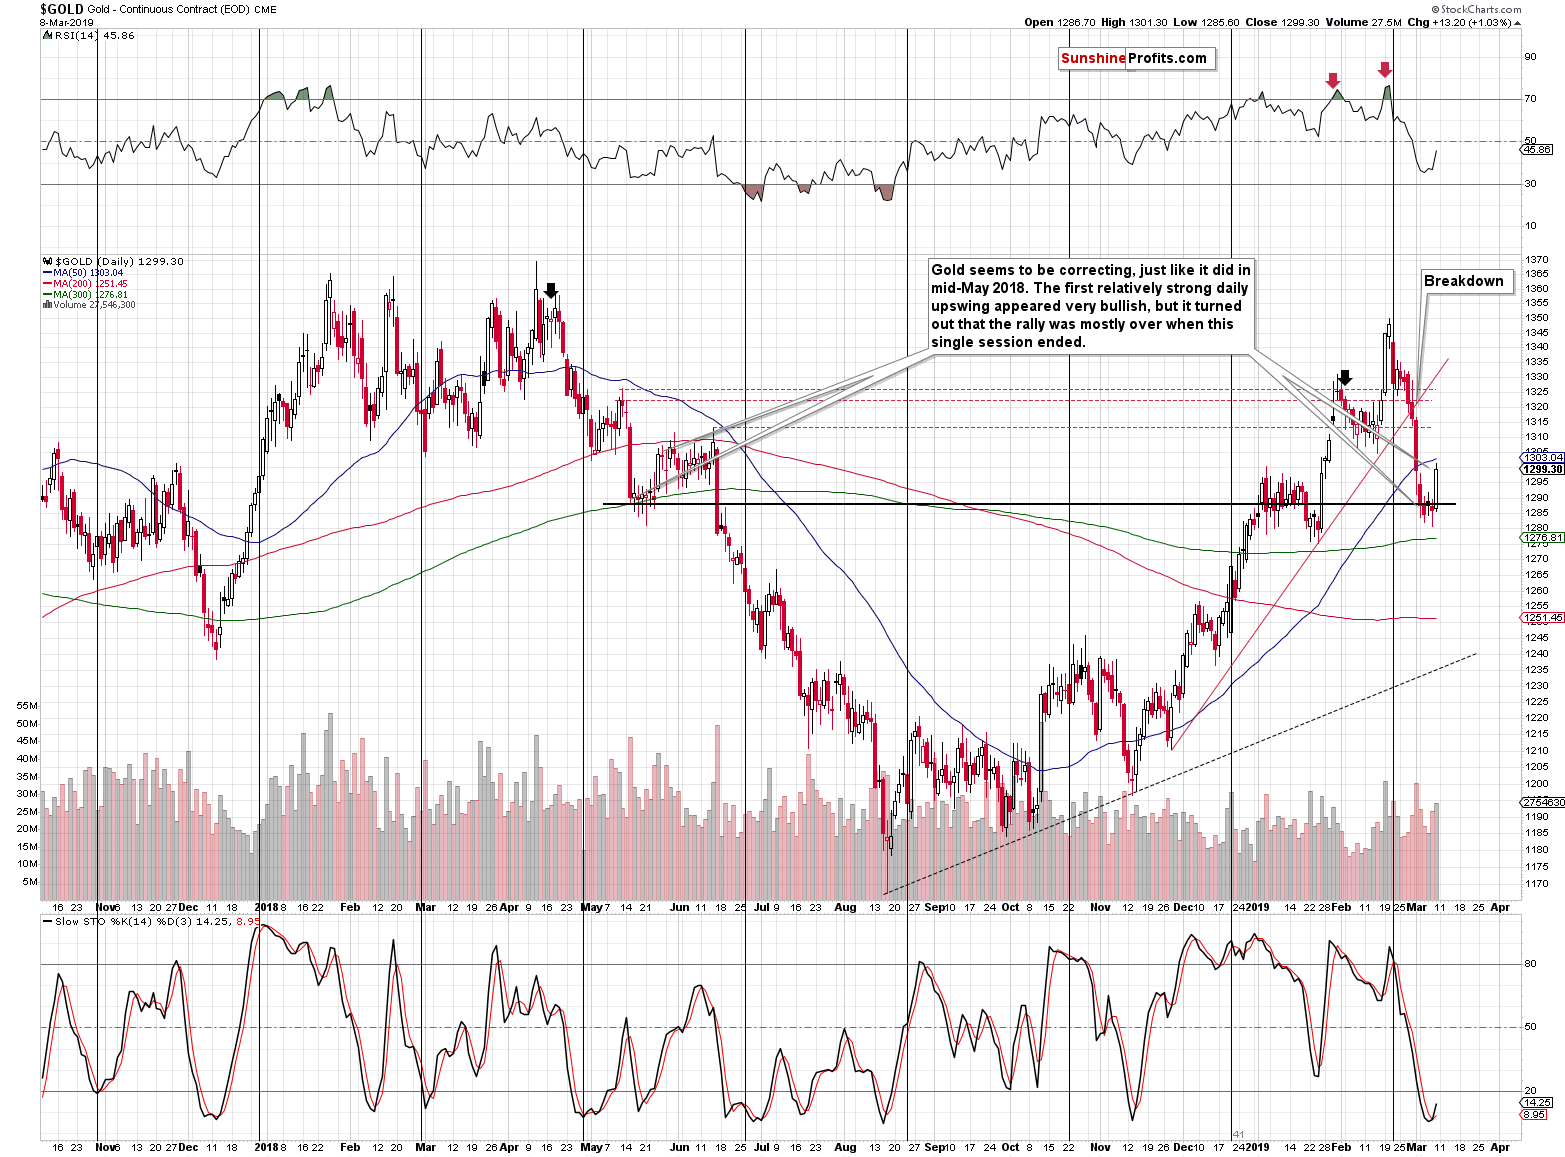
On Friday, we wrote that gold could move to about $1,310 or so, and it moved to about $1,300 – the previous highs. It also closed the day below the 50-day moving average, which – as you’ll soon see – is an important clue. So far nothing unexpected took place on the gold market front.
What about the rest of the precious metals complex?
Silver and Gold Miners Update
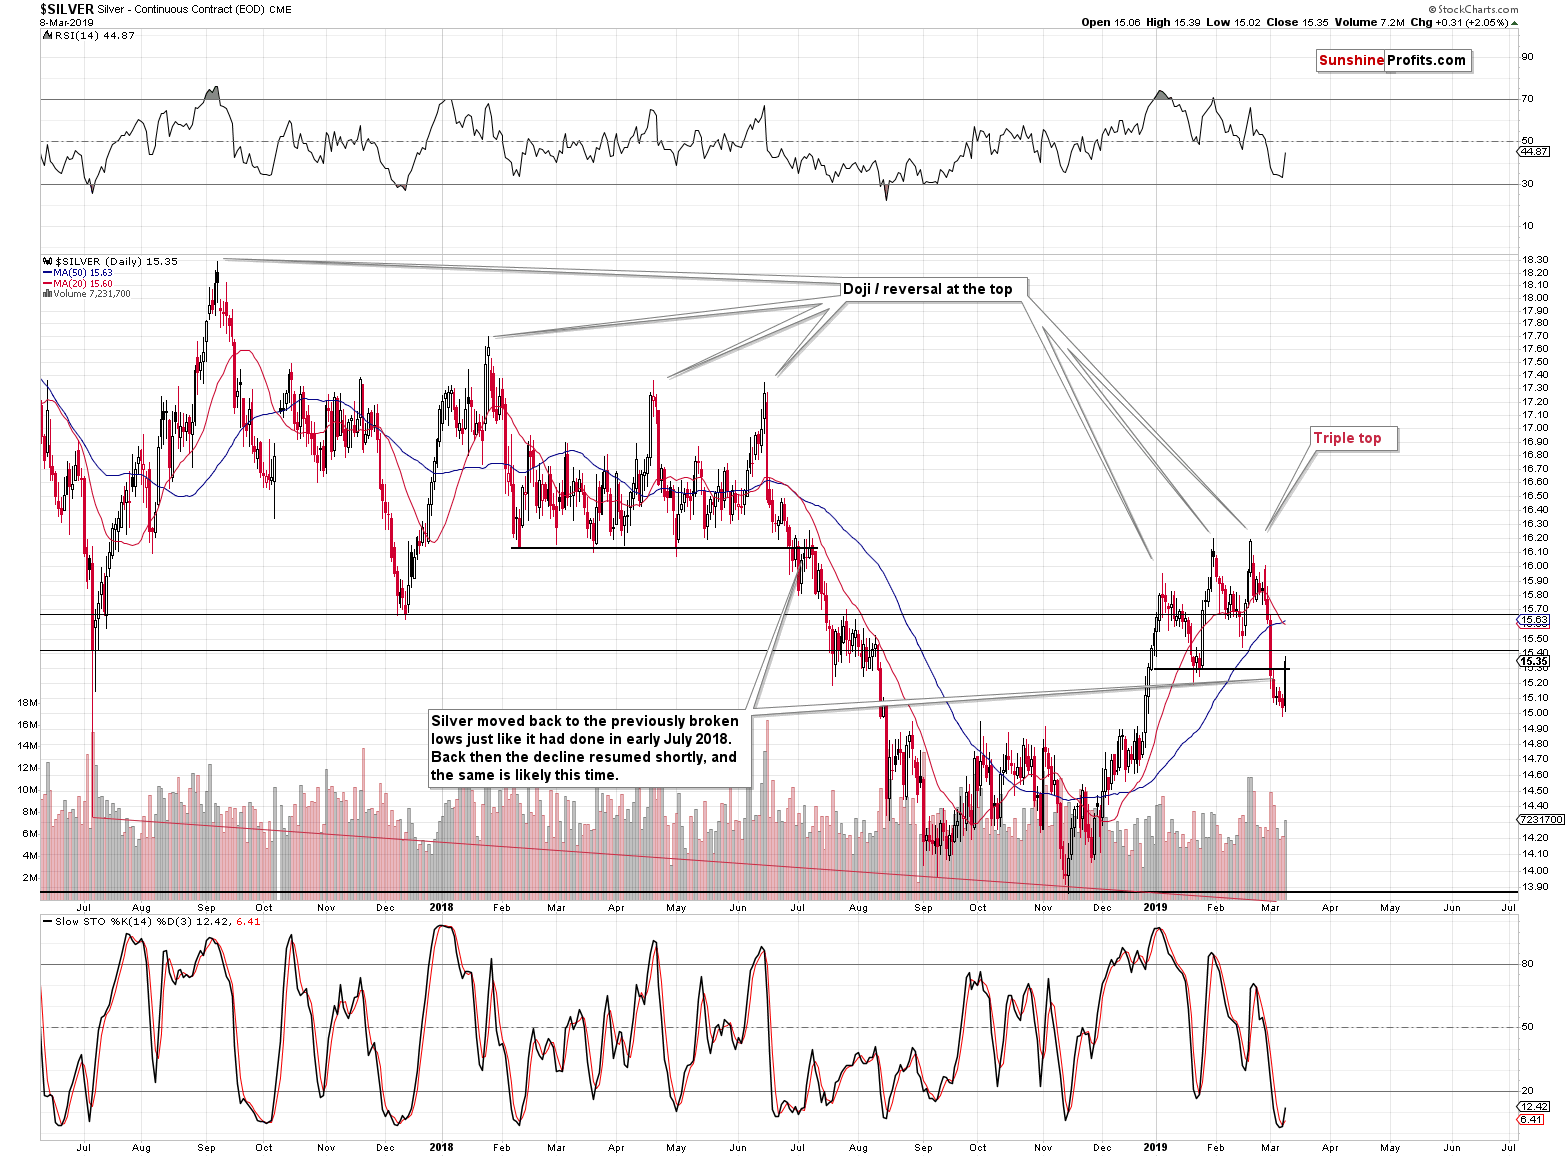
On Thursday, we wrote that the white metal was ready to decline once again, however, we also emphasized that this didn’t rule out the possibility of silver moving first back to the previously broken support levels.
That’s exactly what we saw. Gold’s sister metal moved sharply higher, but it closed very close to the previous lows. We saw this kind of action twice during the previous big decline, so it’s not surprising to see it this time again. In both: early July and late July 2018, silver moved back to the previously broken lows and verified them as resistance before sliding once again.
In other words, Friday’s upswing is not a silver game-changer. It’s a business-as-usual action. The outlook remains bearish.
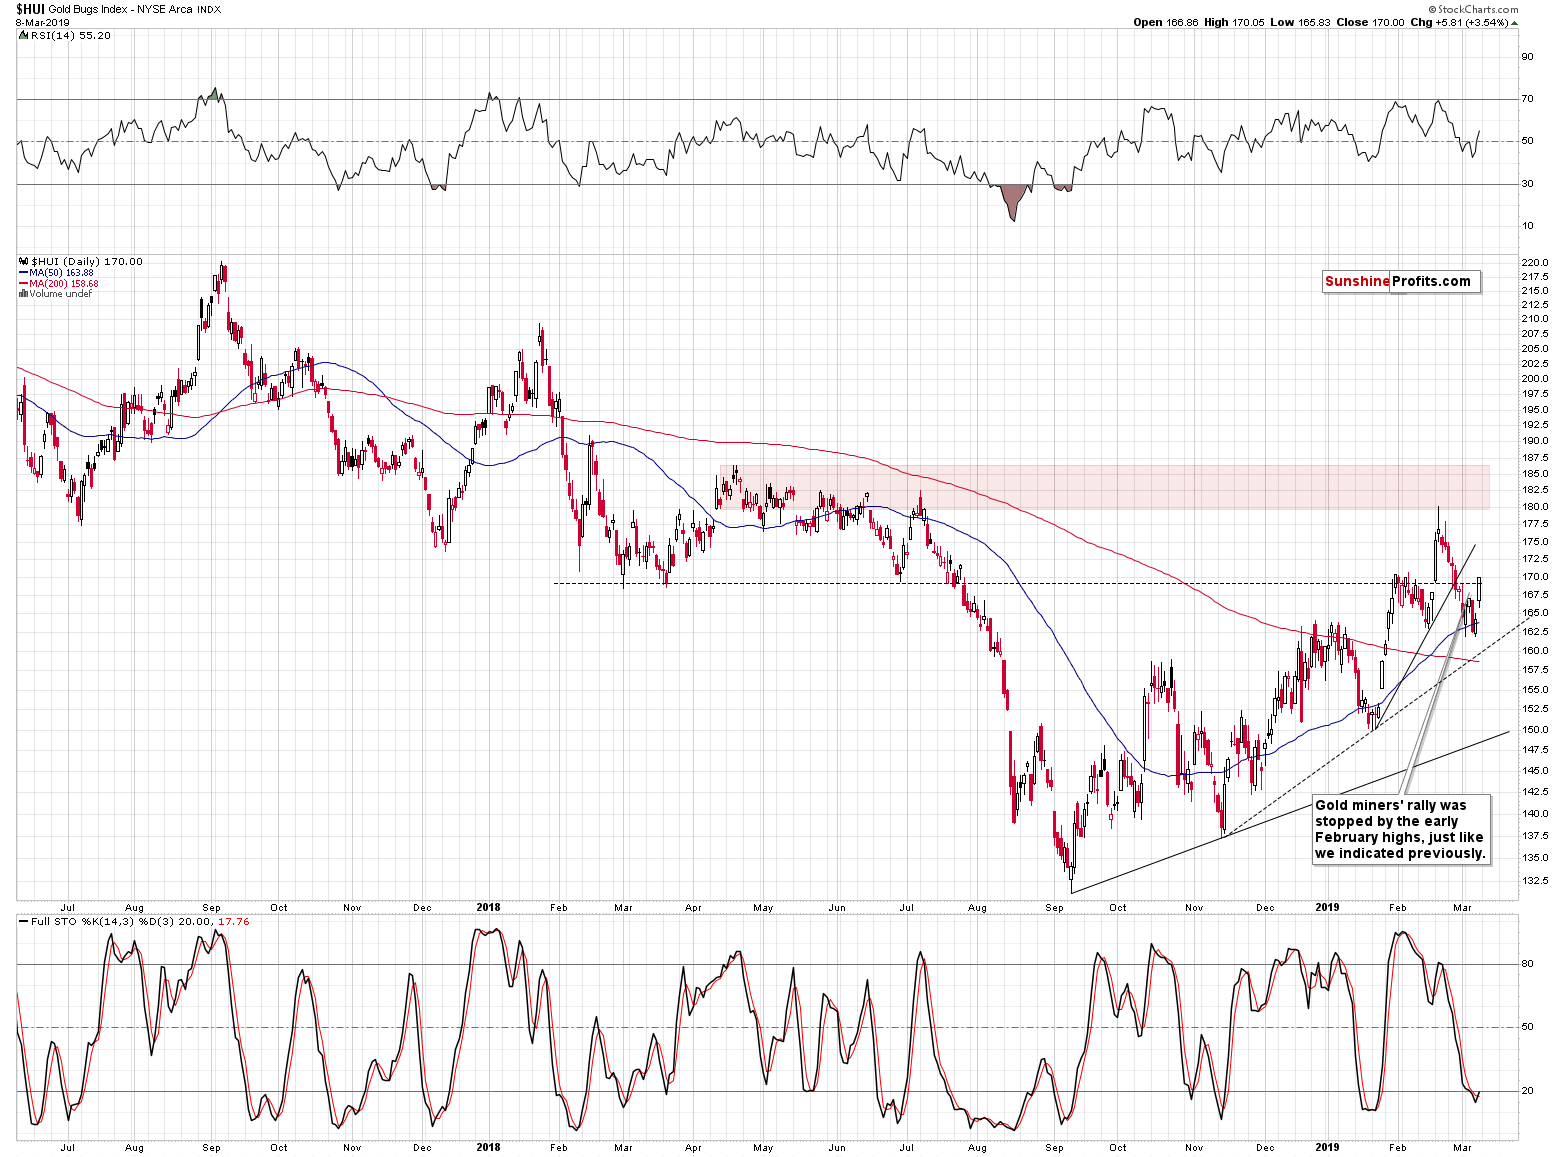
We had warned that miners could come back to their early-February highs, and that’s exactly what happened. Miners showed short-term strength as neither gold, nor silver moved close to their respective early February-highs, but let’s keep in mind that gold miners’ strength is just a short-term phenomenon. Over medium term, miners underperform and confirm the extremely bearish link between 2012-2013 and now.
A Check on the USD Link
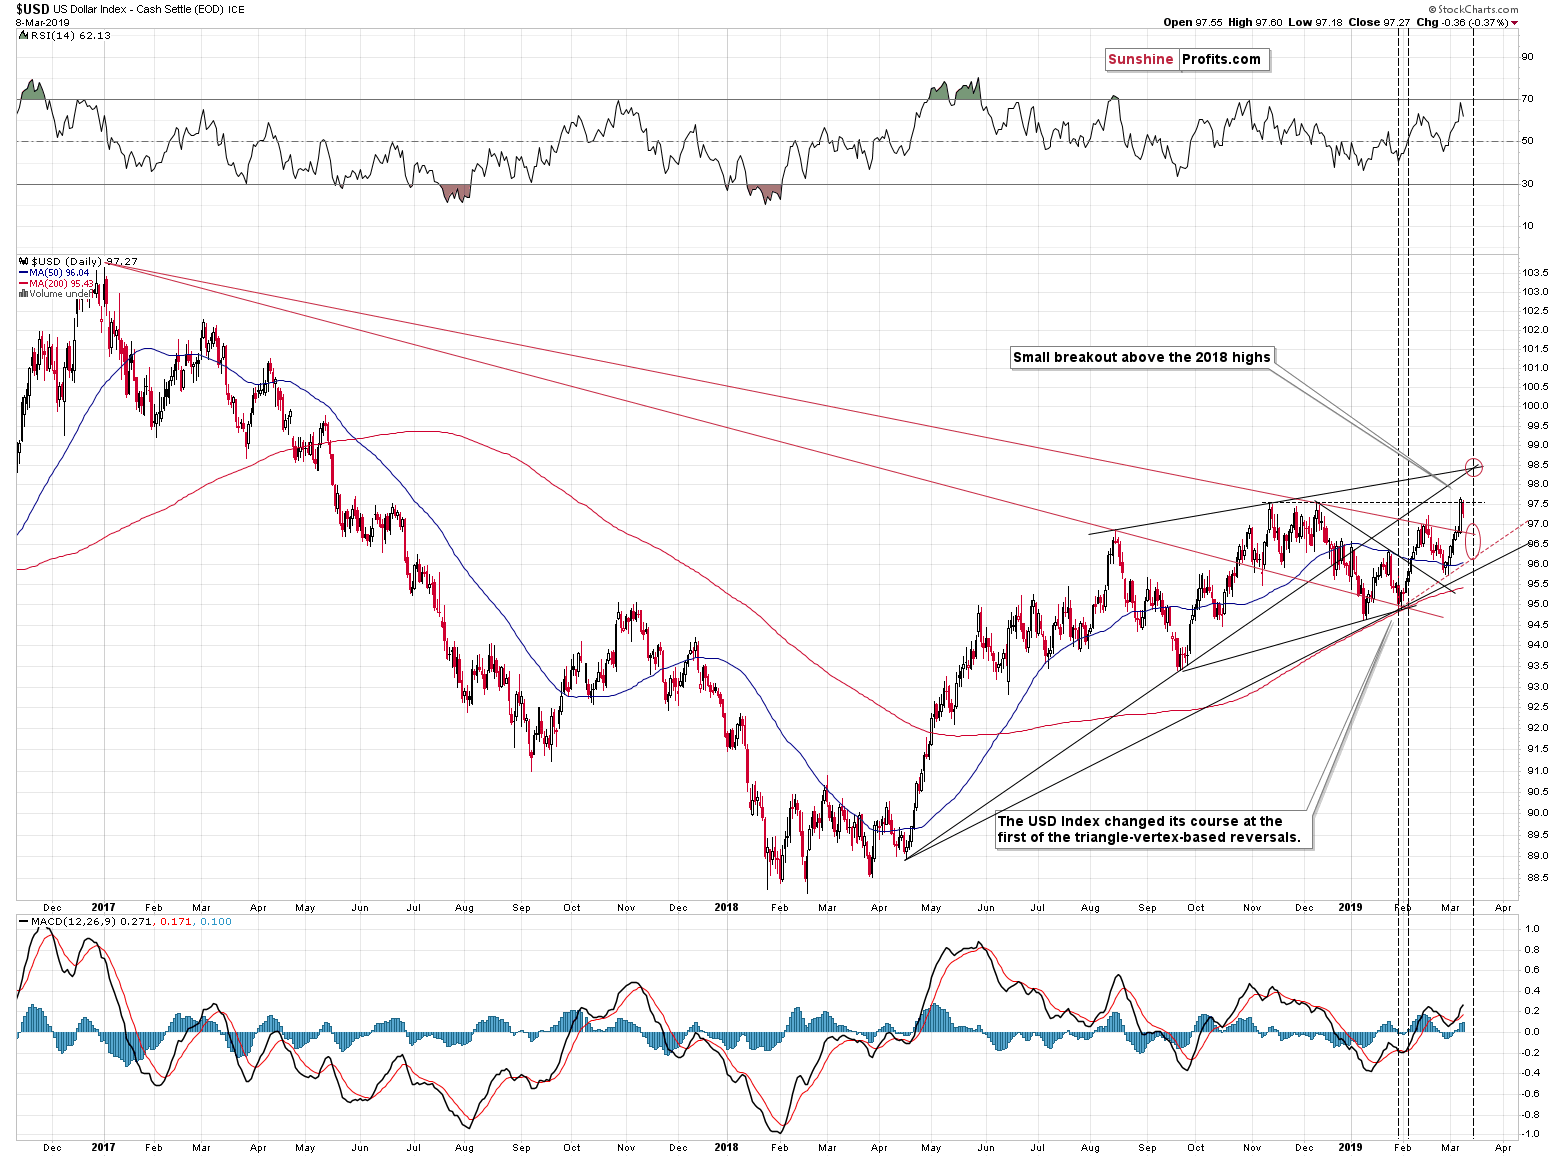
Meanwhile, the USD Index invalidated its tiny move above the previous highs and that was likely the thing that triggered the upswing in the PMs. The next triangle-vertex-based reversal is just around the corner and while it was possible that the USDX would rally and top at about 98.5 in several days, based on Friday’s invalidation, we need to consider a bearish resolution possibility.
The bearish possibility is USD’s decline to the previously broken declining resistance line (about 0.4 below Friday’s close) that could now be verified as support. That’s the nearest support and while the USD Index could move even lower based on the invalidation, it’s not very likely. After all, the fundamental situation for the EUR/USD just deteriorated based on ECB’s dovish turnaround comments.
Overall, implications for the precious market continue to be extremely bearish for the medium term. However, there is still a chance that we’ll see a bit more short-term strength before the slide continues. But – as you will also see below – it’s not particularly likely.
As we already discussed the very short-term price developments, let’s move to the most interesting part of today’s analysis – the details of the 2012-2013 – now link.
The 2012-2013 – Now Link in Gold
A technical pattern can be defined by a specific price action formations across many asset classes, or it can be based on similarity to previous price actions within the same instrument. This is called a self-similar pattern. Here, the similarity is indeed breathtaking between both periods. It’s huge when looking at it from the medium-term point of view. What is striking, however, is that we see a lot of similarity between gold’s final upswing before the big slide and the most recent upswing. And the same goes for the very initial part of the decline. This means that the decline could repeat itself to a degree more precise and bigger than one might expect.
Before moving to implications, let’s take a look at how similar the recent rally was to the one that we saw in mid-2012.
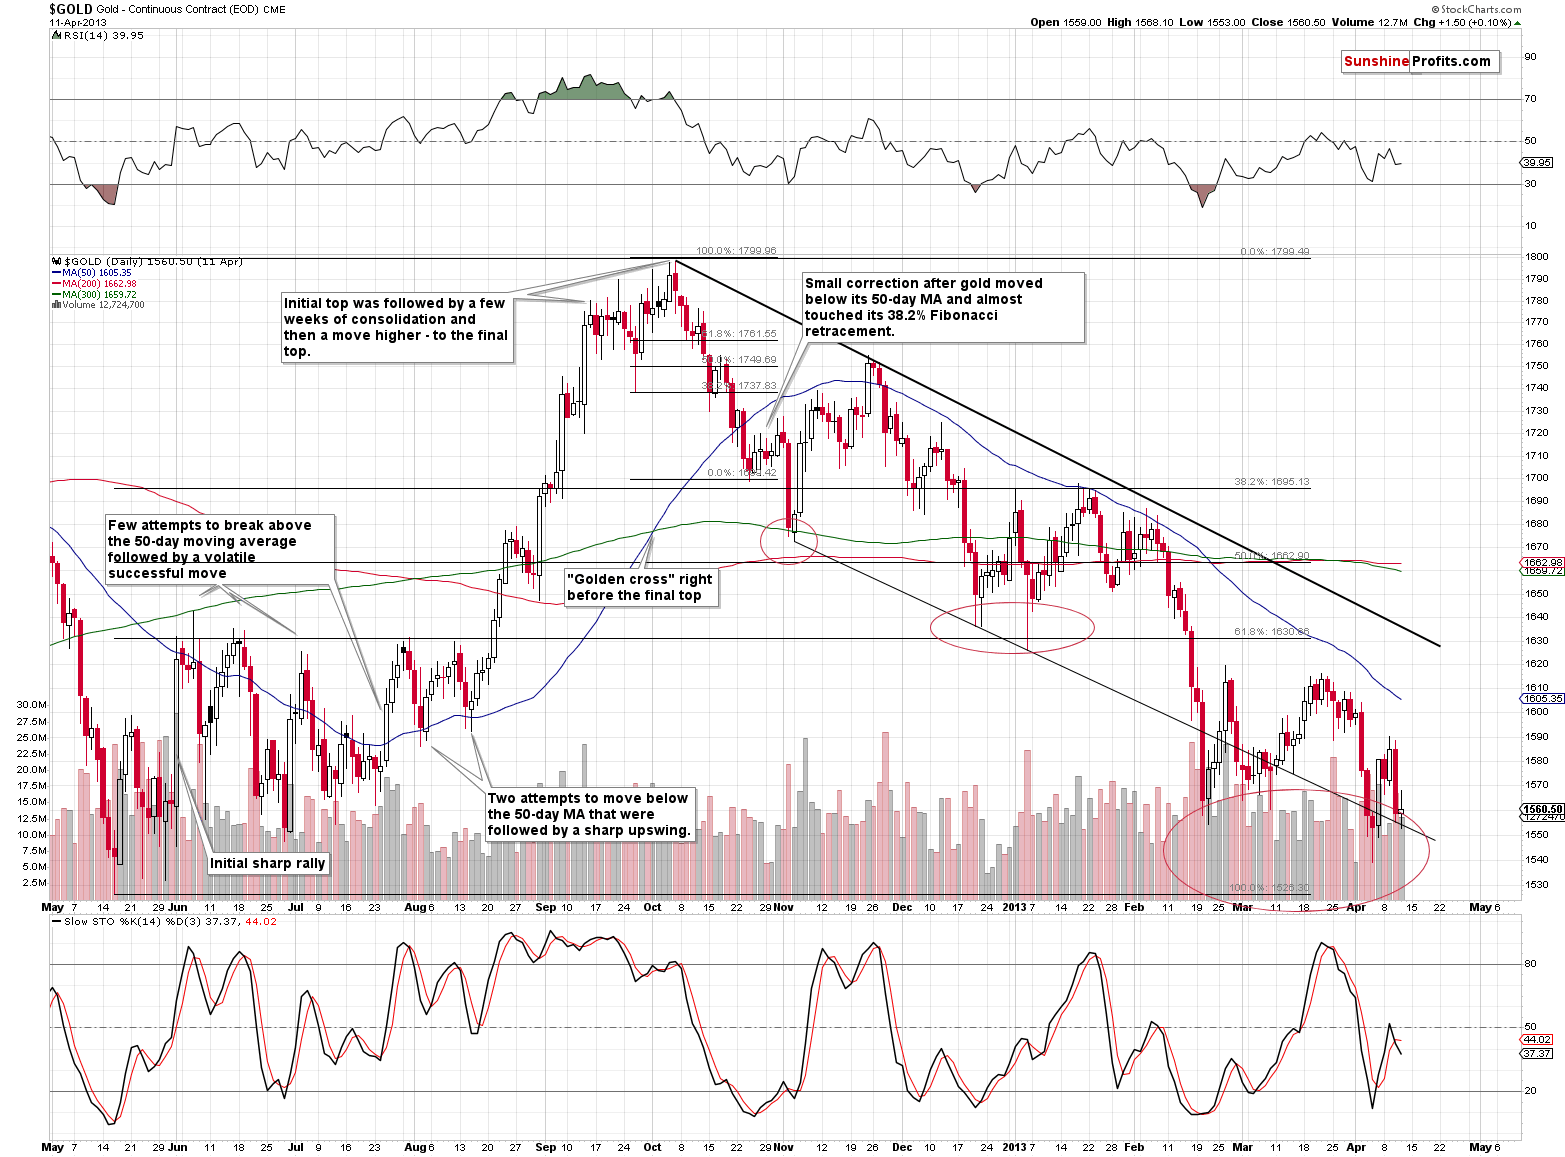
Both rallies started in a sharp manner – gold soared and then tried to break above the 50-day moving average for a few times. In both 2012 and 2018, it managed to do so – in a sharp manner – only several failed attempts. Once the 50-day MA was broken, gold moved briefly below it twice, forming higher highs. The last highs were formed in mid-August 2012 and in late-November 2018. Then gold rallied in a rather sharp manner.
There were a few pauses and gold topped in a similar manner on both occasions: there was an initial top in early September 2012 and in late January 2019, then a few weeks of temporarily lower prices and a volatile move higher – to the final top.
That’s exactly what we saw before the October 2012 and February 2019 tops.
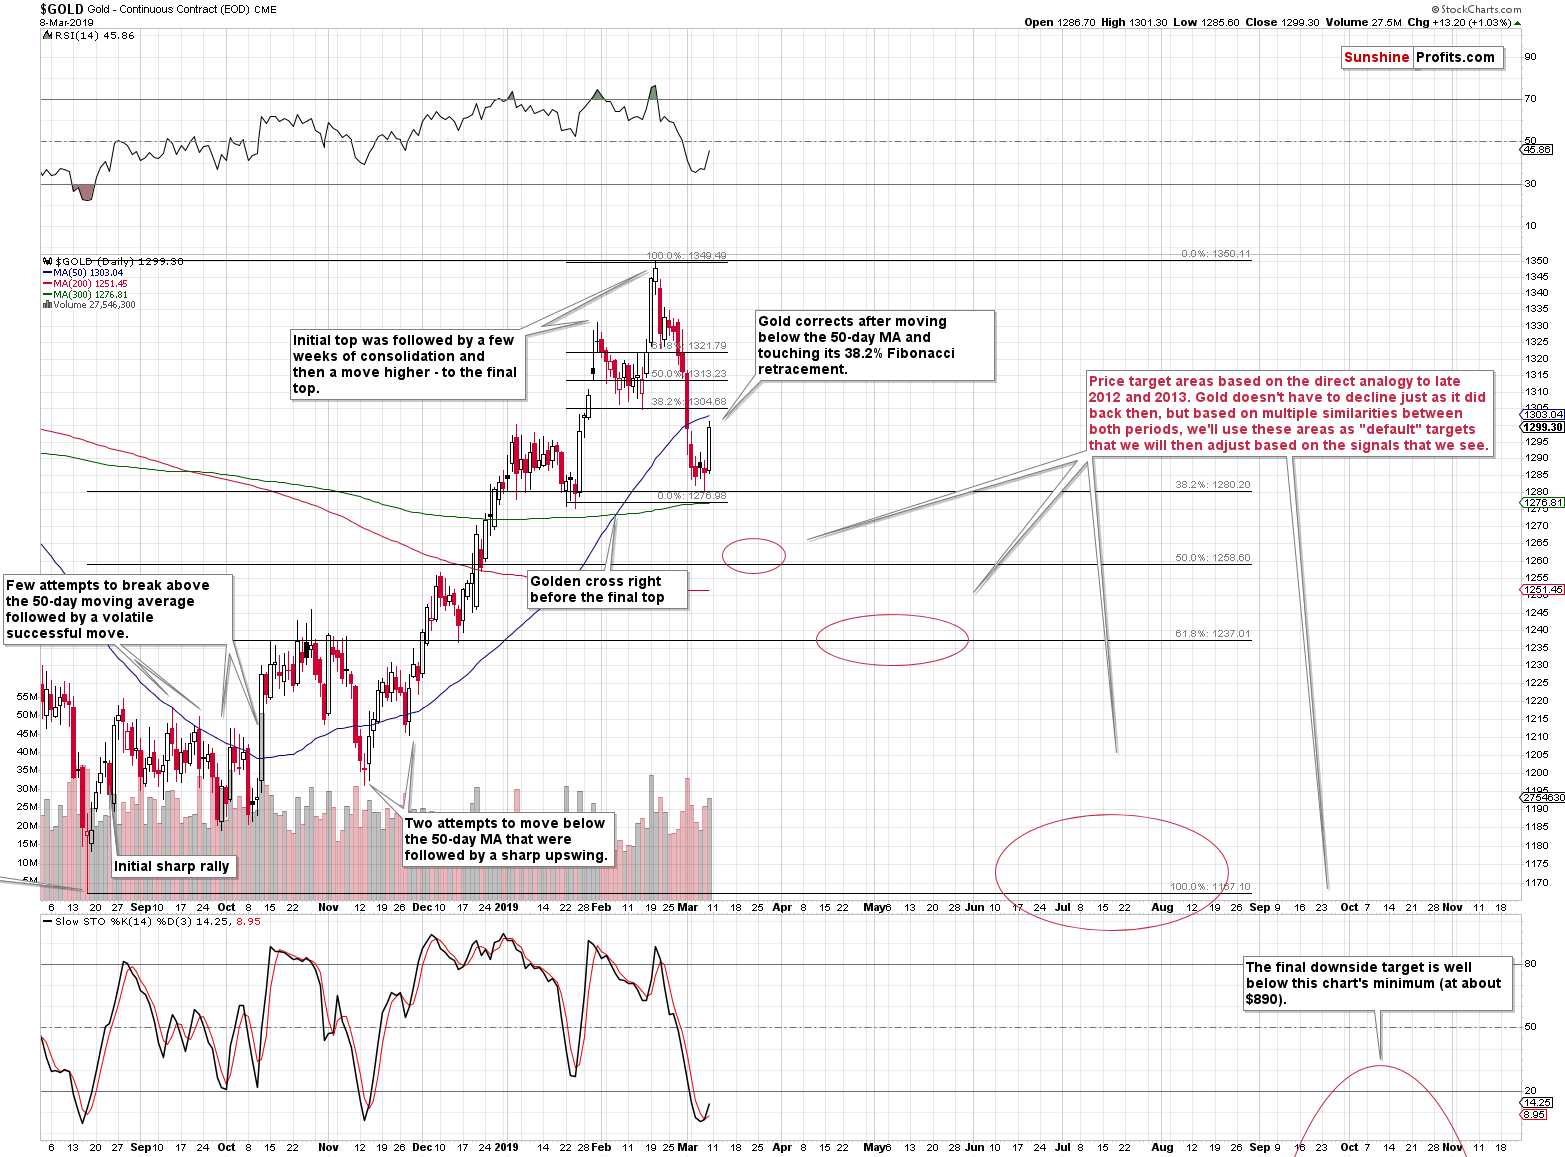
In both cases, gold then declined below its 50-day moving average and that’s when we saw the first notable correction. Gold corrected after moving approximately (!) to the 38.2% Fibonacci retracement based on the previous rally and to the Fibonacci price extension based on the recent top and the preceding low. In 2012, gold moved to the price extension and almost to the retracement, and this time, it moved right to the retracement and almost to the price extension.
The correction that followed in 2012 wasn’t particularly significant as gold didn’t manage to move back above the 50-day moving average and it didn’t move back above the previous short-term lows. That’s more or less where gold is right now. It moved toward the 50-day moving average and the previous lows, but it didn’t reach them.
Based on the above-mentioned analogy alone, it seems that gold is unlikely to move much higher. Instead it’s likely to decline once again – to the previous high – before correcting and moving higher in a more meaningful way. At this time, the short-term target is even clearer because the previous (early December 2018) high corresponds to the 50% Fibonacci retracement based on the previous upswing. There’s one more interesting thing – in 2012, gold declined below the initial low by approximately as much as it had first corrected. Assuming that gold is going to decline shortly and doesn’t move above $1,300 (or the move is just a few dollars at most), this will perfectly fit the 50% Fibonacci retracement as the next downside target.
We might even temporarily go long gold if it moves to this level (about $1,260), provided that we see enough bullish confirmations from other markets.
Still, there is also the possibility that the history will not repeat itself to the letter and that gold will move above the 50-day moving average right away – just like it did in late November 2012. If this is the case, then we will likely not have any meaningful comeback once gold moves close to $1,260, as the above would imply that the bigger corrective upswing in gold had already taken place.
For now, the former scenario is more probable, but we are keeping our eyes open for signs that would confirm the latter.
Either way, the next support levels would be provided by approximately the $1,237 level (the 61.8% Fibonacci retracement based on the previous rally) and the 2018 lows (approximately $1,160). Gold could correct after reaching these levels and none of such short-term upswings should be interpreted as the end of the big decline. Back in 2012 and 2013, the analogous moves were just the local ones that preceded the true plunge.
Does this mean that gold definitely has to rebound from the above-mentioned price levels? No, the situation in the USD Index is different today and thus gold might react in a different manner, for instance by declining much earlier and in a more volatile manner. However, the above gives us a great default indication regarding the likely next gold price moves. Instead of determining the prices moves from scratch, we can use these default targets and adjust them upward or downward based on what kind of signals and confirmations we get along the way.
As always, we’ll keep you – our subscribers – informed.
Summary
Summing up, it’s almost certain that the next big move lower has already begun and that the 2013-like slide is in its early stage. Based on the updated version of the 2013-now link, the implications are even more bearish than we had initially assumed. The downside target for gold remains intact ($890), and the corrective upswing that we just saw seems to be rather natural part of the bigger move lower – not a beginning of an important move higher.
As always, we’ll keep you – our subscribers – informed.
To summarize:
Trading capital (supplementary part of the portfolio; our opinion): Full short position (250% of the full position) in gold, silver, and mining stocks is justified from the risk/reward perspective with the following stop-loss orders and exit profit-take price levels:
- Gold: profit-take exit price: $1,062; stop-loss: $1,357; initial target price for the DGLD ETN: $82.96; stop-loss for the DGLD ETN $39.87
- Silver: profit-take exit price: $12.32; stop-loss: $16.44; initial target price for the DSLV ETN: $47.67; stop-loss for the DSLV ETN $23.68
- Mining stocks (price levels for the GDX ETF): profit-take exit price: $13.12; stop-loss: $24.17; initial target price for the DUST ETF: $76.87; stop-loss for the DUST ETF $15.47
Note: the above is a specific preparation for a possible sudden price drop, it does not reflect the most likely outcome. You will find a more detailed explanation in our August 1st Alert. In case one wants to bet on junior mining stocks’ prices (we do not suggest doing so – we think senior mining stocks are more predictable in the case of short-term trades – if one wants to do it anyway, we provide the details), here are the stop-loss details and target prices:
- GDXJ ETF: profit-take exit price: $17.52; stop-loss: $35.67
- JDST ETF: initial target price: $143.87 stop-loss: $30.97
Long-term capital (core part of the portfolio; our opinion): No positions (in other words: cash)
Insurance capital (core part of the portfolio; our opinion): Full position
Important Details for New Subscribers
Whether you already subscribed or not, we encourage you to find out how to make the most of our alerts and read our replies to the most common alert-and-gold-trading-related-questions.
Please note that the in the trading section we describe the situation for the day that the alert is posted. In other words, it we are writing about a speculative position, it means that it is up-to-date on the day it was posted. We are also featuring the initial target prices, so that you can decide whether keeping a position on a given day is something that is in tune with your approach (some moves are too small for medium-term traders and some might appear too big for day-traders).
Plus, you might want to read why our stop-loss orders are usually relatively far from the current price.
Please note that a full position doesn’t mean using all of the capital for a given trade. You will find details on our thoughts on gold portfolio structuring in the Key Insights section on our website.
As a reminder – “initial target price” means exactly that – an “initial” one, it’s not a price level at which we suggest closing positions. If this becomes the case (like it did in the previous trade) we will refer to these levels as levels of exit orders (exactly as we’ve done previously). Stop-loss levels, however, are naturally not “initial”, but something that, in our opinion, might be entered as an order.
Since it is impossible to synchronize target prices and stop-loss levels for all the ETFs and ETNs with the main markets that we provide these levels for (gold, silver and mining stocks – the GDX ETF), the stop-loss levels and target prices for other ETNs and ETF (among other: UGLD, DGLD, USLV, DSLV, NUGT, DUST, JNUG, JDST) are provided as supplementary, and not as “final”. This means that if a stop-loss or a target level is reached for any of the “additional instruments” (DGLD for instance), but not for the “main instrument” (gold in this case), we will view positions in both gold and DGLD as still open and the stop-loss for DGLD would have to be moved lower. On the other hand, if gold moves to a stop-loss level but DGLD doesn’t, then we will view both positions (in gold and DGLD) as closed. In other words, since it’s not possible to be 100% certain that each related instrument moves to a given level when the underlying instrument does, we can’t provide levels that would be binding. The levels that we do provide are our best estimate of the levels that will correspond to the levels in the underlying assets, but it will be the underlying assets that one will need to focus on regarding the signs pointing to closing a given position or keeping it open. We might adjust the levels in the “additional instruments” without adjusting the levels in the “main instruments”, which will simply mean that we have improved our estimation of these levels, not that we changed our outlook on the markets. We are already working on a tool that would update these levels on a daily basis for the most popular ETFs, ETNs and individual mining stocks.
Our preferred ways to invest in and to trade gold along with the reasoning can be found in the how to buy gold section. Additionally, our preferred ETFs and ETNs can be found in our Gold & Silver ETF Ranking.
As a reminder, Gold & Silver Trading Alerts are posted before or on each trading day (we usually post them before the opening bell, but we don't promise doing that each day). If there's anything urgent, we will send you an additional small alert before posting the main one.
=====
Latest Free Trading Alerts:
Stocks extended their short-term downtrend on Friday before bouncing off and closing slightly lower. Investors continued to take profits of the table following the two-month-long advance. Is this a downward reversal or just a correction before another leg higher?
Short-Term Upward Reversal or Just a Bounce?
=====
Thank you.
Sincerely,
Przemyslaw Radomski, CFA
Editor-in-chief, Gold & Silver Fund Manager

