

Briefly: in our opinion, full (100% of the regular position size) speculative long positions in mining stocks are justified from the risk/reward point of view at the moment of publishing this Alert.
The situation is developing in tune with what I wrote previously, so if you just joined our service (many people have), I suggest that you read the last few analyses, especially Monday’s flagship issue. Today’s analysis is going to be a bit shorter than the previous ones, as there are fewer new technical developments to comment on.
One interesting question that I will reply to in the following part of the analysis is whether the 91.6 target for the USD Index can really correspond to $1,770 in gold, given that the former is so close. But, before that, let’s take a look at the mining stocks.
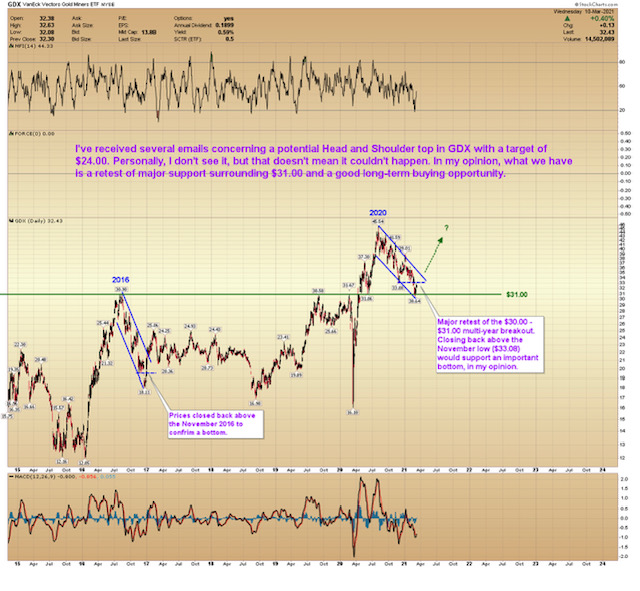
Miners generally paused yesterday (Mar. 10), which is quite natural after a sharp daily rally. They closed the day slightly higher, but the RSI is not yet at 50 and the volume that accompanied yesterday’s small move up was nothing to call home about. It was just a pause, and the preceding short-term move is now likely to continue. In other words, my comments from yesterday on the above chart remain up-to-date:
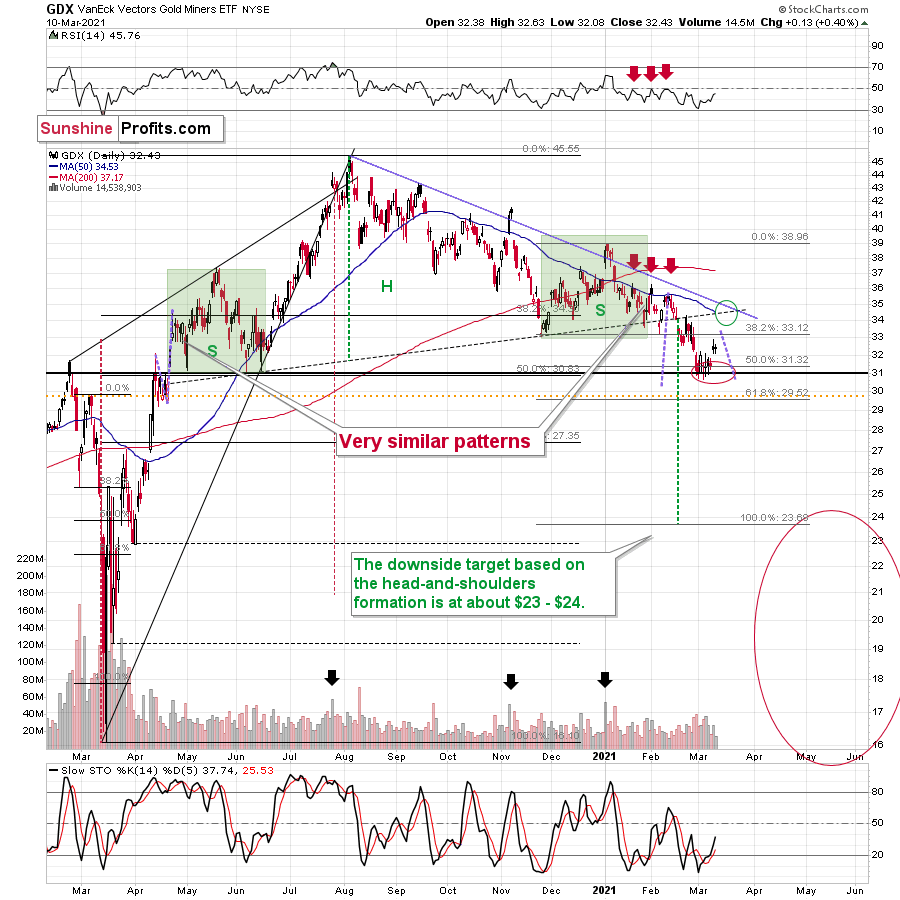
Even though gold moved lower in early March, gold miners stopped declining after reaching my target area based several techniques – most importantly the 50% Fibonacci retracement based on the entire 2020 rally, and the previous lows and highs. Just as miners’ relative weakness had previously heralded declines for the entire precious metals sector, their strength meant that a rally was about to start. And that’s just what we saw yesterday (Mar. 9).
Ultimately, it seems that the above corrections will result in the GDX ETF moving to about $34 or so.
The resistance levels in the $34 - $35 area are provided by:
- The late-February 2020 high
- The rising neck level of the previously completed head and shoulders pattern
- The analogy to how big miners’ correction was in April (assuming that the mirror similarity continues)
- The declining blue resistance line
- The 50-day moving average
Additionally, please note that the last few local tops were accompanied by RSI at about 50. The latter is currently below 45, suggesting that this rally has more potential, but that it’s not particularly extreme.
The confirmation that the top is indeed in might come from the volume. Please note that the last three times when we saw really important tops, the GDX rallied on particularly strong volume. If we see something like that within the next 5 trading days or so (quite likely on Monday or close to it), we’ll have an even bigger chance of catching the reversal.
Consequently, the GDX is likely to form a top in the above-described area, and my previous comments on the likely follow-up remain up-to-date:
After breaking below the head-and-shoulders pattern, gold miners would then be likely to verify this breakdown by moving back up to the neck level of the pattern. Then, we would likely see another powerful slide – perhaps to at least $24.
This is especially the case, since silver and mining stocks tend to decline particularly strongly if the stock market is declining as well. And while the exact timing of the market’s slide is not 100% clear, the day of reckoning for stocks is coming, and it might be very, very close.
As I explained previously, based on the similarities to the 1929 and 2008 declines, it could be the case that the precious metals sector declines for about three months after the general stock market tops. And it seems that we won’t have to wait long for the latter. In fact, the next big move lower in stocks might already be underway, as the mid-Feb. 2021 top could have been the final medium-term top.
Having said that, let’s move to gold.
Let’s start with yesterday’s comments:
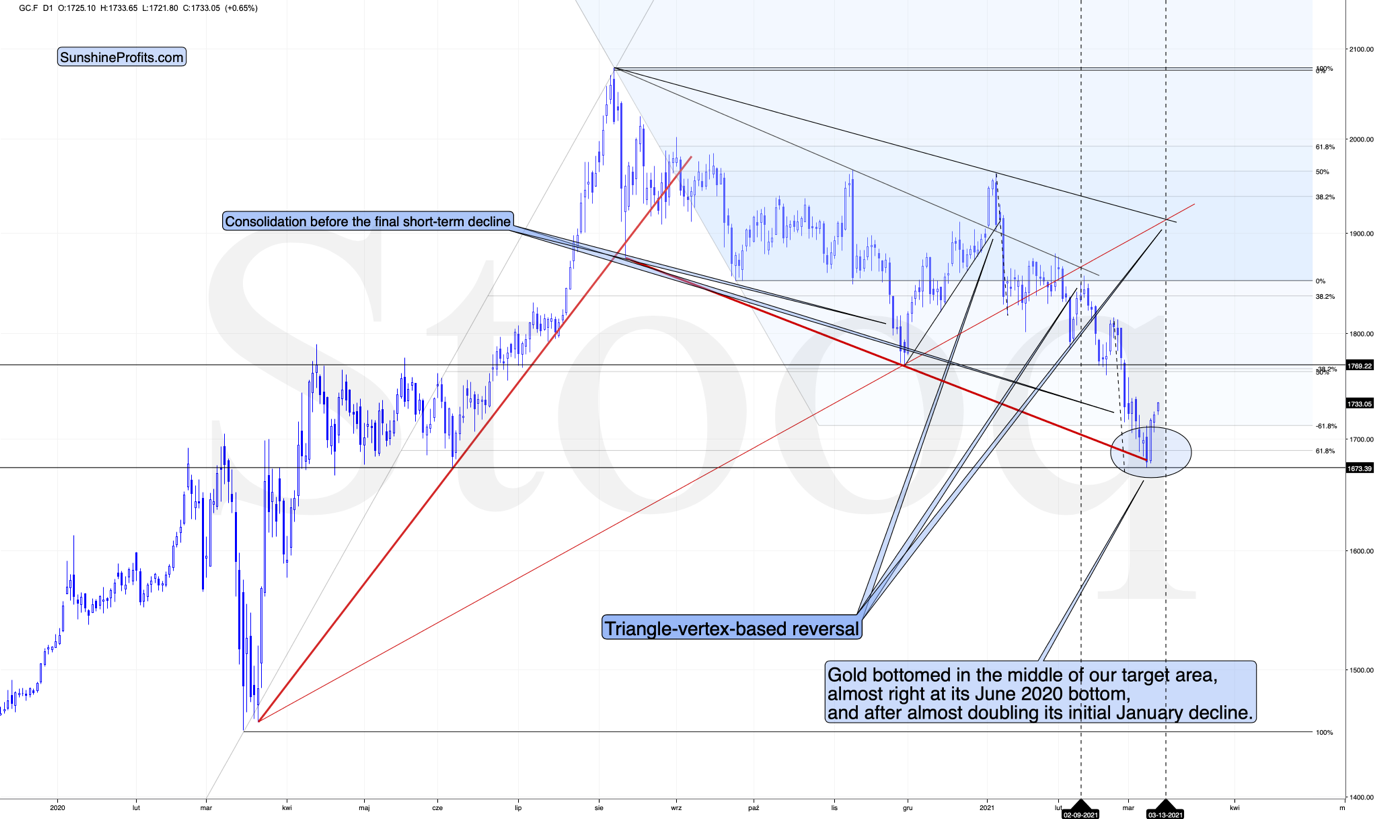
Gold rallied strongly after bottoming right in the middle of my target area and after moving almost right to its June 2020 bottom, and after almost doubling its initial January decline. Yesterday’s rally also meant invalidation of the brief breakdown below the 61.8% Fibonacci retracement level based on the entire 2020 rally. Thus, the very short-term trend is up.
Please keep in mind that the upswing might be relatively short-lived – perhaps lasting only one week or so. There’s a triangle-vertex-based reversal point on Monday, so it wouldn’t be surprising to see an interim top at that time, especially considering that:
- The triangle-vertex-based turning points have been working particularly well in the recent past – they marked the January and February tops.
- The corrective upswings during this medium-term decline (especially in mining stocks) often took about a week to complete – at least the easy part of the upswing took a week.
The thing that I want to add here – that already takes us to the part where I discuss the gold-USD link – is that gold rallied overnight. It’s currently up by about $10. This doesn’t mean much by itself, but it does mean a lot, when we compare it with the analogous action in the USD Index.
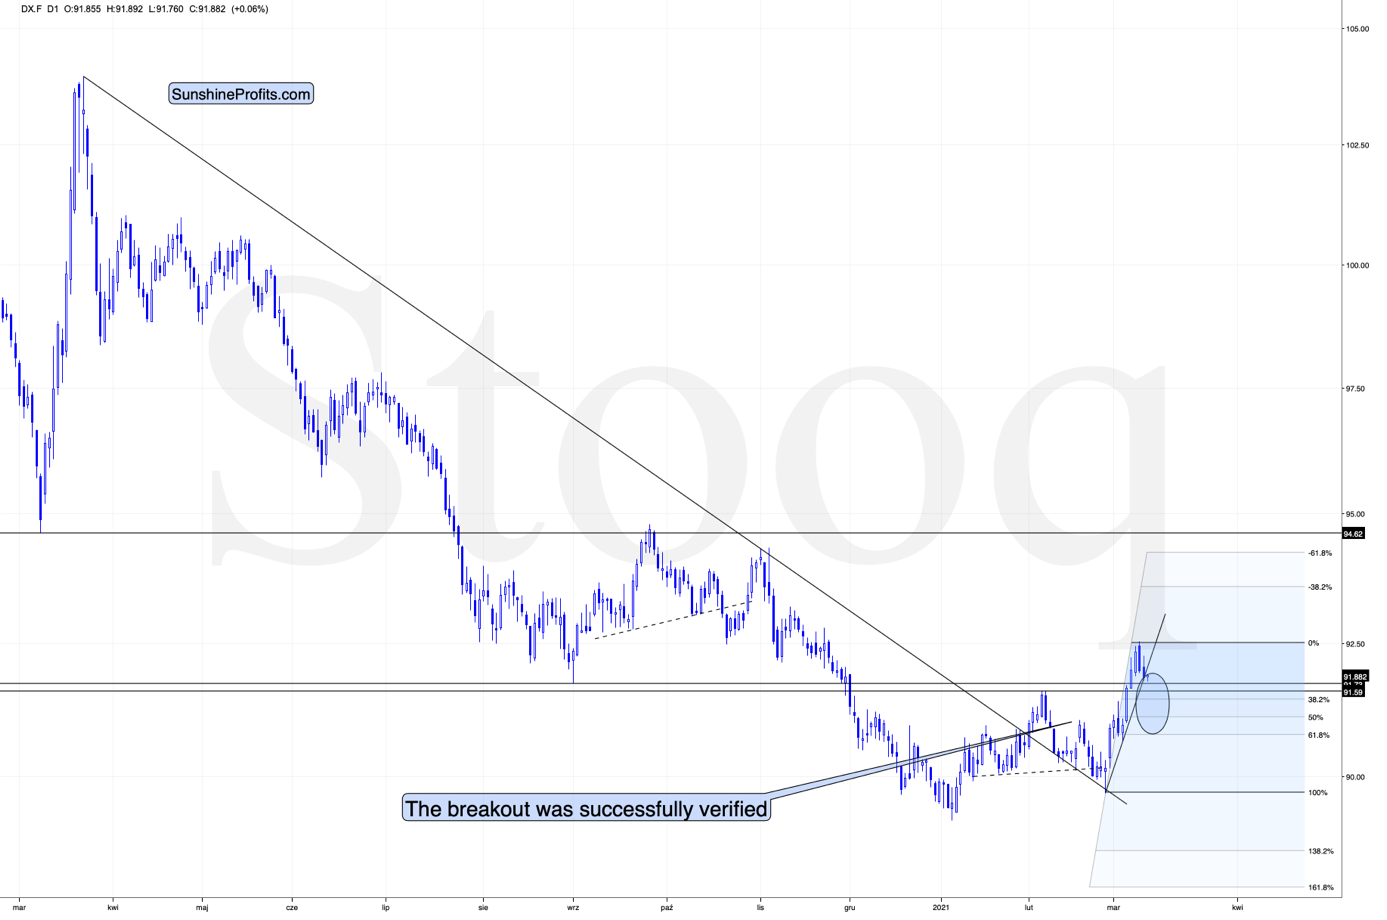
Namely, the USD Index is up by 0.06%. It’s not important that it’s 0.06%, but it’s important that it’s a tiny upswing and not a decline.
In other words, gold just continued to move higher, even though the USD Index paused after a brief decline. This tells us that the shape of both price moves doesn’t have to be identical. Well, to be clear, it was known right from the start, but it’s often the case that the daily price moves in gold and USDX mirror each other.
So, can the bottom in the USD Index form at about 91.6 while gold rallies to ~$1,770. Of course.
One of the ways in which this could be done is for the USD Index to rally a bit here while gold ignores that and rallies anyway – which is what we already see taking place right now – and then when the USD Index declines to 91.6 or so, gold would rally even more. Gold is only $40 away from the above-mentioned upside target, so it won’t take much to get it there. For instance, we might see another $10 rally while the USD Index pauses, and then a $30 rally when the USDX finally declines, and bottoms.
Moreover, please note that the USD Index could move below 91.6 on an intraday basis and then rally back to it in terms of the daily closing prices. The previous 2021 high in terms of the closing prices was 91.52. So, actually, the USDX could decline to one of the Fibonacci retracements on an intraday basis before getting back up. The classic retracements based on the recent move higher are:
- 38.2% - 91.44
- 50% - 91.10
- 61.8% - 90.77
Also, based on the entire 2021 rally, the retracements would be:
- 38.2% - 91.25
- 50% - 90.85
- 61.8% - 90.45
Consequently, the USD Index could decline to one of those levels (more likely to 91.10 – 91.44 than to 90.45 – 90.85) and then rally back up on an intraday basis, and the analogy to how the situation developed in 2018 would still remain intact.
Combining both above details (gold’s temporary outperformance and the possibility for the USD Index to decline below 91.6 on a very temporary basis) suggests that the rally to $1,770 in gold, and the brief decline in the USD Index can indeed take place together.
Let’s take a look at the silver market.
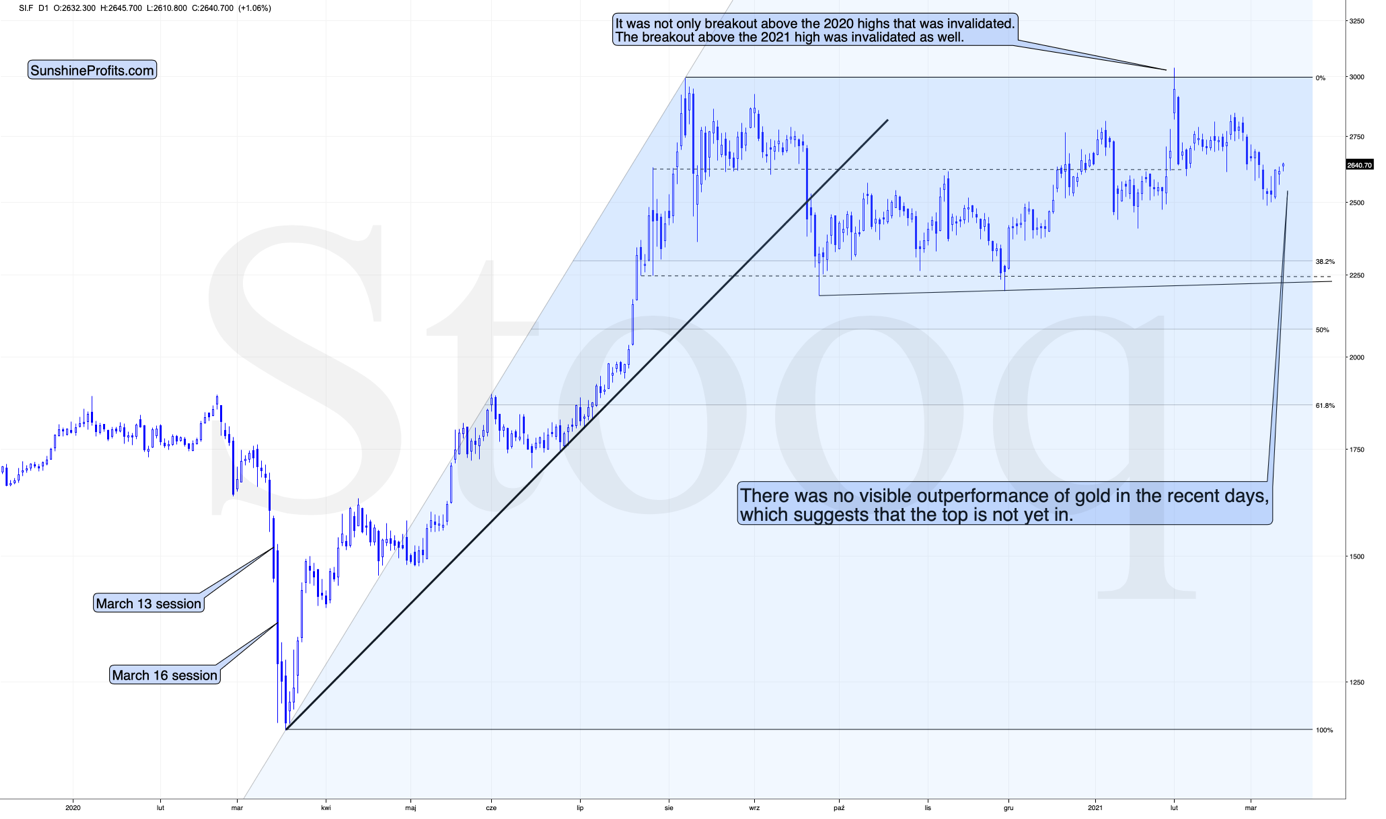
The thing that I want to emphasize here, is that silver’s recent performance was… Average. This is informative, because silver tends to outperform gold in a visible way close to the top. Average performance means no outperformance, which in turn means that the top is likely not yet in.
Having said that, let’s take a look at the market from the more fundamental angle.
Fundamental Frailty
With the USD Index taking a breather, the PMs should continue their short-term shine.
However, with the USD Index poised to soar over the medium-term, the EUR/USD will play a significant role. For context, the EUR/USD accounts for nearly 58% of the movement in the USD Index. As a result, Europe’s fundamental underperformance should help ignite the USD Index’s fire.
On Mar. 9, The Organisation for Economic Co-operation and Development (OECD) released its Interim Economic Outlook. And revealing what I’ve been writing about for over a month, the latest projections are dollar-positive and euro-negative.
Please see below:
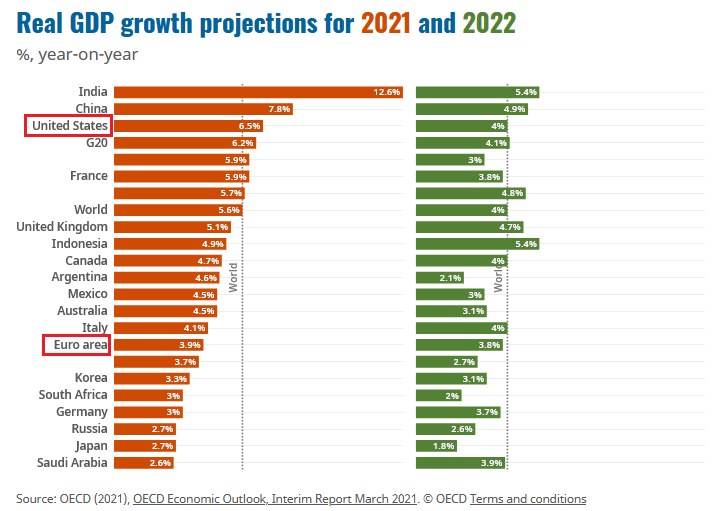
If you analyze the chart above, you can see that the U.S. economy is projected to grow by 6.5% in 2021 and 4.0% in 2022. Conversely, the Eurozone economy is projected to grow by 3.9% in 2021 and 3.8% in 2022.
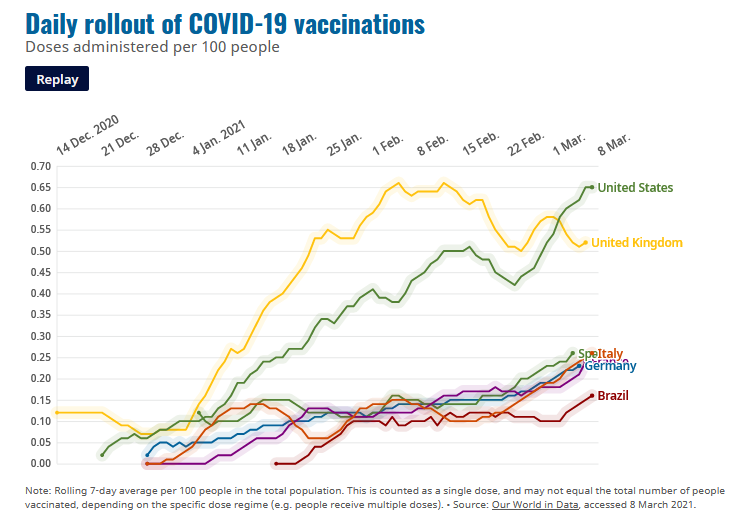
At the core of the expected divergence, daily COVID-19 vaccinations in Germany, France, Italy and Spain – Europe’s four-largest economies – lag the U.S. by a staggering margin.
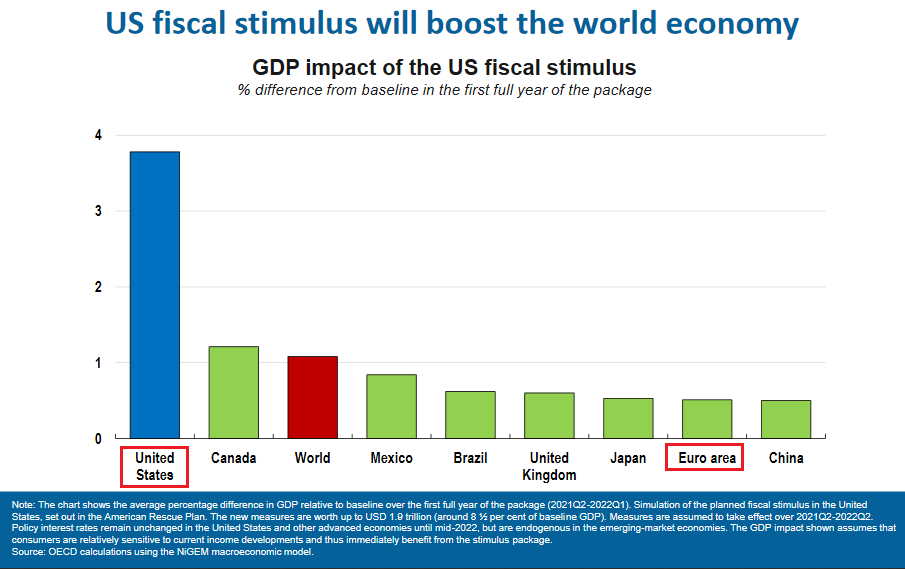
What’s more, Joe Biden’s $1.90 trillion stimulus package is expected to have a profound impact on the U.S. economy. And the Eurozone? Well, not so much.
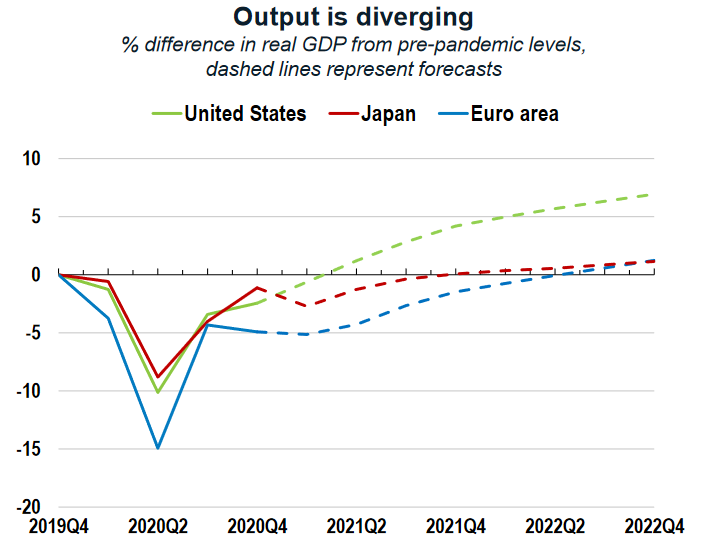
Furthermore, pandemic-induced scarring is expected to burden the Eurozone economy for some time. If you analyze the chart below, you can see that OECD analysts have reduced their Eurozone Q4:2021 GDP forecast by 4.0%. In stark contrast, the group has actually increased its U.S. Q4:2021 GDP forecast.
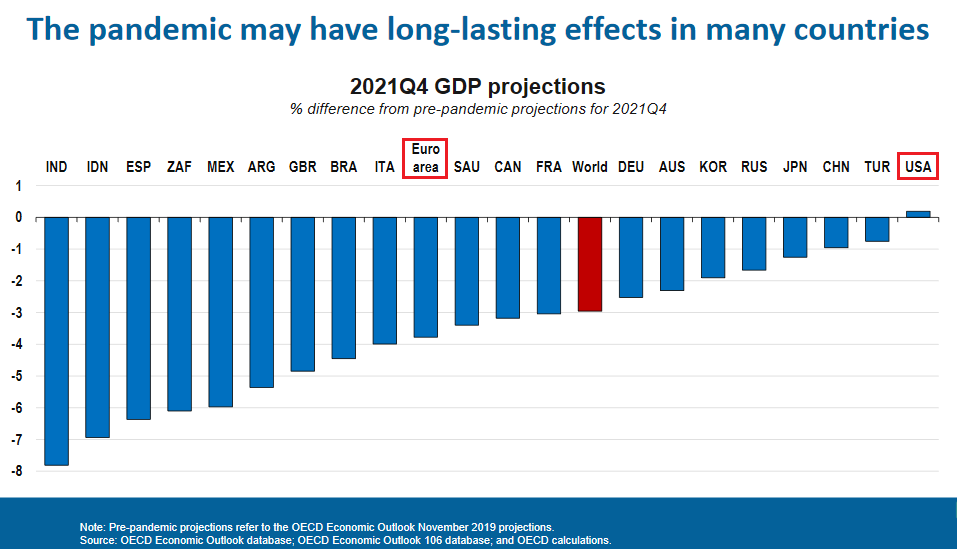
But because seeing is believing, notice how Eurozone economic activity does, and is expected to, lag the U.S. by a wide margin?
 Source: OECD
To explain, the solid (and dotted) green line above depicts the performance of U.S. real GDP, while the sold (and dotted) blue line above depicts the performance of Eurozone real GDP. Representing historical data, if you focus on the two solid lines, you can see that the U.S. recovery is tracking well-ahead of the Eurozone. And because the dotted sections track OECD analysts’ projections, you can also see that the U.S. is expected to recoup its pre-pandemic GDP growth by roughly the second-quarter of 2021. Conversely, the Eurozone isn’t expected to recoup its pre-pandemic GDP growth until the second-quarter of 2022.
To that point, data compiled by Bloomberg is just as pessimistic.
Please see below:
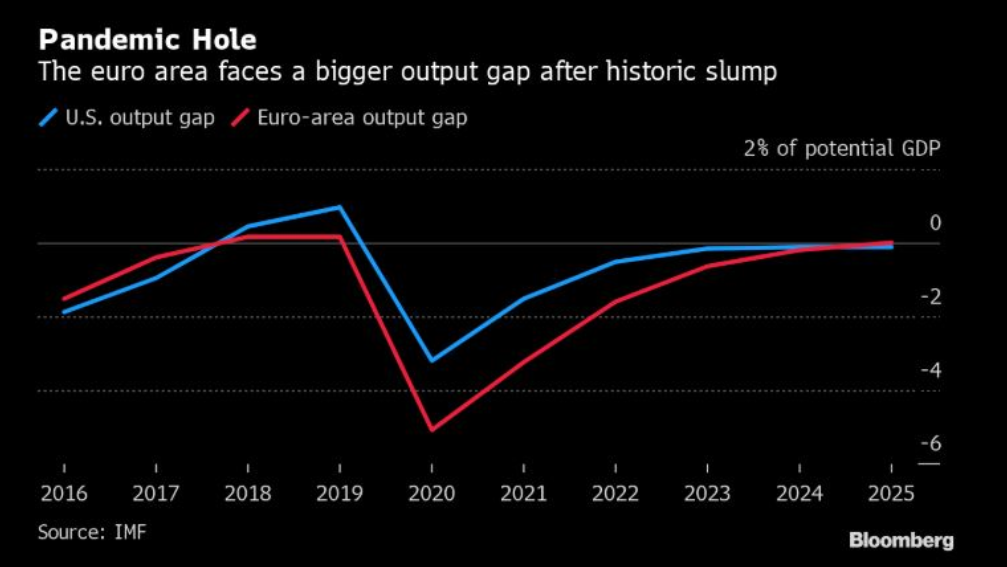
To explain, an output gap is the difference between a region’s actual and its potential GDP. With the blue line above representing the U.S. and the red line above representing the Eurozone, you can see that the U.S. is expected to close its output gap by 2023. But lagging behind, the Eurozone isn’t expected to close its output gap until 2024.
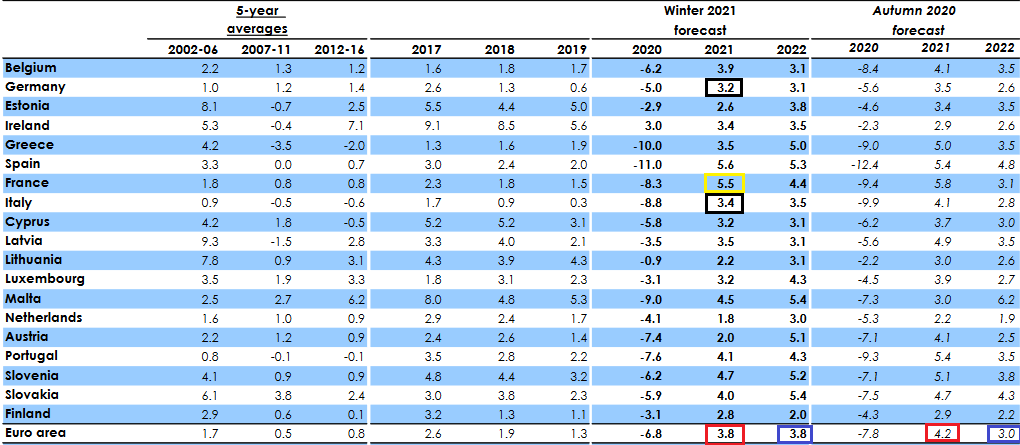
On a more granular level, The European Commission’s Winter 2021 Economic Forecast (released on Feb. 11) predicted that Eurozone GDP growth (3.8%) would be headlined by France’s outperformance in 2021.
On Feb. 17, I wrote:
The report forecasts that France (the yellow box below) – Europe’s second-largest economy – will deliver 5.5% GDP growth in 2021.
 Source: European Commission Winter 2021 Economic Forecast
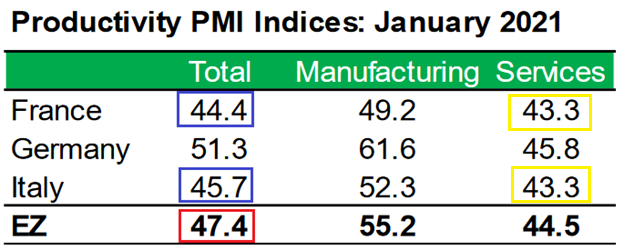
With ambitious being an understatement, it was less than two weeks ago (Feb. 4) that IHS Markit’s Eurozone Productivity PMI fell for a third-straight month (to 47.4 in January) and declined at its fastest pace since June. More importantly though, the report cited France and Italy’s service sectors as the main weak spots (the yellow boxes below).
 Source: IHS Markit
Also contradicting the projection, IHS Markit’s Eurozone Construction PMI report (released on the same day) read that “France posted the steepest rate of contraction.” With that in mind, does it seem likely that France will outperform 18 of 19 European countries in 2021?
And with the latest data not instilling any more confidence, February’s IHS Markit’s Eurozone Composite PMI (released on Mar. 3), revealed that “overall declines were recorded … with Ireland again recording the sharpest contraction, followed by Spain and then France.”
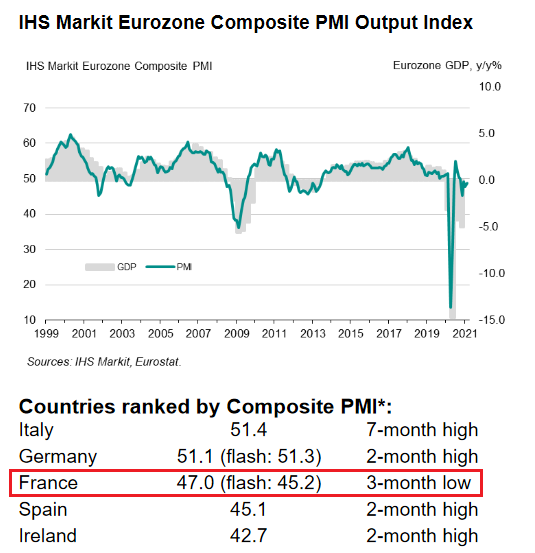
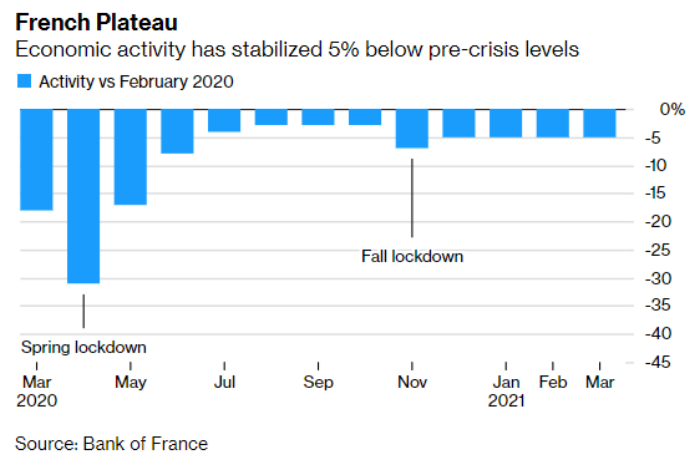
If that wasn’t enough, data from the Bank of France confirms that the French economy has plateaued – at 5% below pre-pandemic levels – since November.
Please see below:
Also raising alarm bells, I warned on Feb. 19 that the European banking sector remains on high alert.
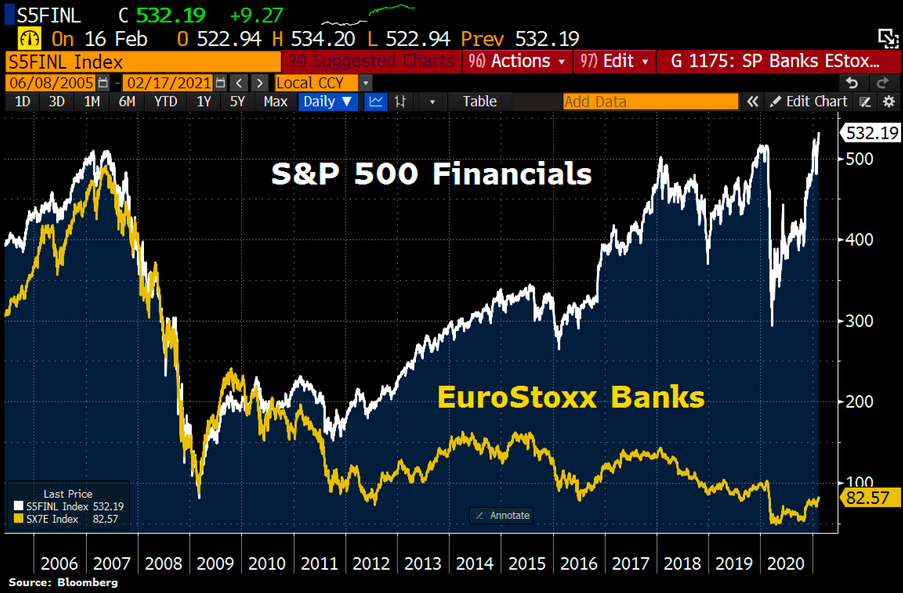
If you analyze the chart above, you can see that S&P 500 banks (the white line) have traded sharply higher since September. In stark contrast, European banks (the yellow line) have struggled to keep pace.
And able to see the forest through the trees, European officials warned on Feb. 15 that the Eurozone could be on the verge of “wide-scale corporate distress.” In a document presented to European finance ministers, officials highlighted that 25% of European businesses were in financial trouble prior to the New Year. And with the “underlying deterioration” masked by government assistance, banks’ loan loss provisions may have underestimated the potential impact.
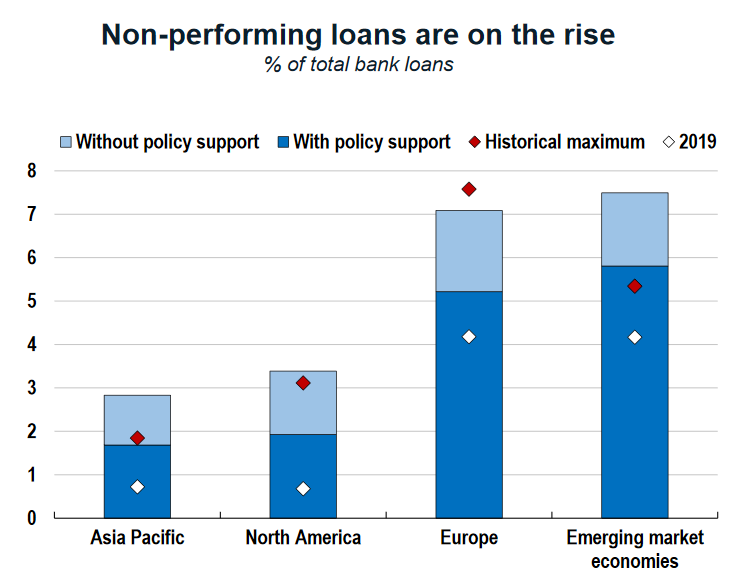
And hitting the nail on the head, the OECD’s report shows that more than 7% of bank loans across Europe are considered nonperforming. For context, a nonperforming loan (NPL) means that a borrower has failed to make interest and/or principal payments over a period of 90 or 180 days (usually). The International Monetary Fund (IMF) also considers a loan nonperforming when it’s been delinquent for less than 90 days, but there is significant uncertainty regarding future payments.
Please see below:
Source: OECD
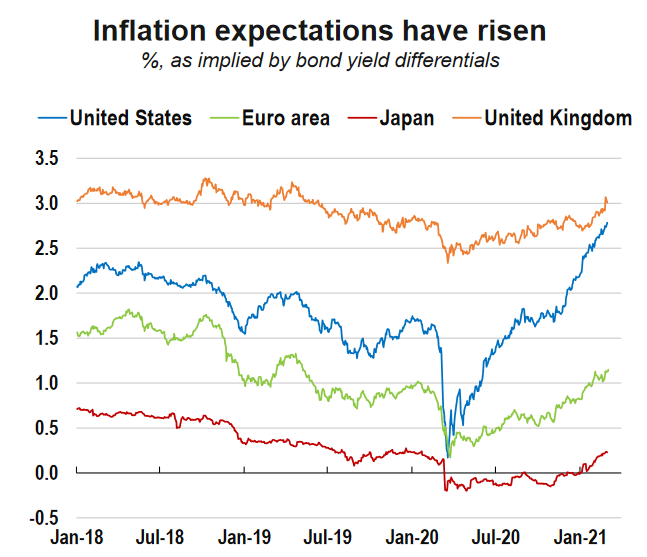
As another negative for the euro, European inflation expectations continue to lag the U.S. Creating a domino effect, I’ve noted on several occasions that higher inflation is a precursor to higher interest rates. And because higher interest rates are a precursor to a stronger currency, U.S. inflation outperformance is bearish for the EUR/USD.
 Source: OECD
To explain, the green line above tracks inflation expectations in the Eurozone, while the blue line above tracks inflation expectations in the U.S. As you can see, the blue line has moved sharply higher, while the green line has delivered a modest uptick. Thus, rising Eurozone interest rates remain extremely unlikely.
In conclusion, fundamental headwinds continue to shake the EUR/USD. And despite bouncing over the last two trading days (after declining for six of the previous seven), the fundamental divergence should catch up to the currency pair over the medium-term. Moreover, given its significant influence over the USD Index, a material decline in the EUR/USD should propel the basket back above 94.5. As a result, the PMs strong negative correlation with the USD Index clouds their medium-term outlook. For now, though, we still have time to enjoy the PMs short-term upswing.
Overview of the Upcoming Part of the Decline
- It seems to me that the initial bottom has just formed.
- I expect the rebound to take place during the next 1-3 weeks (in my view the top is most likely to form close to Monday, March 15).
- After the rebound (perhaps to ~$34 in the GDX), I plan to get back in with the short position in the mining stocks.
- Then, after miners slide once again in a meaningful and volatile way, but silver doesn’t (and it just declines moderately), I plan to switch from short positions in miners to short positions in silver (this could take another 1-4 weeks to materialize). I plan to exit those short positions when gold shows substantial strength relative to the USD Index, while the latter is still rallying. This might take place with gold close to $1,450 - $1,500 and the entire decline (from above $1,700 to about $1,475) would be likely to take place within 1-10 weeks and I would expect silver to fall hardest in the final part of the move. This moment (when gold performs very strongly against the rallying USD and miners are strong relative to gold – after gold has already declined substantially) is likely to be the best entry point for long-term investments in my view. This might happen with gold close to $1,475, but it’s too early to say with certainty at this time.
- Consequently, the entire decline could take between 3 and 17 weeks.
- If gold declines even below $1,500 (say, to ~$1350 or so), then it could take another 10 weeks or so for it to bottom, but this is not what I view as a very likely outcome.
- As a confirmation for the above, I will use the (upcoming or perhaps we have already seen it?) top in the general stock market as the starting point for the three-month countdown. The reason is that after the 1929 top, gold miners declined for about three months after the general stock market started to slide. We also saw some confirmations of this theory based on the analogy to 2008. All in all, the precious metals sector would be likely to bottom about three months after the general stock market tops . If the mid-February 2020 top was the final medium-term top, then it seems that we might expect the precious metals sector to bottom in mid-May or close to May’s end.
- The above is based on the information available today and it might change in the following days/weeks.
Letters to the Editor
Q: I am a premium member and I saw the following chart. You should probably send it to PR so he can see it. I have a feeling that it is geared towards him.
A: Thank you. Naturally, technical analysis is subjective in general, and while some analysts might see certain patterns, others might not. You already saw the GDX chart earlier today, so I’ll include the long-term HUI Index chart (another proxy for the mining stocks that’s been around longer than the GDX) below for you to check for yourself if you see the head and shoulders patterns as the starting points of massive declines – or not. I marked them with green rectangles. In each case, the pattern was characterized by higher lows, so the necklines were moving higher.
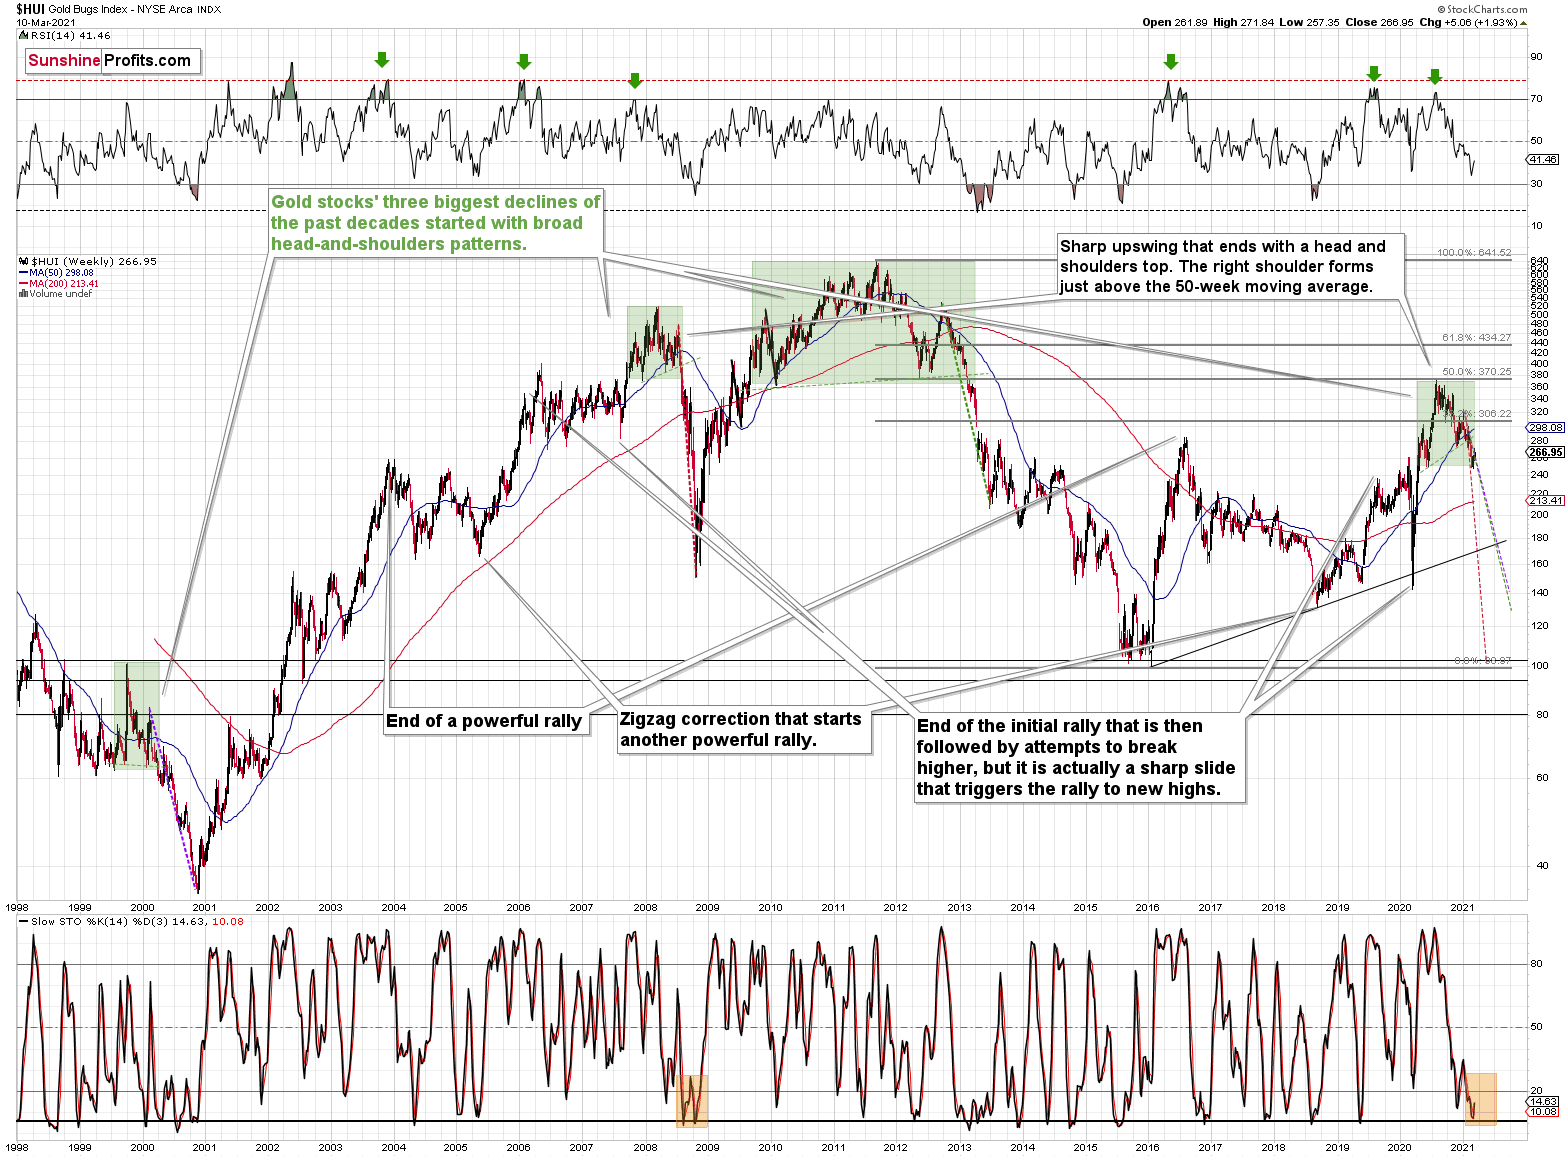
The 1999 – 2000 H&S pattern is not a classic example of the pattern, as the tops are relatively pointy instead of being round, but the 2007 – 2008, 2009 – 2013, and the recent 2020 – 2021 formations are crystal-clear to me. The market seems to agree too, as the most recent performance of gold stocks is very similar to the follow-up of the previous three big H&S patterns. I marked the post-pattern declines with dashed lines of different colors – the HUI Index is moving right between them, which means that it’s already following the analogy to the previous declines.
Q: Trading is hilarious. I have the GDXJ pinned at a resistance of 46.75, with a downside target of $42.5. I’m expecting the selling tonight, but we will see. No capitulation and no catalyst for this to be a bottom. We should know something by USA open.
A: In my opinion the GDXJ will move to 42.5 (and perhaps pause there and then decline further) but not before moving a bit higher first. I don’t think that the final bottom for this medium-term decline was in yet, but I also don’t think that the corrective rally is over.
In case of the GDXJ, the situation is somewhat odd, because this ETF – by itself – didn’t move to an important support level before moving back up. However, it’s so closely tied to the performance of senior miners (GDX) and (to a much smaller extent, but still) the general stock market. Since both moved higher recently (the GDX moved to an important support, after all), GDXJ had little choice but to rally as well.
Q: Your accuracy on the movements in the PM sector is just uncanny. It seems that no one, a week ago, believed that gold could ever again breach $1700. I have a general question. Since your analysis points to gold possibly testing 1350, I would assume that the equity markets are in for a big crash. If gold is down 30% from its 2020 highs, could one assume a 50% correction in the equities markets? Also, could silver retest the lows from March 2020?
A: Thank you for the compliments! Indeed, very few people thought that gold would move below $1,700. Now, very few think that it could (ever) go below $1,500.
Yes, I think that gold might (!) test $1,350, but I view $1,450 and the 2020 bottom as a more likely target.
And yes, I think that equities are in for a big (really big) crash. I think that the equities will move to their 2020 lows and then move below them. Yes, I know that it sounds crazy, in a world when the stock market used to only go up, but… The cycle seems to have changed. We are likely in the very early part of the Kondratiev winter after a very long autumn. We’ll likely see a confirmation (or invalidation) of the above soon.
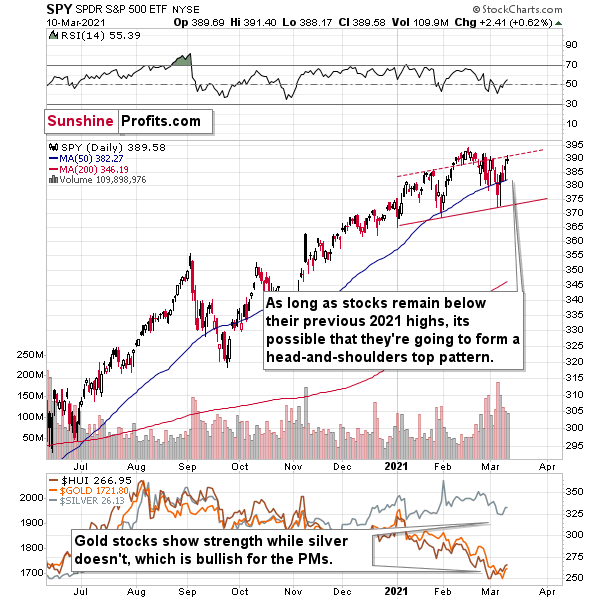
If stocks remain within the head and shoulders pattern and break below its neck level in the upcoming weeks, it will be a very good indication that another huge downswing is already underway. This seems likely in my view, as a rallying USD would be making the U.S. exports less competitive, and I definitely expect to see the former.
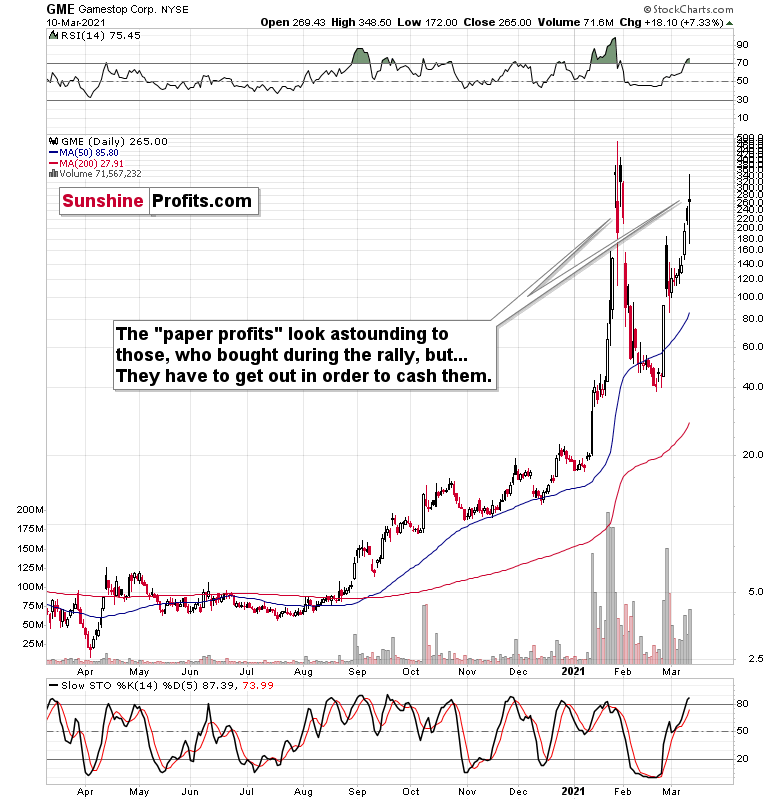
The very strong performance of the Gamestop stock emphasizes the fake nature of the recent upswing in stocks. This company’s fundamentals are not favorable at all and yet people flock to the stock based on its recent popularity. This could be the effect that the recent round of stimulus had (or expectations thereof – people already bought knowing that the checks are coming), and whether this is the case or not, it seems that it is the general investment public that is making these purchases. And this is the group of investors that is entering the market at the end of the bull market.
Regardless, a 50% decline in the market is not out of the question, but I doubt that it would happen quickly, without periodic corrections. And I would like to emphasize that I expect the precious metals sector to decline along with stocks only initially. That was the case in 1929, in 2008 and in 2020 (miners bottomed before the S&P did). Based on the analogy to the past cases (especially the first two), I expect the PMs to bottom about 3 – 3.5 months after the stock market tops. If the top was in the middle of February, then the final bottom in the PMs should form in mid or late May.
And yes, silver could re-test its lows from March 2020. As I emphasized previously, the silver market tends to catch up big-time in the final part of the move. That’s also what it did in March 2020 – miners bottomed when silver was only (approximately) halfway done declining. In fact, the powerful slide in silver is one of the things that I expect to see as a confirmation that the final bottom is in. This time the silver catch-up could be particularly profound due to the big number of individual investors that bought silver when it was popular (see #silversqueeze) in late January and early February. Since those investors likely bought based on short-term emotions and based on only limited research, they are likely to get out of their holdings when prices decline and the emotions toward the PMs get negative, thus adding further fuel to the bearish fire.
Q: Hi Przemyslaw. Once again you are spot on with your Gold and Gold miners daily analysis. Thank you for the follow up from Thursday's 3/4/21 trading alert. On Friday 3/5 I went long on NUGT and GDX. I WAS SO HAPPY WHEN I GOT UP TODAY AND SAW A $5.00 GAIN ON NUGT RIGHT AT THE OPEN. Your exit price targets on gold at $1770, and gold miners at $33.92 to $34.27 are so helpful I can't thank you enough. In addition, your call on the US Dollar dropping is amazing...it did just what you said, topping out near 92.55 and breaking below 92.00 at the close. I'm your biggest admirer; You are unbelievable.
A: Thank you! I’m incredibly flattered by the compliments and even more happy to know that people are profiting from the analyses. A word of caution might be useful here - please remember that I can (and definitely will) be incorrect about the market in the future as it’s impossible to predict it in each and every case. It might be tempting to put a lot of capital in the market after a series of successful trades, but please keep in mind that it’s even more important to be able to continue to trade even after a few bad calls. In other words, it’s critical to keep the position sizes reasonable (you will find more details in the “Position Sizes” part of the Gold & Silver Portfolio Structuring report).
Summary
To summarize, the PMs’ medium-term decline is well underway, as miners broke below the neck level of their almost-yearly head-and-shoulders formation and then continued the decline. However, it now seems that we’re going to see a counter-trend bounce with the GDX ETF moving to about $34 or so, which is why I wrote about opening long positions in the mining stocks.
If your broker allows this, it might be a good idea to have a limit sell order (as a profit-take order) that could be realized also outside of the regular trading hours (in the pre-market / after-market trading). That’s the kind of order that I have placed on my account.
In addition, because we’re likely entering the “winter” part of the Kondratiev cycle (just like in 1929 and then the 1930s), the outlook for the precious metals’ sector remains particularly bearish during the very first part of the cycle, when cash is king.
The confirmed breakout in the USD Index is yet another confirmation of the bearish outlook for the precious metals market.
After the sell-off (that takes gold to about $1,450 - $1,500), we expect the precious metals to rally significantly. The final part of the decline might take as little as 1-5 weeks, so it's important to stay alert to any changes.
Most importantly, please stay healthy and safe. We made a lot of money last March and it seems that we’re about to make much more on this March decline, but you have to be healthy to enjoy the results.
As always, we'll keep you - our subscribers - informed.
By the way, we are opening a possibility to extend one's subscription for a year, two years or even three years with a special 20% discount. This discount can be applied right away, without the need to wait for your next renewal – if you choose to secure your premium access and complete the payment upfront. The boring time in the PMs is definitely over and the time to pay close attention to the market is here. Naturally, it’s your capital, and the choice is up to you, but it seems that it might be a good idea to secure more premium access now, while saving 20% at the same time. Our support team will be happy to assist you in the above-described upgrade at preferential terms – if you’d like to proceed, please contact us..
To summarize:
Trading capital (supplementary part of the portfolio; our opinion): Full speculative long positions (100% of the full position) in mining stocks are justified from the risk to reward point of view with the following binding exit profit-take price levels:
Mining stocks (price levels for the GDX ETF): binding profit-take exit price: $33.92; stop-loss: none (the volatility is too big to justify a stop-loss order in case of this particular trade)
Alternatively, if one seeks leverage, we’re providing the binding profit-take levels for the NUGT (2x leveraged) and GDXU (3x leveraged – which is not suggested for most traders/investors due to the significant leverage). The binding profit-take level for the NUGT: $60.92; stop-loss for the NUGT: none (the volatility is too big to justify a SL order in case of this particular trade); binding profit-take level for the GDXU: $18.92; stop-loss for the GDXU: none (the volatility is too big to justify a SL order in case of this particular trade).
For-your-information targets (our opinion; we continue to think that mining stocks are the preferred way of taking advantage of the upcoming price move, but if for whatever reason one wants / has to use silver or gold for this trade, we are providing the details anyway.):
Silver futures upside profit-take exit price: unclear at this time - initially, it might be a good idea to exit, when gold moves to $1,758.
Gold futures upside profit-take exit price: $1,758.
Long-term capital (core part of the portfolio; our opinion): No positions (in other words: cash
Insurance capital (core part of the portfolio; our opinion): Full position
Whether you already subscribed or not, we encourage you to find out how to make the most of our alerts and read our replies to the most common alert-and-gold-trading-related-questions.
Please note that we describe the situation for the day that the alert is posted in the trading section. In other words, if we are writing about a speculative position, it means that it is up-to-date on the day it was posted. We are also featuring the initial target prices to decide whether keeping a position on a given day is in tune with your approach (some moves are too small for medium-term traders, and some might appear too big for day-traders).
Additionally, you might want to read why our stop-loss orders are usually relatively far from the current price.
Please note that a full position doesn't mean using all of the capital for a given trade. You will find details on our thoughts on gold portfolio structuring in the Key Insights section on our website.
As a reminder - "initial target price" means exactly that - an "initial" one. It's not a price level at which we suggest closing positions. If this becomes the case (like it did in the previous trade), we will refer to these levels as levels of exit orders (exactly as we've done previously). Stop-loss levels, however, are naturally not "initial", but something that, in our opinion, might be entered as an order.
Since it is impossible to synchronize target prices and stop-loss levels for all the ETFs and ETNs with the main markets that we provide these levels for (gold, silver and mining stocks - the GDX ETF), the stop-loss levels and target prices for other ETNs and ETF (among other: UGL, GLL, AGQ, ZSL, NUGT, DUST, JNUG, JDST) are provided as supplementary, and not as "final". This means that if a stop-loss or a target level is reached for any of the "additional instruments" (GLL for instance), but not for the "main instrument" (gold in this case), we will view positions in both gold and GLL as still open and the stop-loss for GLL would have to be moved lower. On the other hand, if gold moves to a stop-loss level but GLL doesn't, then we will view both positions (in gold and GLL) as closed. In other words, since it's not possible to be 100% certain that each related instrument moves to a given level when the underlying instrument does, we can't provide levels that would be binding. The levels that we do provide are our best estimate of the levels that will correspond to the levels in the underlying assets, but it will be the underlying assets that one will need to focus on regarding the signs pointing to closing a given position or keeping it open. We might adjust the levels in the "additional instruments" without adjusting the levels in the "main instruments", which will simply mean that we have improved our estimation of these levels, not that we changed our outlook on the markets. We are already working on a tool that would update these levels daily for the most popular ETFs, ETNs and individual mining stocks.
Our preferred ways to invest in and to trade gold along with the reasoning can be found in the how to buy gold section. Furthermore, our preferred ETFs and ETNs can be found in our Gold & Silver ETF Ranking.
As a reminder, Gold & Silver Trading Alerts are posted before or on each trading day (we usually post them before the opening bell, but we don't promise doing that each day). If there's anything urgent, we will send you an additional small alert before posting the main one.
Thank you.
Przemyslaw Radomski, CFA
Founder, Editor-in-chief

