

Briefly: In our opinion, full (150% of the regular full position) speculative short positions in gold, silver and mining stocks are justified from the risk/reward perspective at the moment of publishing this alert.
At first sight, absolutely nothing happened yesterday in the precious metals market. Gold didn’t do anything, while silver’s and miner’s moves were very tiny. If there was a contest for the most boring sessions of 2017, our bet would be on yesterday’s lack of price action. Yet, after digging through the charts we found a hidden analytical gem that formed yesterday (major signal that we saw for the first time this year). What is it and how can we profit from it?
We can profit by being prepared for a big price swing. Before we unveil the secret, let’s take a look at the regular charts and see what happened – the strength of these signals is not big, but they are still present (chart courtesy of http://stockcharts.com).
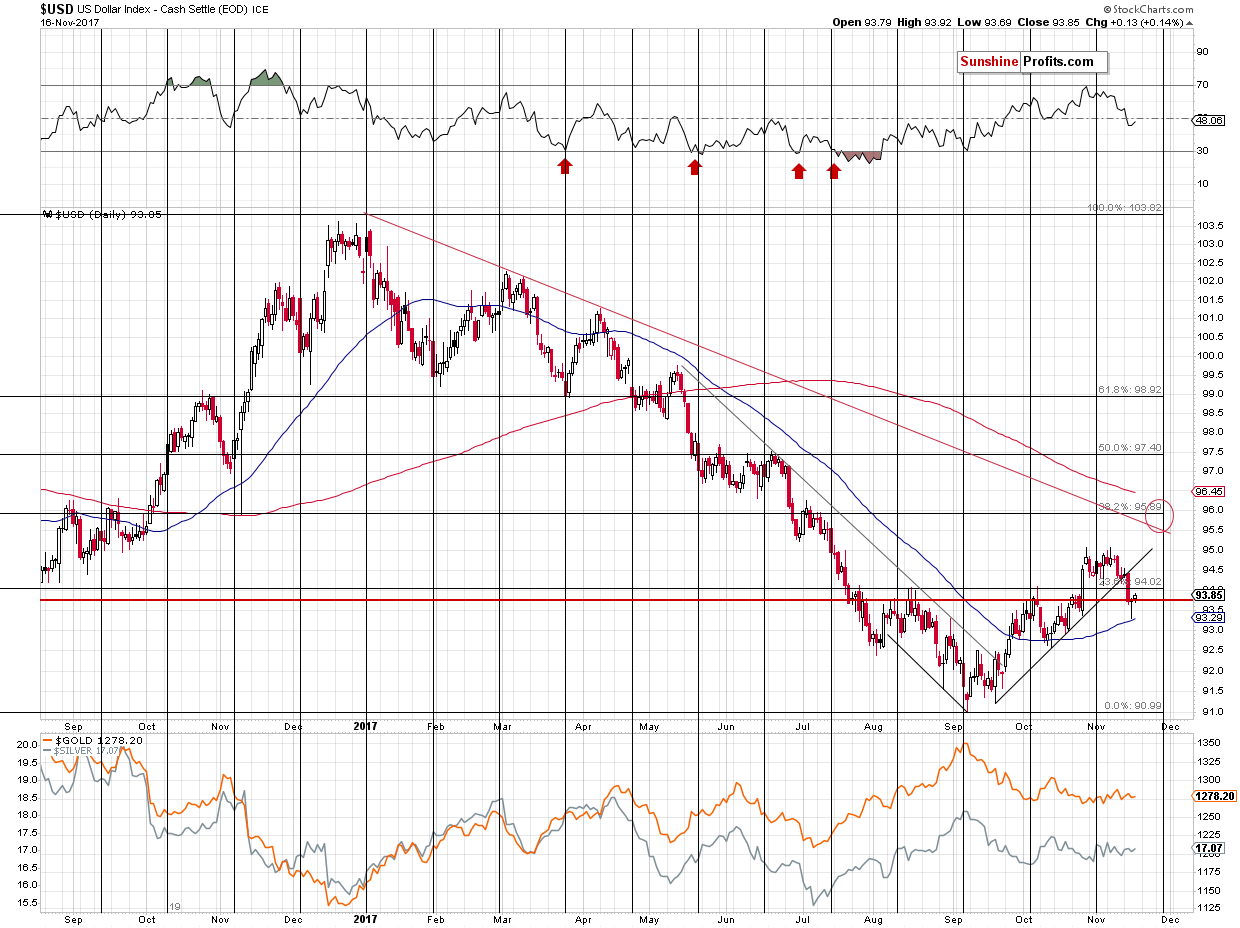
In the case of the USD Index, our previous comments remain up-to-date:
The USD Index finally closed the session below the October and August highs in terms of the intraday prices, however, there was no visible breakdown below the same highs in terms of the daily closing prices.
So, was the breakdown really a game changer? The above and the additional detail seem to invalidate this theory at least at this time. The additional detail is that the current rally (that started in September) has been to some extent a reflection of the previous months of declines. The line that’s analogous to the rising support line that was just broken is the declining line based on August and September lows. The early August low was also visibly below the line and a reflection thereof would be a temporary move below the current support line – that’s what we saw yesterday. The above analogy is not very clear so it’s not very strong, but still, that’s something to keep in mind.
The most important thing about yesterday’s decline in the fact that metals barely reacted to it and miners even managed to close below the previous day’s low. Since the reaction was so small and even negative in the case of miners, should one really be expecting the PMs to soar if the USD declines again? Not really.
But why did the USD Index decline at all? It wasn’t about weakness in the USD per se – it was about the strength in the euro. The Japanese yen has barely moved and at the same time gold’s price in terms of the euro declined sharply.
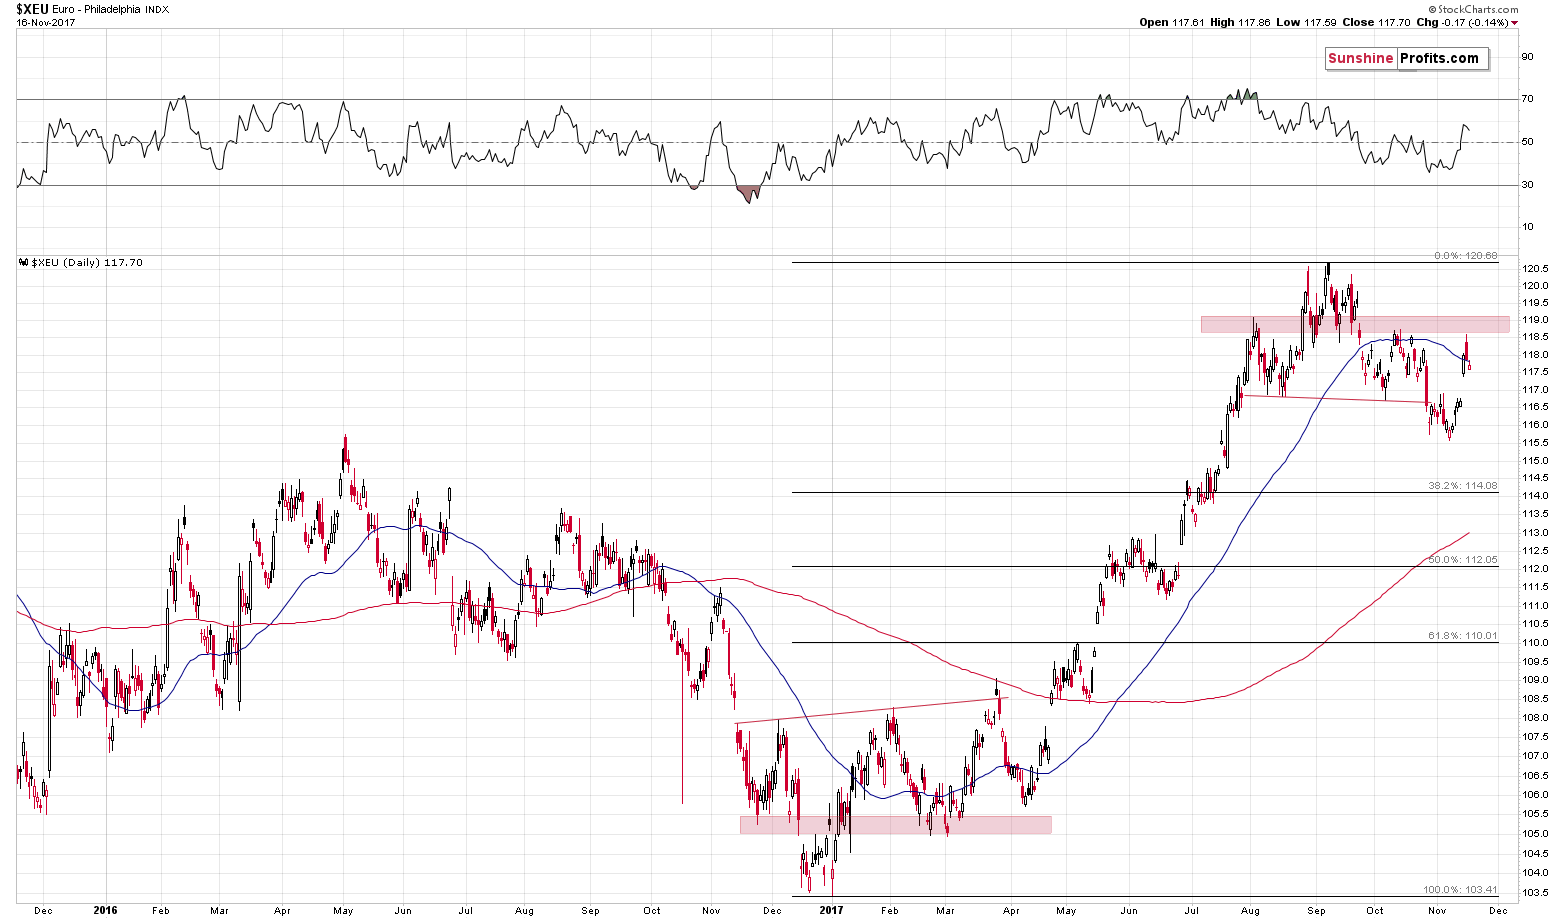
Moreover, we can add that our yesterday “mutant head-and-shoulders pattern” theory is being confirmed so far. The implications continue to be bearish for the euro an gold, while being bullish for the USD Index.
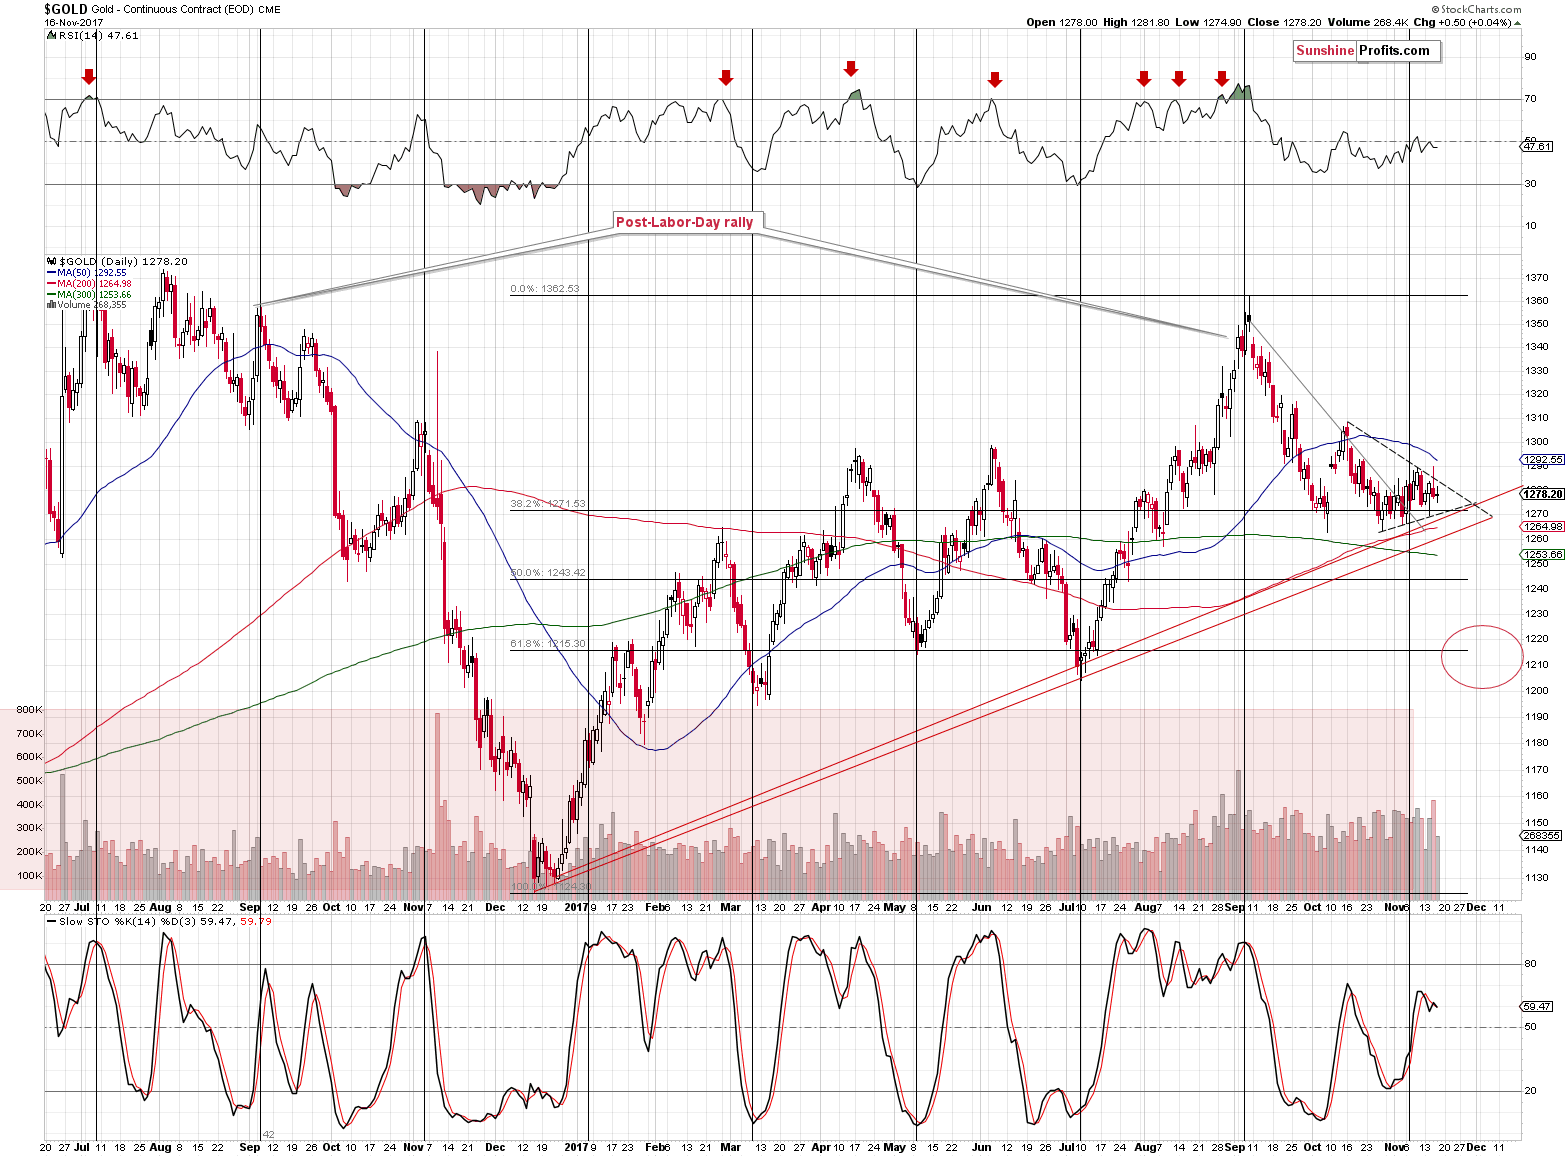
Gold moved higher an “exciting” 50 cents and the volume in gold futures was rather average. Therefore, nothing really changed and what we wrote previously remains up-to-date:
Moving to the regular USD perspective, we just saw a reversal that took place on volume that was the highest in 2 months. The implications are bearish and they are strengthened by the fact that the reversal was at the same time a small breakout above the very short-term resistance line and then an invalidation thereof.
The triangle based on the most recent lows points to a reversal in about 2 weeks and the same goes for silver.
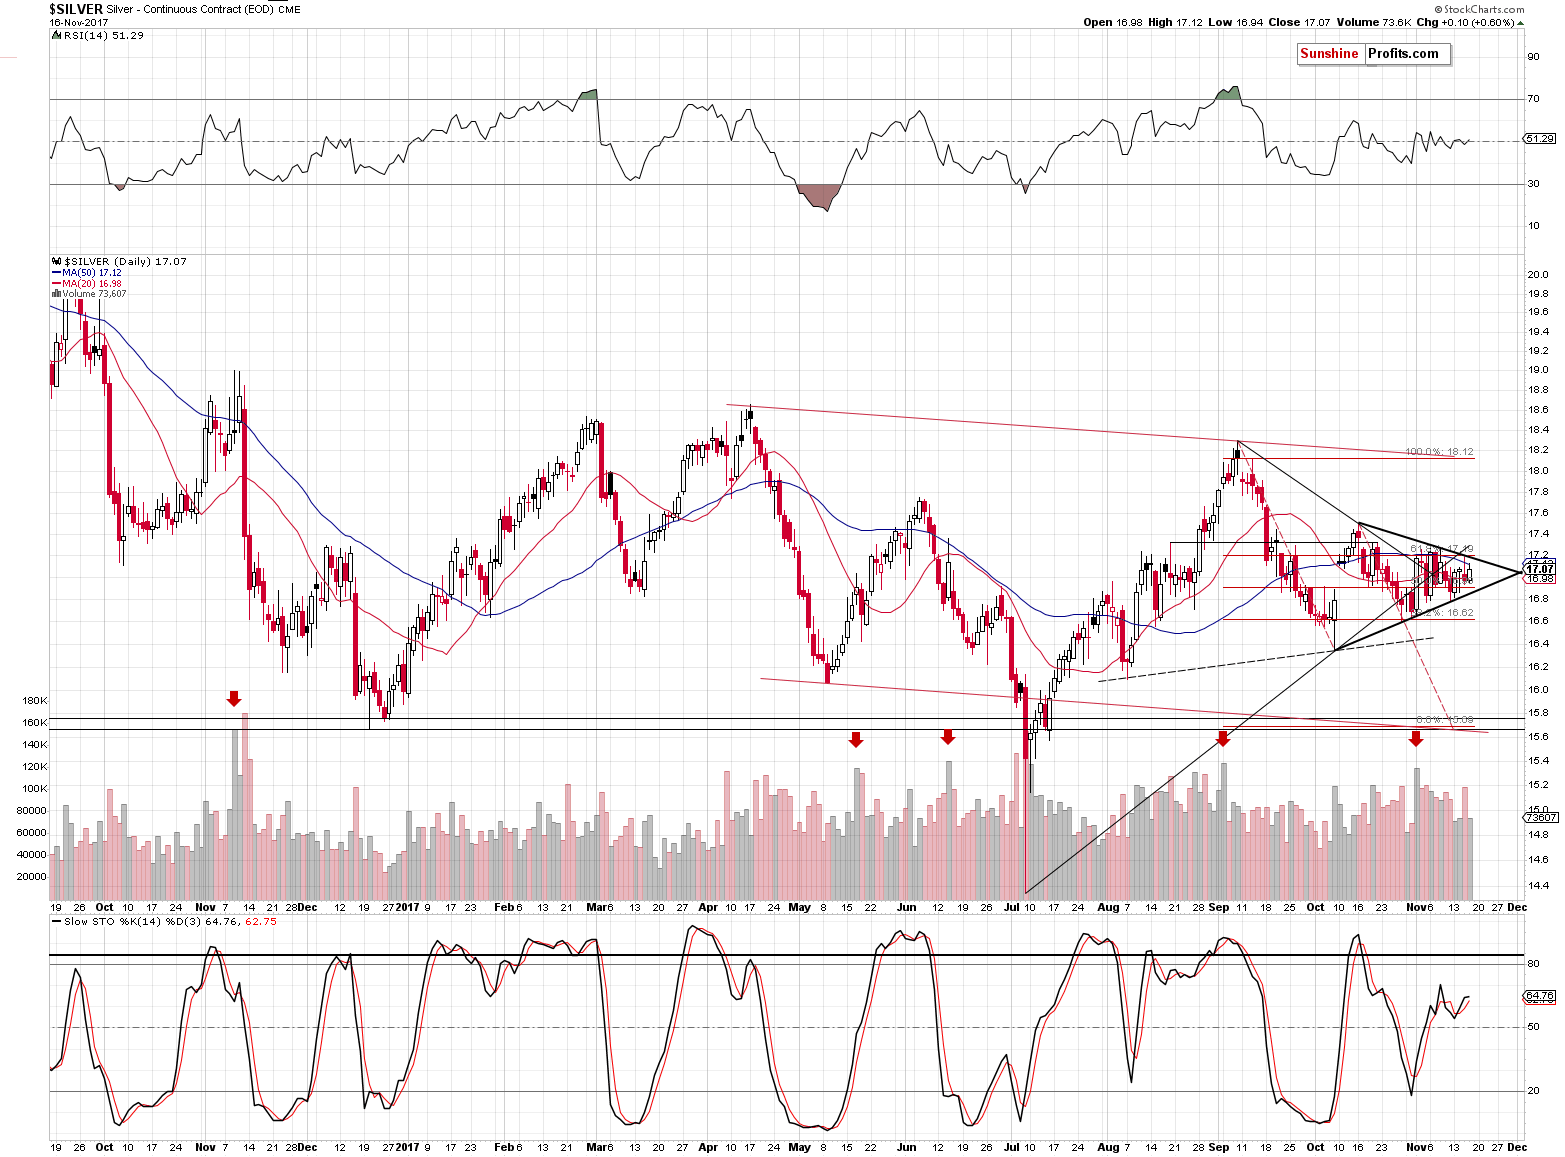
In the case of the white metal, we can see a small ($0.10) upswing, but since silver’s outperformance is not necessarily a bullish factor, especially when combined with mining stocks’ weakness, the above didn’t change the bearish outlook.
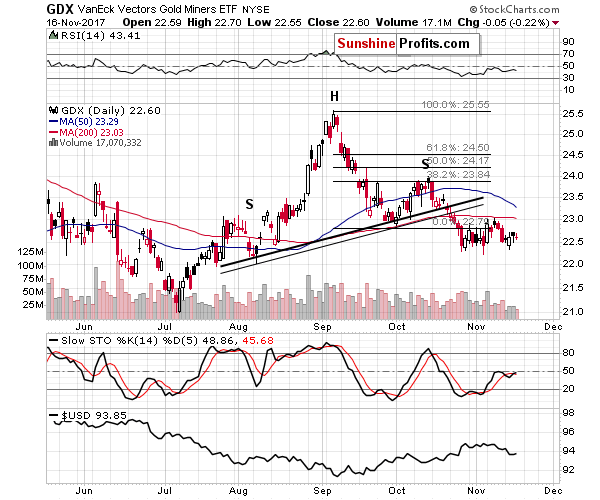
Mining stocks indeed declined – just a little, but the move was still visible and compared to what happened in silver, provides us with bearish implications.
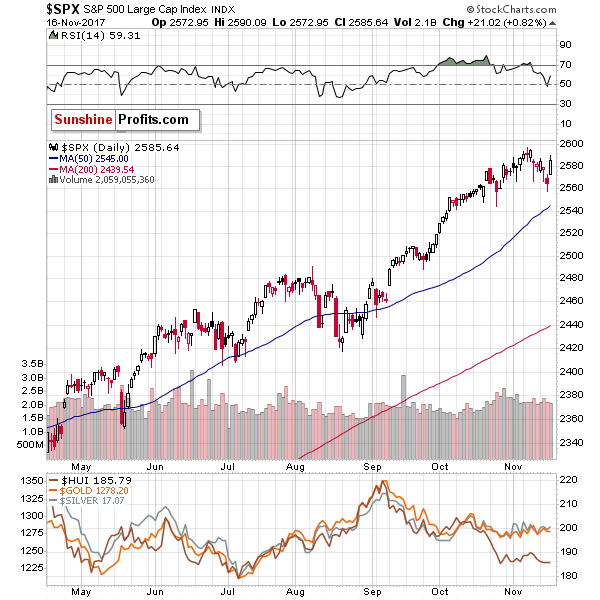
Interestingly, it all happened while the general stock market rallied and both silver and mining stocks had a very good reason to rally. This makes the small decline in mining stocks and their underperformance of gold even more bearish.
Having said the above, let’s move to the main course of today’s analysis… The extremely low volume in the GLD ETF.
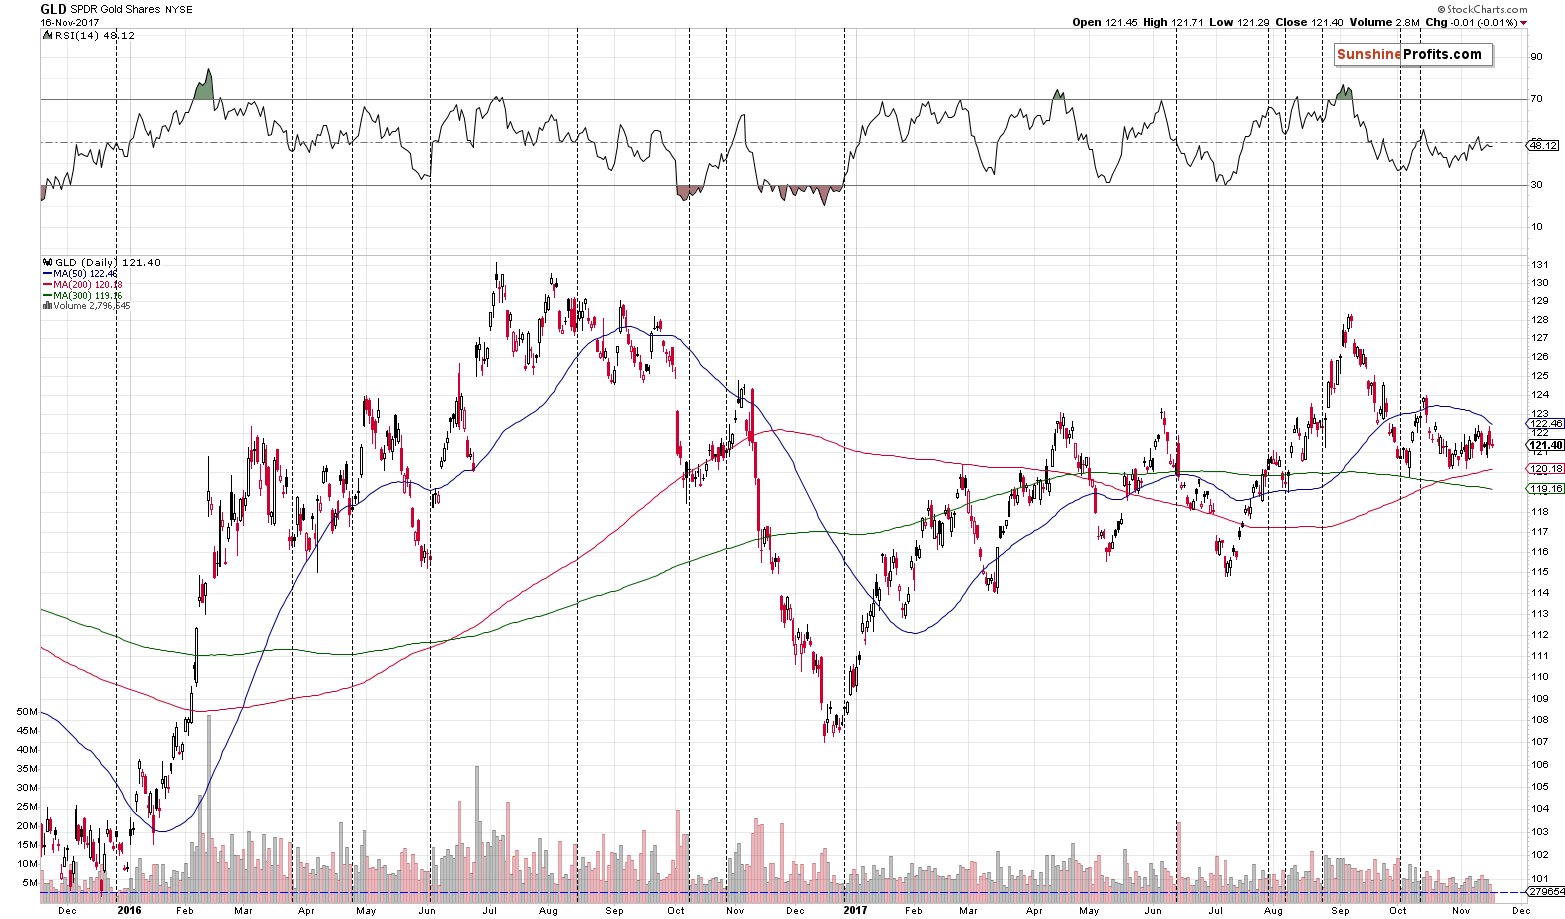
Yesterday’s session was indeed so boring that this lack of action itself was a very important event. The volume hadn’t been this low for more than a year. It was so low that it was difficult to find exactly comparable sessions in the past and we had to analyze the sessions that were only somewhat similar (with very low volume, but not as low as yesterday).
The similar extremely-low-volume sessions had one thing in common – they all represented the calm before the storm. In many cases these sessions were seen right before big, sharp moves (late 2015, early June 2016, mid-June 2017) and at times they were seen at important extremes even though the follow-up action wasn’t sharp (late July 2017, mid-August 2016, late March 2016), but in all cases these were exactly the times when one should be expecting something big instead of being lulled by the lack of volatility.
The above examples show that extremely low volume can trigger moves in both ways, so it’s neither a bullish or bearish factor on its own (it’s a “watch-out!” signal). We could speak of the implications of the reversal, but the last 3 weeks were simply a local horizontal trend, so there’s no directional move to be reversed.
However, we have other techniques to provide us with the direction and the analogy to the previous months and price moves seems to be most important.
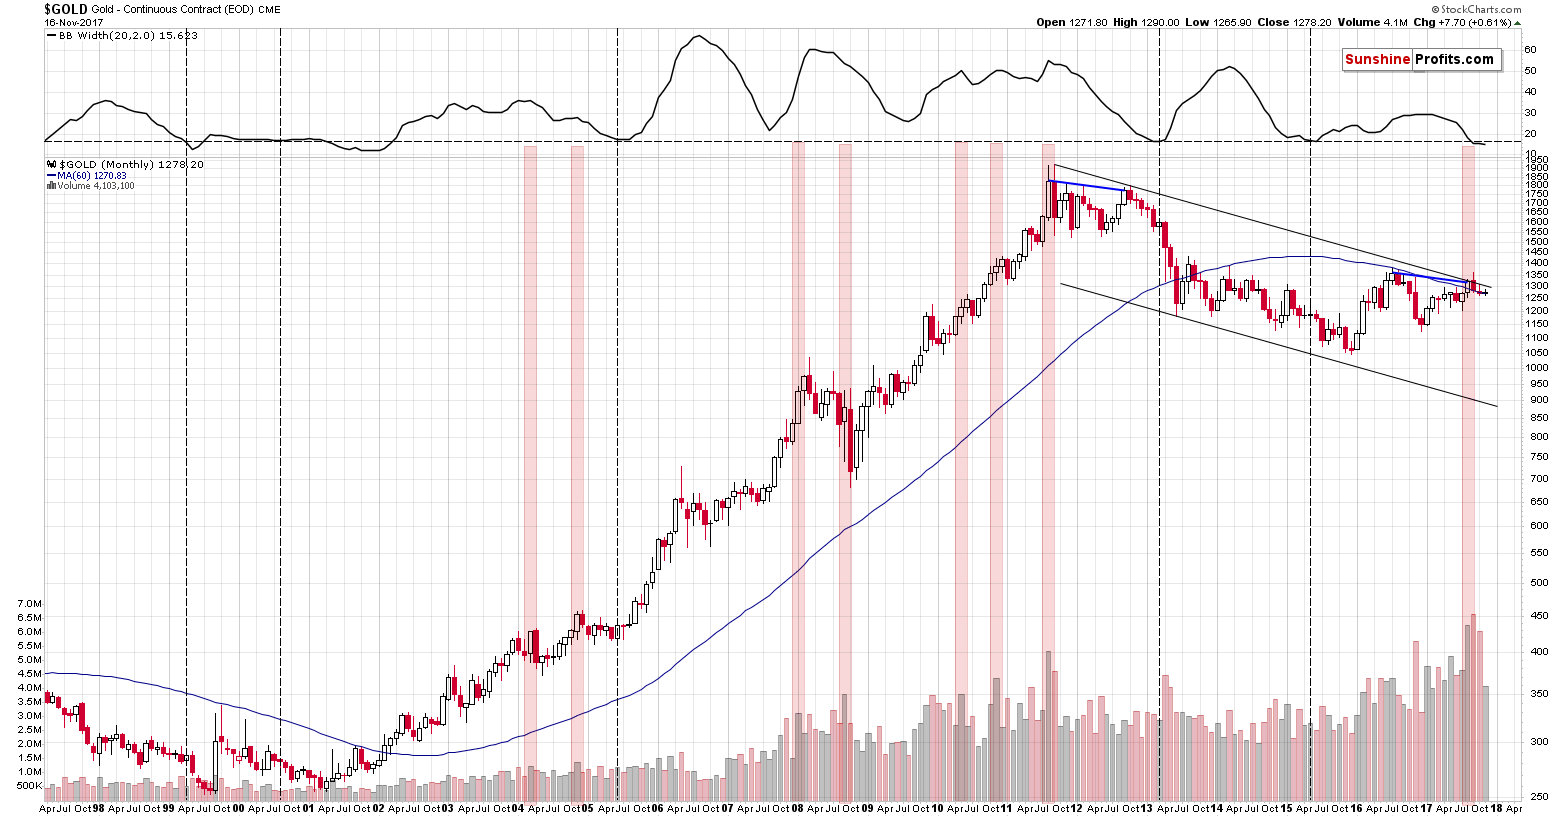
Based on the similarity to late 2012 and based on the decline in overall volatility as measured by the Bollinger Bands’ width, this month’s move is likely to be to the downside.
Based on the triangle apex technique applied to silver and gold, we can expect a turnaround in early December. So, we have a direction (as above), next turning point (early December) and the likelihood that a big, sharp move is just around the corner.
Summing up, the implication of yesterday’s boring session is therefore not to take a break from the market, but to buckle up. The prices of precious metals didn’t change much, but the relative moves of silver and mining stocks point to lower PM prices in the future and the extremely low value of the GLD’s volume suggests that a big move is just around the corner.
The upcoming bottom is likely to be followed by a tradable rally, so we’re monitoring the market for confirmations and reliable signs of strength.
To be clear, the medium-term outlook remains bearish, especially that the analogy to the 2012-2013 decline remains in place and the previously discussed long-term signals remain in place: gold’s huge monthly volume, the analogy in the HUI Index, the analogy between the two most recent series of interest rate hikes, and the RSI signal from gold priced in the Japanese yen. However, it seems to be a good idea to take advantage of the upcoming short-term correction, should we get bullish confirmations from metals or miners.
As always, we will keep you – our subscribers – informed.
To summarize:
Trading capital (supplementary part of the portfolio; our opinion): Short positions (150% of the full position) in gold, silver and mining stocks are justified from the risk/reward perspective with the following stop-loss orders and exit price levels / profit-take orders:
- Gold: exit price: $1,218; stop-loss: $1,366; exit price for the DGLD ETN: $51.98; stop-loss for the DGLD ETN $38.74
- Silver: exit price: $15.82; stop-loss: $19.22; exit price for the DSLV ETN: $28.88; stop-loss for the DSLV ETN $17.93
- Mining stocks (price levels for the GDX ETF): exit price: $21.23; stop-loss: $26.34; exit price for the DUST ETF: $29.97; stop-loss for the DUST ETF $21.37
In case one wants to bet on junior mining stocks' prices (we do not suggest doing so – we think senior mining stocks are more predictable in the case of short-term trades – if one wants to do it anyway, we provide the details), here are the stop-loss details and exit prices:
- GDXJ ETF: exit price: $30.28; stop-loss: $45.31
- JDST ETF: exit price: $66.27; stop-loss: $43.12
Long-term capital (core part of the portfolio; our opinion): No positions (in other words: cash)
Insurance capital (core part of the portfolio; our opinion): Full position
Important Details for New Subscribers
Whether you already subscribed or not, we encourage you to find out how to make the most of our alerts and read our replies to the most common alert-and-gold-trading-related-questions.
Please note that the in the trading section we describe the situation for the day that the alert is posted. In other words, it we are writing about a speculative position, it means that it is up-to-date on the day it was posted. We are also featuring the initial target prices, so that you can decide whether keeping a position on a given day is something that is in tune with your approach (some moves are too small for medium-term traders and some might appear too big for day-traders).
Plus, you might want to read why our stop-loss orders are usually relatively far from the current price.
Please note that a full position doesn’t mean using all of the capital for a given trade. You will find details on our thoughts on gold portfolio structuring in the Key Insights section on our website.
As a reminder – “initial target price” means exactly that – an “initial” one, it’s not a price level at which we suggest closing positions. If this becomes the case (like it did in the previous trade) we will refer to these levels as levels of exit orders (exactly as we’ve done previously). Stop-loss levels, however, are naturally not “initial”, but something that, in our opinion, might be entered as an order.
Since it is impossible to synchronize target prices and stop-loss levels for all the ETFs and ETNs with the main markets that we provide these levels for (gold, silver and mining stocks – the GDX ETF), the stop-loss levels and target prices for other ETNs and ETF (among other: UGLD, DGLD, USLV, DSLV, NUGT, DUST, JNUG, JDST) are provided as supplementary, and not as “final”. This means that if a stop-loss or a target level is reached for any of the “additional instruments” (DGLD for instance), but not for the “main instrument” (gold in this case), we will view positions in both gold and DGLD as still open and the stop-loss for DGLD would have to be moved lower. On the other hand, if gold moves to a stop-loss level but DGLD doesn’t, then we will view both positions (in gold and DGLD) as closed. In other words, since it’s not possible to be 100% certain that each related instrument moves to a given level when the underlying instrument does, we can’t provide levels that would be binding. The levels that we do provide are our best estimate of the levels that will correspond to the levels in the underlying assets, but it will be the underlying assets that one will need to focus on regarding the signs pointing to closing a given position or keeping it open. We might adjust the levels in the “additional instruments” without adjusting the levels in the “main instruments”, which will simply mean that we have improved our estimation of these levels, not that we changed our outlook on the markets. We are already working on a tool that would update these levels on a daily basis for the most popular ETFs, ETNs and individual mining stocks.
Our preferred ways to invest in and to trade gold along with the reasoning can be found in the how to buy gold section. Additionally, our preferred ETFs and ETNs can be found in our Gold & Silver ETF Ranking.
As a reminder, Gold & Silver Trading Alerts are posted before or on each trading day (we usually post them before the opening bell, but we don't promise doing that each day). If there's anything urgent, we will send you an additional small alert before posting the main one.
=====
Latest Free Trading Alerts:
On Wednesday, a report on U.S. consumer inflation was released. What does it imply for the gold market?
At the September FOMC press conference, Yellen admitted that subdued inflation was a mystery for the Fed. We invite you to read our today’s article about the puzzle of lacking inflation and find out what does it all mean for the gold market.
=====
Hand-picked precious-metals-related links:
PRECIOUS-Gold rises as dollar weakens on report Trump's election campaign subpoenaed
India gold prices flip to discount as wedding demand underwhelms
=====
In other news:
Norway Idea to Exit Oil Stocks Is ‘Shot Heard Around the World’
The S&P 500 hasn't done this in 52-years
From Bitcoin to Global Equities, It’s Risk-On Again in Markets
=====
Thank you.
Sincerely,
Przemyslaw Radomski, CFA
Founder, Editor-in-chief, Gold & Silver Fund Manager
Gold & Silver Trading Alerts
Forex Trading Alerts
Oil Investment Updates
Oil Trading Alerts

