

Briefly: In our opinion, full (150% of the regular full position) speculative short positions in gold, silver and mining stocks are justified from the risk/reward perspective at the moment of publishing this alert.
Even though the USD Index has not done anything in the past few days, gold, silver and mining stocks are slowly moving higher. Are they showing us that the bottom was already formed?
Let’s take a look at the chart before replying to the above question (chart courtesy of http://stockcharts.com).
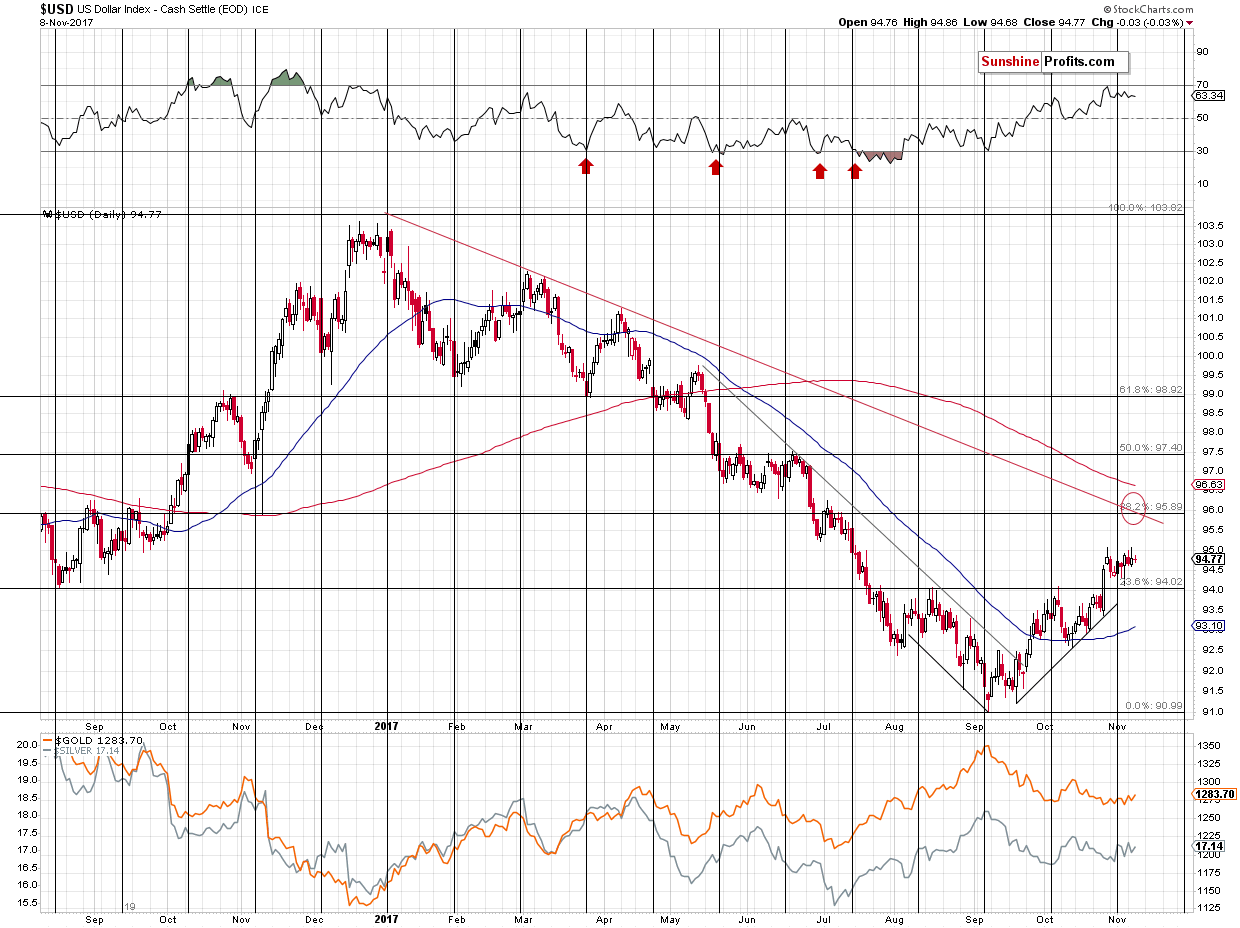
First of all, let’s say that nothing changed regarding the outlook for the USD Index:
The breakout above the neck level of the reverse head and shoulders pattern is more than confirmed, so another rally appears very likely to be seen this week. The target at about 96 level (precisely 95.89) is supported by the declining red resistance line and the 38.2% Fibonacci resistance level. Both are based on a clearly visible, medium-term move, so they are important.
With the USD Index still likely to rally in the following days (before temporarily declining), one should still expect the precious metals market to decline in the short run even if we are seeing some strength at this time.
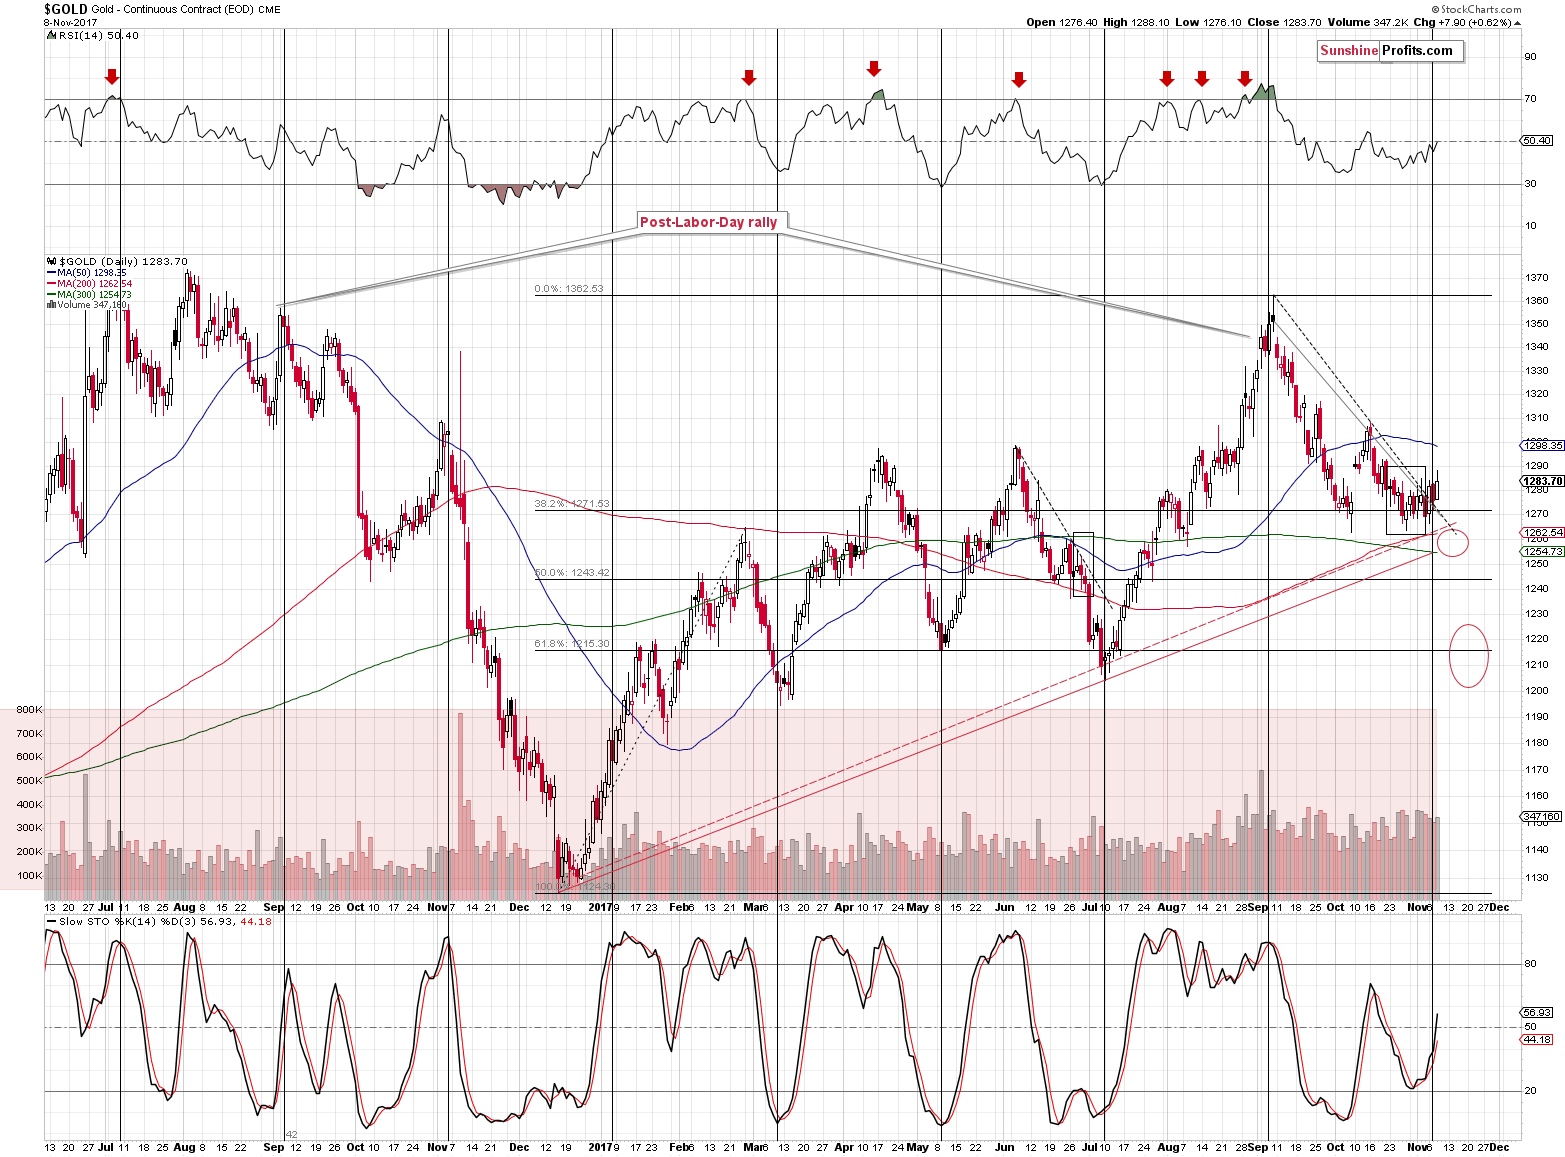
The breakout above the short-term resistance line is now confirmed. Gold is not much above this line, but still, the confirmation of the breakout makes the outlook more bullish than it was before.
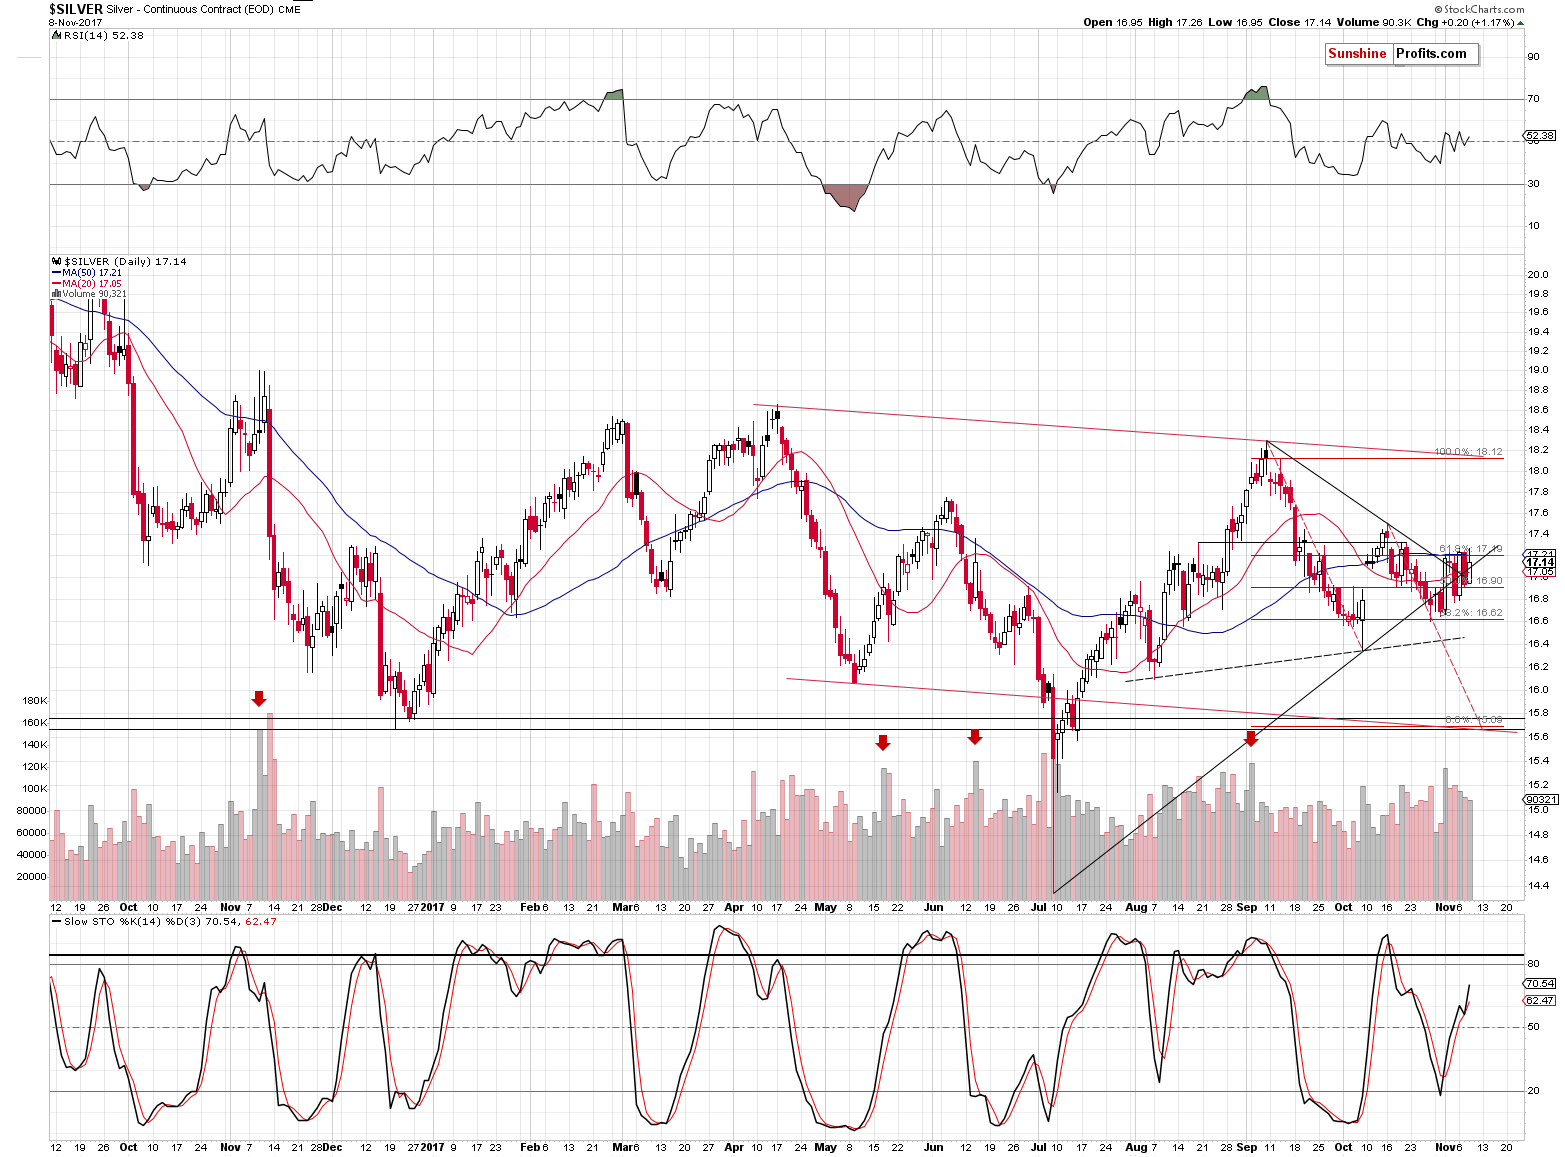
Silver’s back and forth movement around the $17 level continues. In late September, we wrote that silver could move back and forth around the $17 level before the decline continues and the white metal has certainly done so. It’s currently also moving above and below the rising and declining support/resistance lines (marked with black on the above chart). The situation is tense, with both sellers and buyers trying to push the price of silver in their direction, but it seems that without a bigger move in the USD or the general stock market silver is not willing to do anything spectacular.
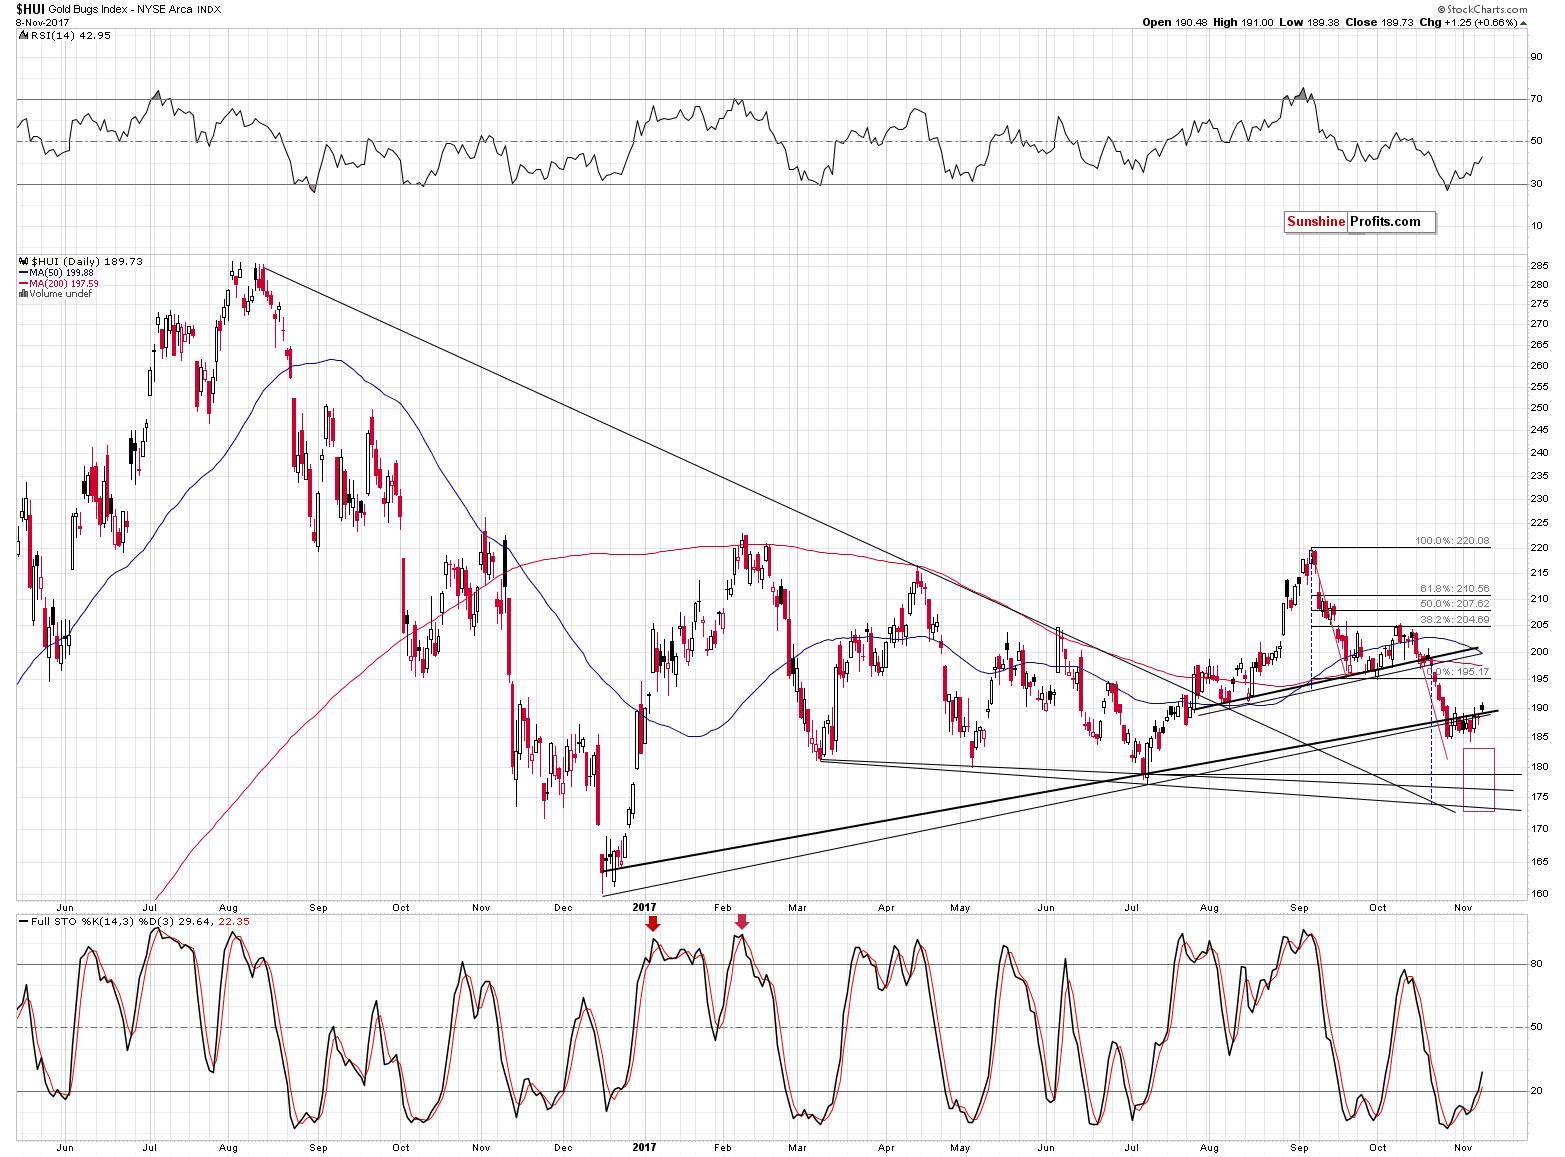
Gold stocks finally moved and closed the session above the rising support/resistance lines. The breakout is not confirmed, so little changed – already saw a breakout above these lines several days ago. Just as the late-October daily breakout was invalidated, yesterday’s one could be invalidated as well.
So, we have little changes in silver and mining stocks and a breakout in gold that took place without the USD’s help and at the same time we still have a bullish outlook in the case of the latter. So, whether anything major changed depends on how important the move in gold really was. Let’s take a look at gold from a bigger perspective.
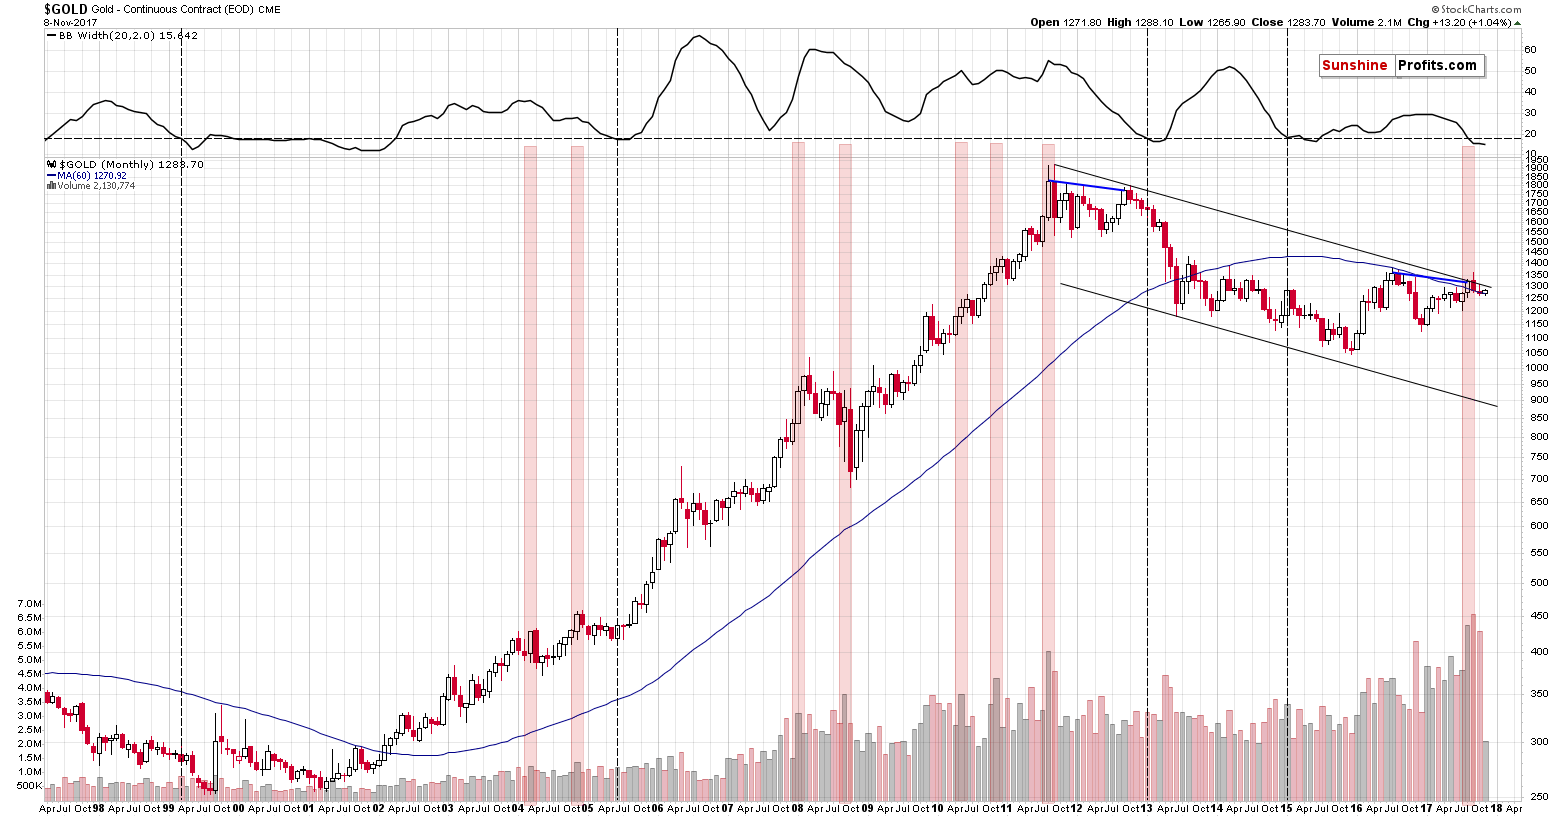
In short, the similarity to the late 2012 top remains in place. There was a small move above the previous month’s closing price, but it wasn’t anything significant. We can say the same thing about gold’s performance in November.
So, it doesn’t seem that anything really changed. If gold declines from here (say to $1,250) and then rallies even to $1,300 temporarily, but declines again before the end of the month, this action will still be more or less in tune with what happened before the big 2013 plunge.
Speaking of the $1,250 level, given gold’s move higher despite the lack of action in the USD, it became more likely that gold would only slide to $1,250-$1,260 before correcting to the upside, and then declining to $1,200 - $1,220.
The target for the USDX is more precise than the one for gold, though, so we might still close the short position based on it alone – even if neither metals nor miners reach their targets in a precise manner.
Moreover, based on gold’s short-term ability to move higher despite the lack of action in the USD it became more likely that we will open temporary long positions soon after closing the short ones. The mentioned strength doesn’t change anything regarding the medium term – it still seems that gold is about to form the final bottom below $1,000, but the above strength does indicate that we may have an additional trading opportunity in the meantime. We will monitor the market for additional bullish/bearish signs and report to you accordingly.
We are not adjusting the automatic exit levels for our current short positions as it’s still possible that the metals and miners’ reaction would be sharp and significant and since the USD Index will likely be the decisive factor, then by moving the exit levels too high we might decrease the rate of return on this trade as it could be triggered even before the USD moves to its target level.
Summing up, based on yesterday’s strength in gold, it became more probable that gold would form its next short-term bottom higher than in the $1,200 - $1,220 area, and at the same time it became more probable that we will have another interim trading opportunity before gold reaches its final bottom in the coming months.
To be clear, the medium-term outlook remains bearish, especially that the analogy to the 2012-2013 decline remains in place and the previously discussed long-term signals remain in place: gold’s huge monthly volume, the analogy in the HUI Index, the analogy between the two most recent series of interest rate hikes, and the RSI signal from gold priced in the Japanese yen. However, it seems to be a good idea to take advantage of the upcoming short-term correction, should we get bullish confirmations from metals or miners.
As always, we will keep you – our subscribers – informed.
To summarize:
Trading capital (supplementary part of the portfolio; our opinion): Short positions (150% of the full position) in gold, silver and mining stocks are justified from the risk/reward perspective with the following stop-loss orders and exit price levels / profit-take orders:
- Gold: exit price: $1,218; stop-loss: $1,366; exit price for the DGLD ETN: $51.98; stop-loss for the DGLD ETN $38.74
- Silver: exit price: $15.82; stop-loss: $19.22; exit price for the DSLV ETN: $28.88; stop-loss for the DSLV ETN $17.93
- Mining stocks (price levels for the GDX ETF): exit price: $21.23; stop-loss: $26.34; exit price for the DUST ETF: $29.97; stop-loss for the DUST ETF $21.37
In case one wants to bet on junior mining stocks' prices (we do not suggest doing so – we think senior mining stocks are more predictable in the case of short-term trades – if one wants to do it anyway, we provide the details), here are the stop-loss details and exit prices:
- GDXJ ETF: exit price: $30.28; stop-loss: $45.31
- JDST ETF: exit price: $66.27; stop-loss: $43.12
Long-term capital (core part of the portfolio; our opinion): No positions (in other words: cash)
Insurance capital (core part of the portfolio; our opinion): Full position
Important Details for New Subscribers
Whether you already subscribed or not, we encourage you to find out how to make the most of our alerts and read our replies to the most common alert-and-gold-trading-related-questions.
Please note that the in the trading section we describe the situation for the day that the alert is posted. In other words, it we are writing about a speculative position, it means that it is up-to-date on the day it was posted. We are also featuring the initial target prices, so that you can decide whether keeping a position on a given day is something that is in tune with your approach (some moves are too small for medium-term traders and some might appear too big for day-traders).
Plus, you might want to read why our stop-loss orders are usually relatively far from the current price.
Please note that a full position doesn’t mean using all of the capital for a given trade. You will find details on our thoughts on gold portfolio structuring in the Key Insights section on our website.
As a reminder – “initial target price” means exactly that – an “initial” one, it’s not a price level at which we suggest closing positions. If this becomes the case (like it did in the previous trade) we will refer to these levels as levels of exit orders (exactly as we’ve done previously). Stop-loss levels, however, are naturally not “initial”, but something that, in our opinion, might be entered as an order.
Since it is impossible to synchronize target prices and stop-loss levels for all the ETFs and ETNs with the main markets that we provide these levels for (gold, silver and mining stocks – the GDX ETF), the stop-loss levels and target prices for other ETNs and ETF (among other: UGLD, DGLD, USLV, DSLV, NUGT, DUST, JNUG, JDST) are provided as supplementary, and not as “final”. This means that if a stop-loss or a target level is reached for any of the “additional instruments” (DGLD for instance), but not for the “main instrument” (gold in this case), we will view positions in both gold and DGLD as still open and the stop-loss for DGLD would have to be moved lower. On the other hand, if gold moves to a stop-loss level but DGLD doesn’t, then we will view both positions (in gold and DGLD) as closed. In other words, since it’s not possible to be 100% certain that each related instrument moves to a given level when the underlying instrument does, we can’t provide levels that would be binding. The levels that we do provide are our best estimate of the levels that will correspond to the levels in the underlying assets, but it will be the underlying assets that one will need to focus on regarding the signs pointing to closing a given position or keeping it open. We might adjust the levels in the “additional instruments” without adjusting the levels in the “main instruments”, which will simply mean that we have improved our estimation of these levels, not that we changed our outlook on the markets. We are already working on a tool that would update these levels on a daily basis for the most popular ETFs, ETNs and individual mining stocks.
Our preferred ways to invest in and to trade gold along with the reasoning can be found in the how to buy gold section. Additionally, our preferred ETFs and ETNs can be found in our Gold & Silver ETF Ranking.
As a reminder, Gold & Silver Trading Alerts are posted before or on each trading day (we usually post them before the opening bell, but we don't promise doing that each day). If there's anything urgent, we will send you an additional small alert before posting the main one.
=====
Latest Free Trading Alerts:
On Tuesday, Democrats won some regional elections. What does it mean for the gold market?
2017 U.S. Elections, Tax Reform, and Gold
S&P 500 index gained 0.15% on Wednesday, as it extended its short-term fluctuations along new record high. Is this a topping pattern or just pause before another leg up?
=====
Hand-picked precious-metals-related links:
PRECIOUS-Gold claws higher on dollar; palladium hits new 16-year high
Gold demand slides to eight-year low in third quarter of 2017: WGC
=====
In other news:
Stocks Drop, Led by Miners; Dollar Declines: Markets Wrap
In 2017, Investors Can Either Buy Bubbles or Be Left Far Behind
The eurozone strikes back – why Europe is booming again
Short sellers are not evil, but they are misunderstood
=====
Thank you.
Sincerely,
Przemyslaw Radomski, CFA
Founder, Editor-in-chief, Gold & Silver Fund Manager
Gold & Silver Trading Alerts
Forex Trading Alerts
Oil Investment Updates
Oil Trading Alerts

