

Briefly: in our opinion, full (250% of the regular size of the position) speculative short positions in gold, silver and mining stocks are justified from the risk/reward perspective at the moment of publishing this alert.
Not much happened yesterday on the precious metals market, but the situation became more bearish anyway. Why? Because the factors that impact gold, silver, and mining stocks don’t come only from the PM market itself. In today’s globalized economy, no market can move entirely on its own and we see the same thing in gold and the rest of the PM sector. The two key actions that we need to take into account today is what happened in the currency markets. The USD Index’s breakout to new 2018 highs is one thing, and the second thing is the strong sign that gold’s relative strength to the former is likely over. Taken together they paint a coherent outlook for the precious metals sector. And it’s terrible.
First and foremost: we saw the breakout to new 2018 highs in the USD Index in terms of the closing prices.
USD’s Bullish Outlook
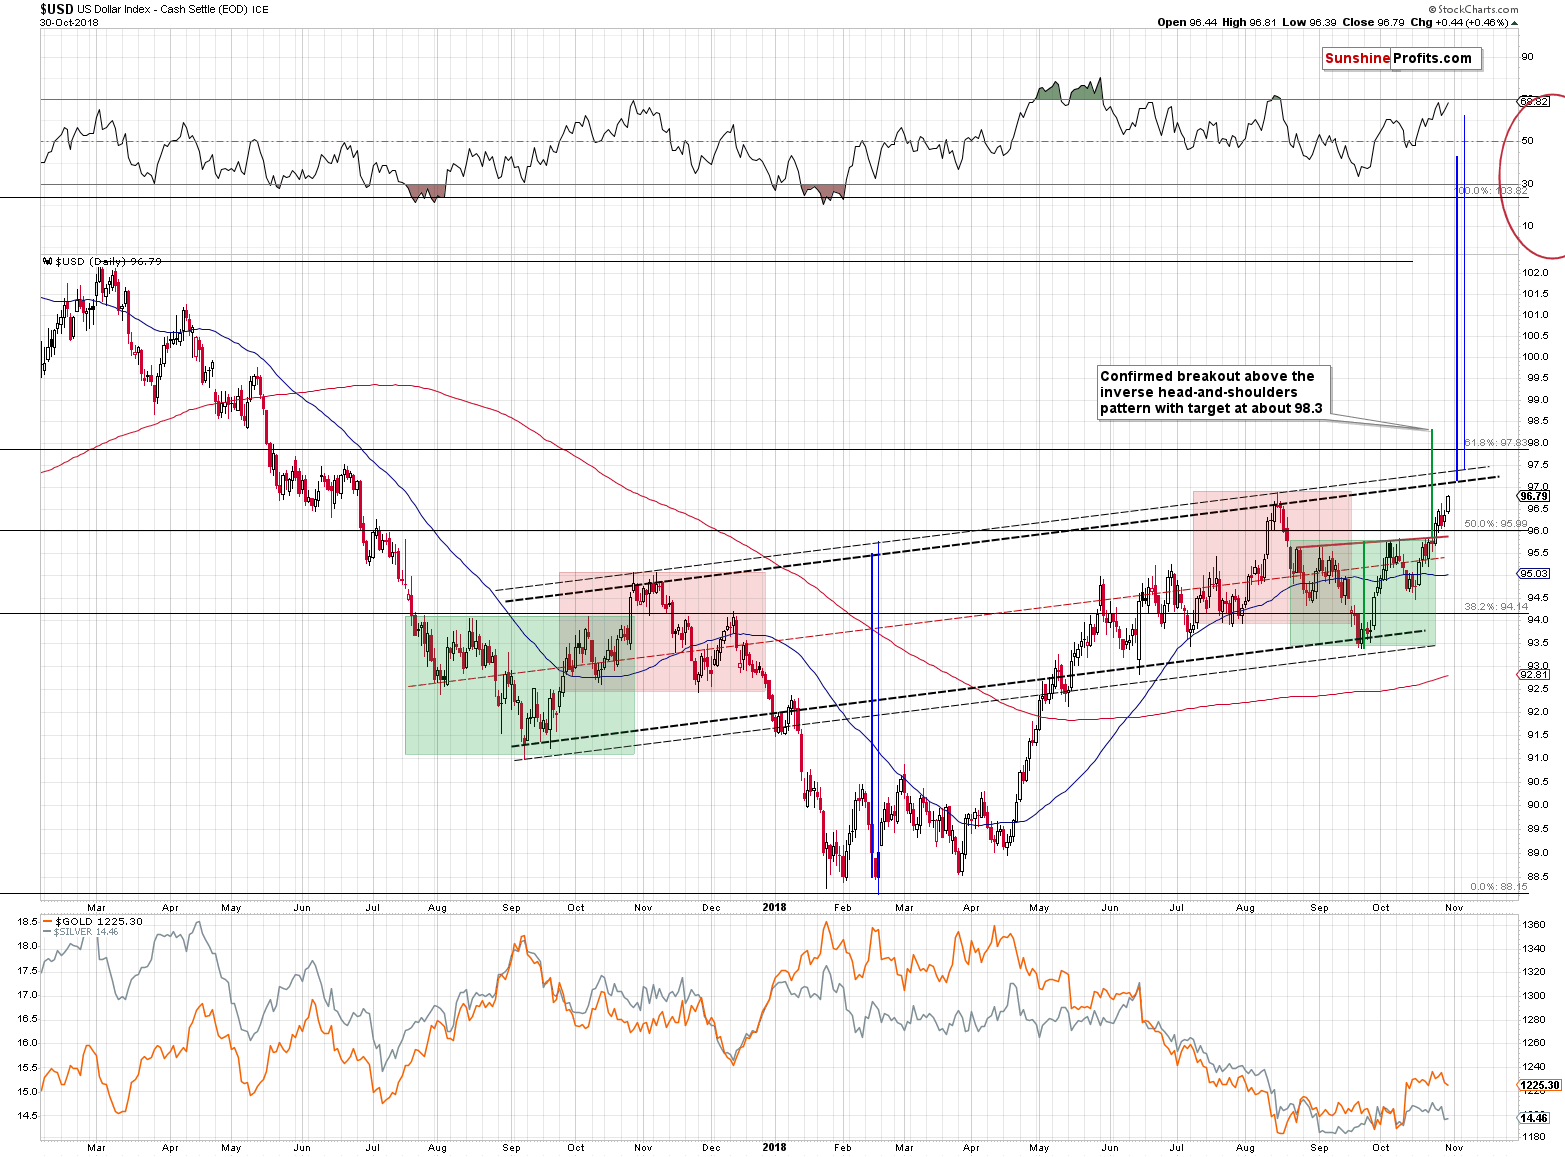
There was no breakout in terms of intraday highs, but there was a clear one in terms of the daily closes. Yesterday’s close of 96.79 is definitely higher than the previous 2018 high of 96.61 that we saw on August 14th. The technical developments based on closing prices tend to be more important than the ones based on the intraday prices, so the bullish implications are already present.
Naturally, they will be more bullish once the breakout is confirmed, but the odds are that it will be confirmed. And there are three reasons for it.
The first reason is the recent verification of the breakout above the local (marked with green) inverse head-and-shoulders pattern. The target based on this formation is approximately 98.3.
The second reason is the reflective nature of the USD Index that seems to be turning into the powerful long-term inverse head-and-shoulders pattern. The latter is not completed yet, so it has no implications on its own, but the reflective nature of the recent movement does. To be clear, the October / November 2017 top is like the August 2018 top as they both took form of head-and-shoulders tops and we marked them with red. The outside shoulders of the top above-mentioned formations (left in 2017 and right in 2018) were the inside shoulders of the inverse head-and-shoulders patterns. We marked them with green.
As we wrote earlier, the current inverse head-and-shoulders pattern has no direct implications yet as the price has not yet broken above its neck level, let alone confirmed such breakout. But, in light of the striking similarity between the 2017 decline and this year’s upswing, it’s likely that this formation will be completed.
The third reason is the long-term analogy to the previous big upswings.
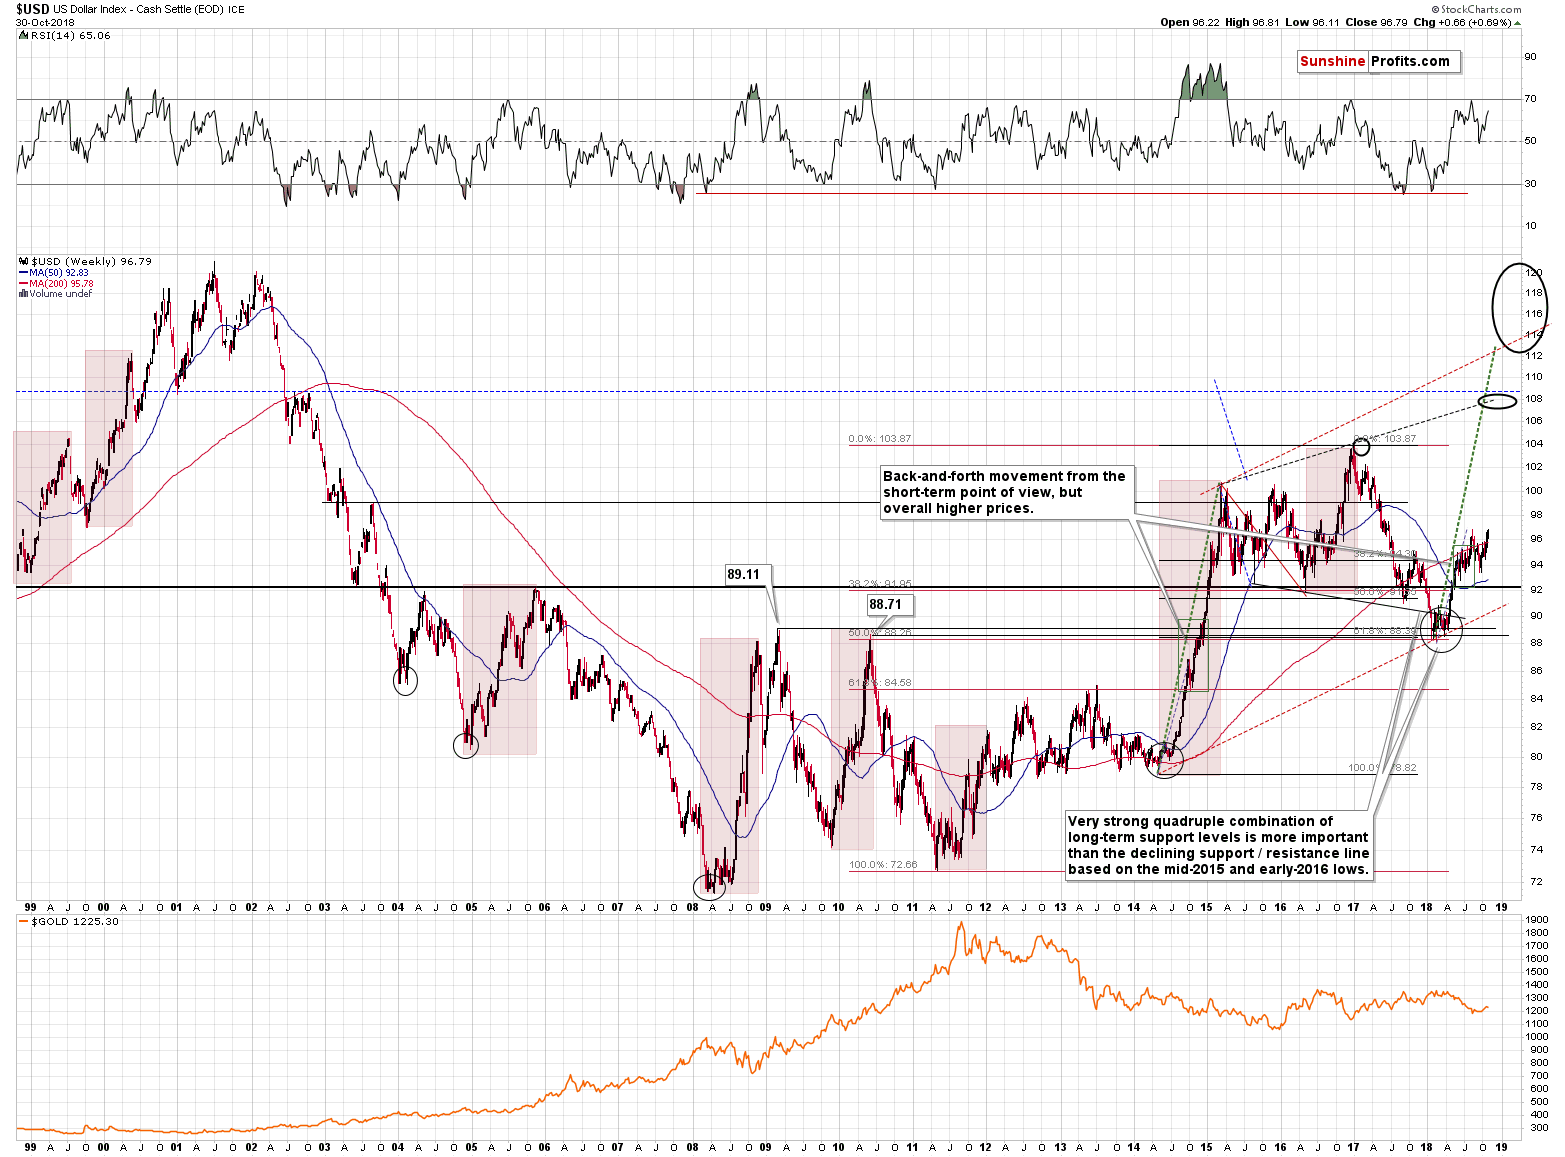
This year’s rally is still similar to what we saw in 2008, 2010 and to the 2014-2015 upswing. The most recent consolidation was (given yesterday’s breakout it appears to be completed) bigger, but still similar to the one that we saw in 2010. Please note that based on the above chart, the USD Index is likely to move above the 2017 high, perhaps significantly so – to the 108 level, or even higher.
Taking all three points into account, the next few weeks and months look very promising for the US currency.
We can’t say the same about the Japanese currency, though. At least not with relation to the USD.
Yen’s Failed Breakout
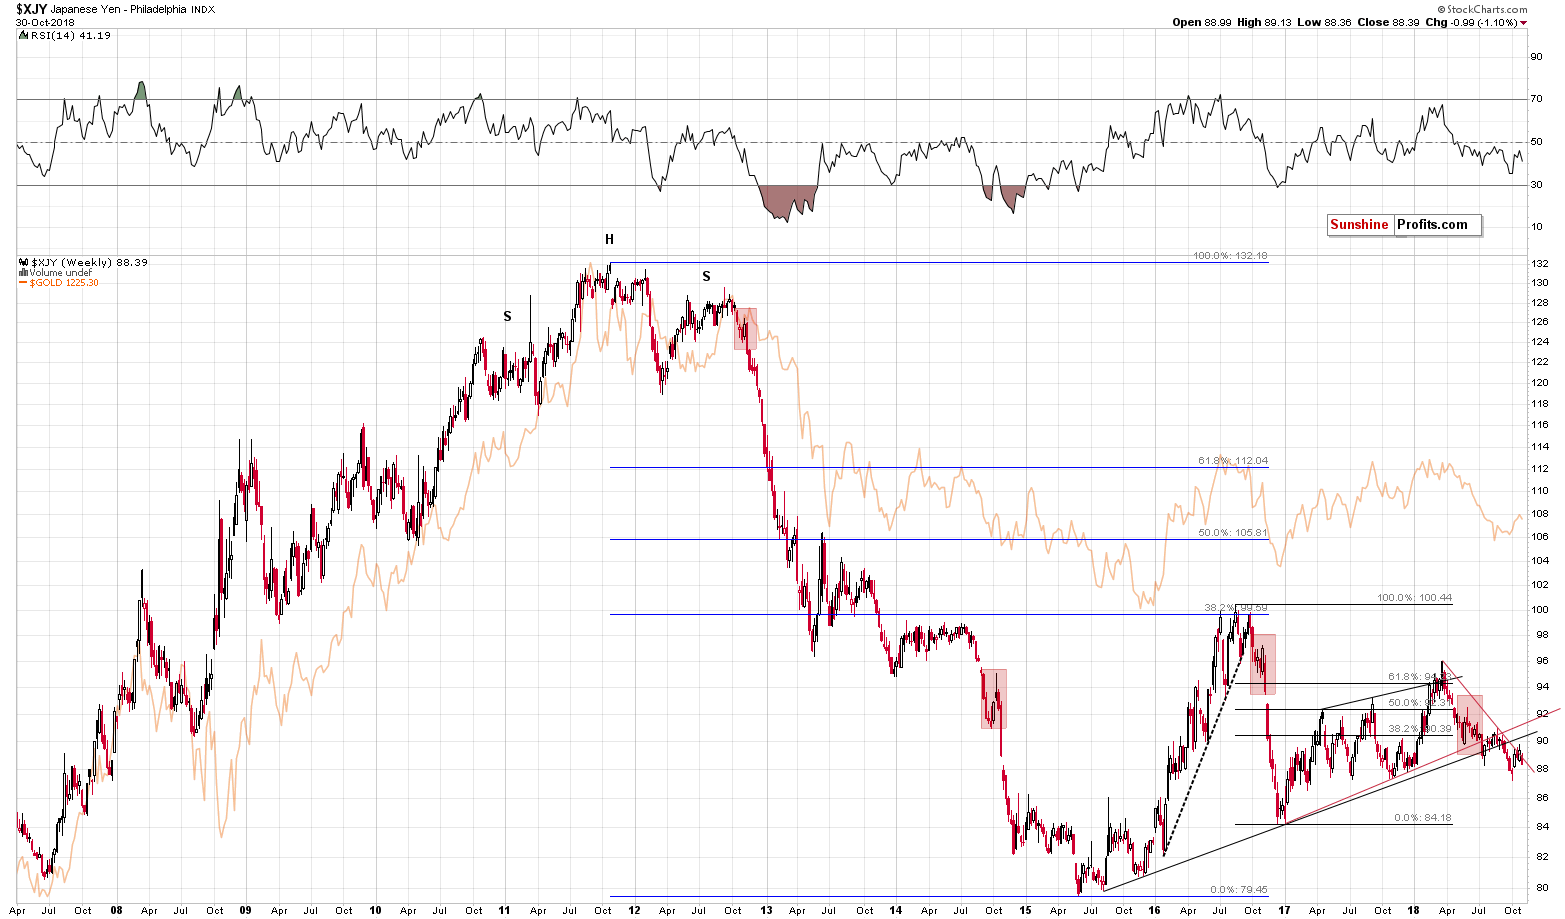
The Japanese yen moved a bit higher after confirming the breakdown below the key rising support line based on the 2015 and 2016 lows, and even briefly moved above the declining red resistance line. This move was quickly invalidated, and the outlook is clearly bearish.
Why do we mention this with regard to the precious metals market? Because the yen has been particularly strongly connected with gold’s performance. Gold’s moves may not always be in perfect tune with the ones of the yen and at times one market leads the other, but overall the link between them is very strong and very important.
With the outlook bearish for the yen and very bullish for the USD Index, the implications for the precious metals sector are very bearish.
And what about the euro and gold?
Gold’s European Signal
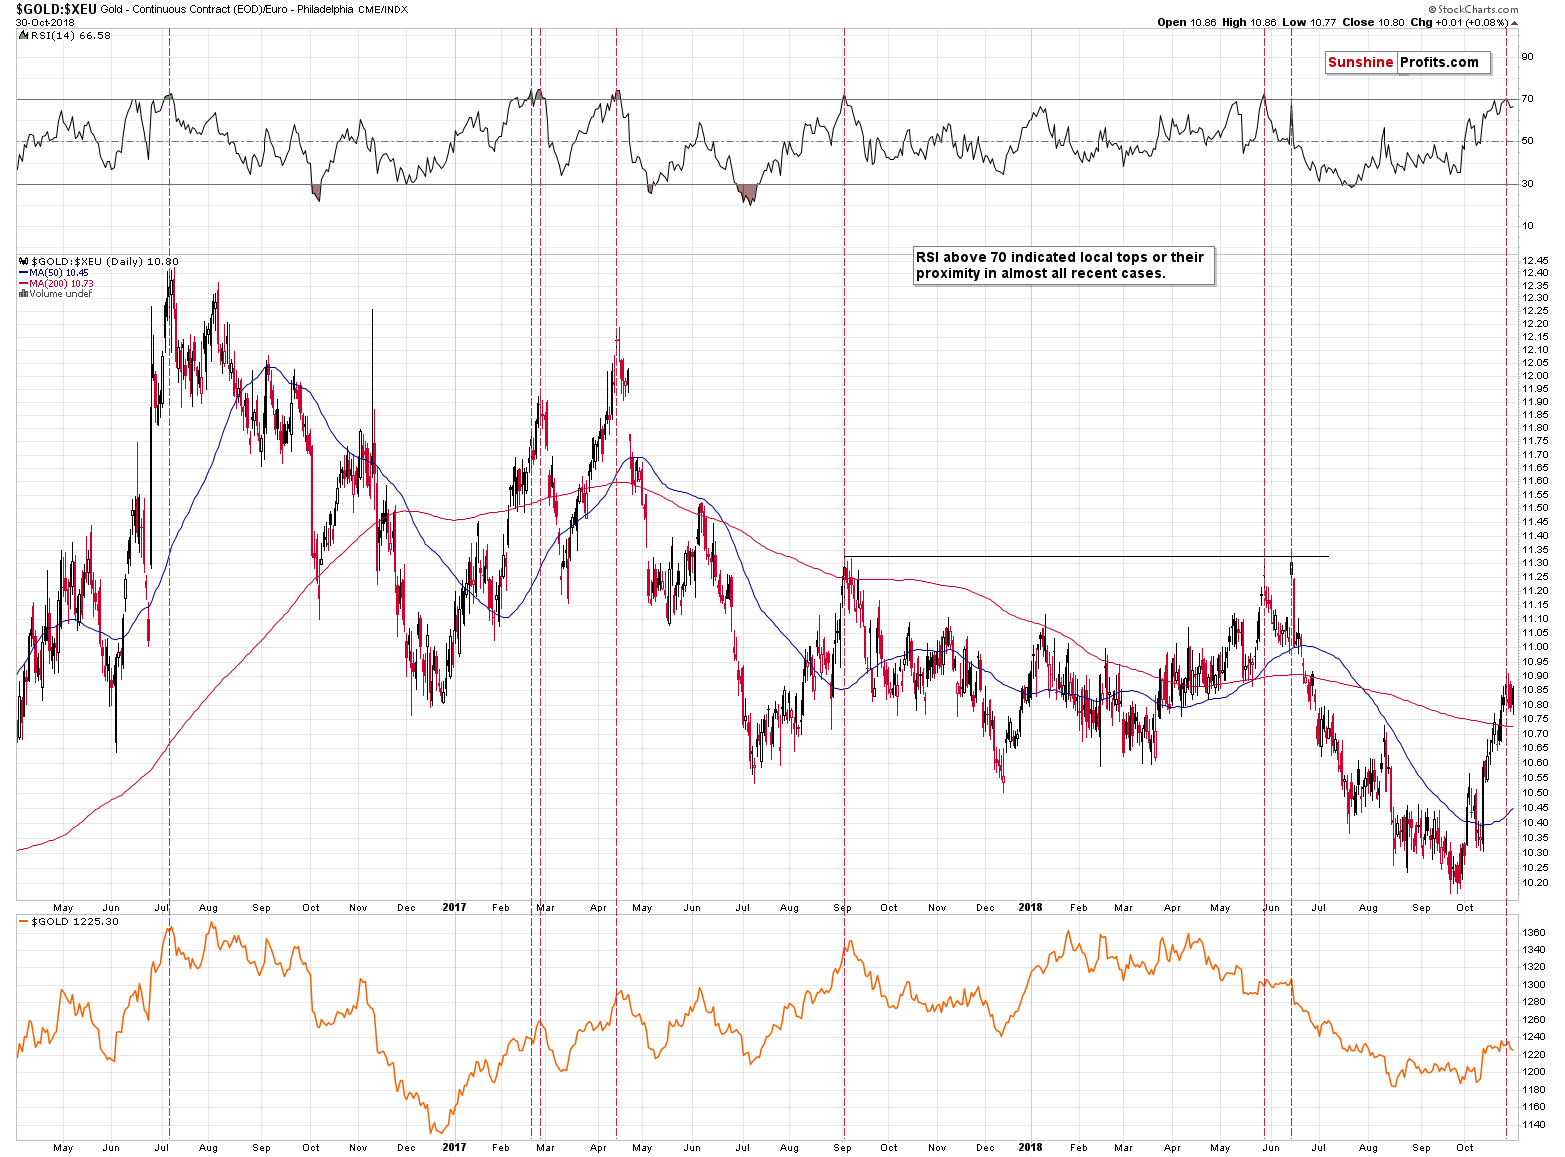
Looking at the gold price in terms of the euro provides us with a very effective sell signal. In practically all cases when the RSI moved above 70, it meant that the local top is in or about to be in (marked with vertical red lines on the above chart). That’s exactly what we saw a few days ago and the implications are bearish.
This means that while recently gold remained relatively strong in light of the increasing values of the USD Index, this kind of performance is not likely to continue. Conversely, gold is likely to underperform relative to the USD Index and it seems that we are seeing one of the confirmations in today’s pre-market trading. Gold and silver are down, while the USD Index is basically unchanged.
The above, combined with the very bullish outlook for the USD Index, makes the outlook particularly bearish for gold in the following weeks.
Consequently, while this week’s decline in gold was quite small so far, it doesn’t mean that it will stay this way for much longer. The trend regarding gold’s strength of reaction to USD movement has most likely already reversed and we can expect significant declines very soon.
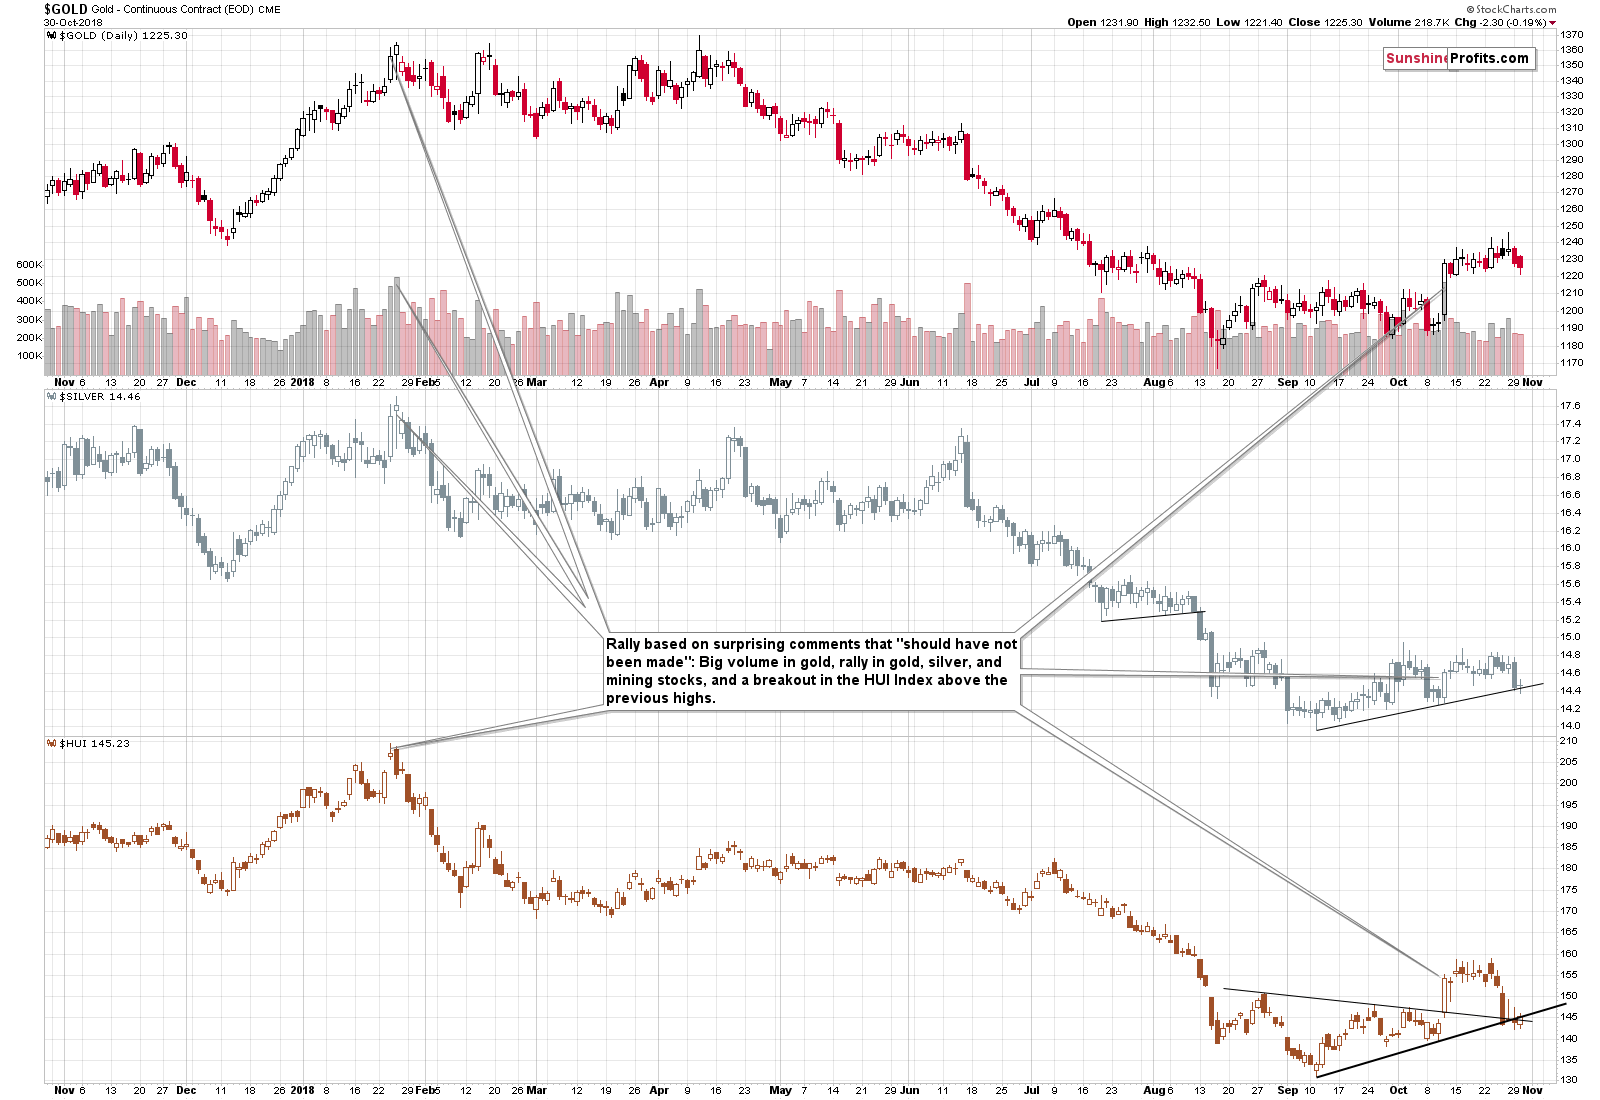
Gold stocks moved a bit higher yesterday, while gold moved lower, which may appear to be a bullish sign, but it’s much too early to say so. Miners were the first to decline in the recent days, so it simply seems that gold’s reaction was delayed. It’s within the definition of what’s normal at this time and doesn’t appear to be a bullish divergence in gold.
Before summarizing, let’s take a closer look at the silver market. In yesterday’s analysis, we wrote the following:
Silver Short-term Analogy
Silver is leading gold in the decline as well, but it’s a normal course of action given the situation in the gold to silver ratio.
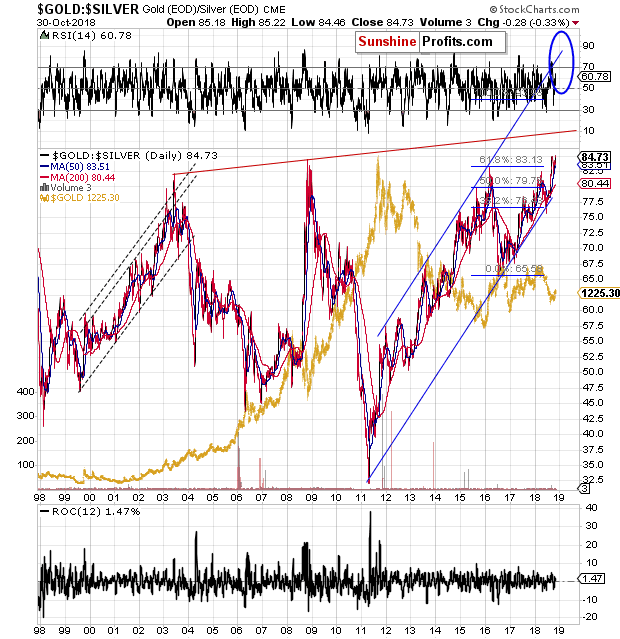
The ratio moved above the recent highs and it’s most likely on its way to its true long-term highs at about 100. The above chart is not long-term enough to feature those highs, but the one below is.
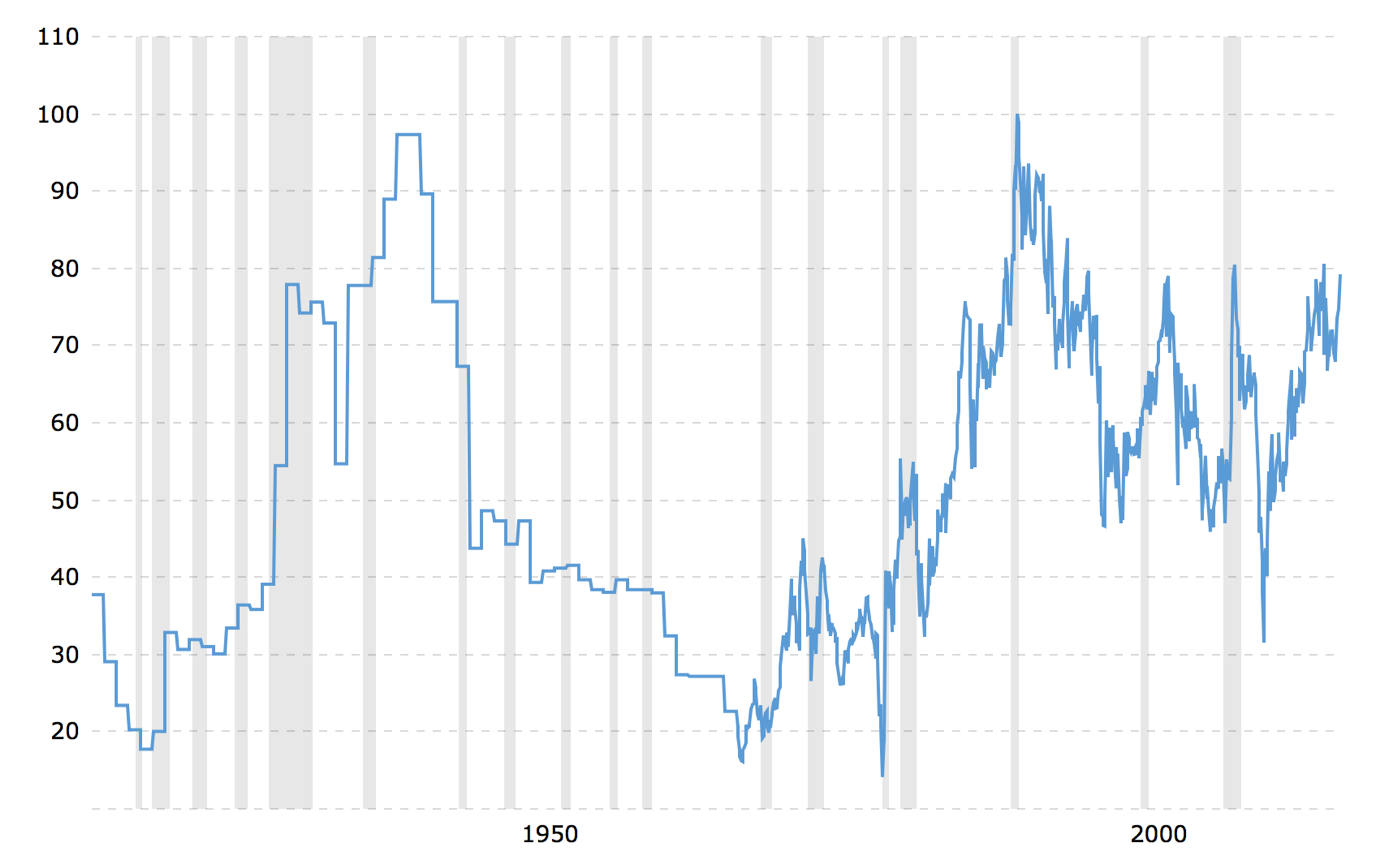
The real long-term target is at about 100 – this level stopped the huge rallies in the ratio in two key cases in the past, which makes it a natural target for the current rally (note: the above chart is not based on the most recent prices – in reality the ratio is already above the 2003 and 2008 highs).
The 100 target is also very important from the psychological point of view. The round numbers tend to work very well as support and resistance levels simply because a lot of people tend to notice them. “Silver now 100x as expensive as gold” would be an appealing headline, while “Silver now at 87.42x as expensive as gold” is not.
(…)
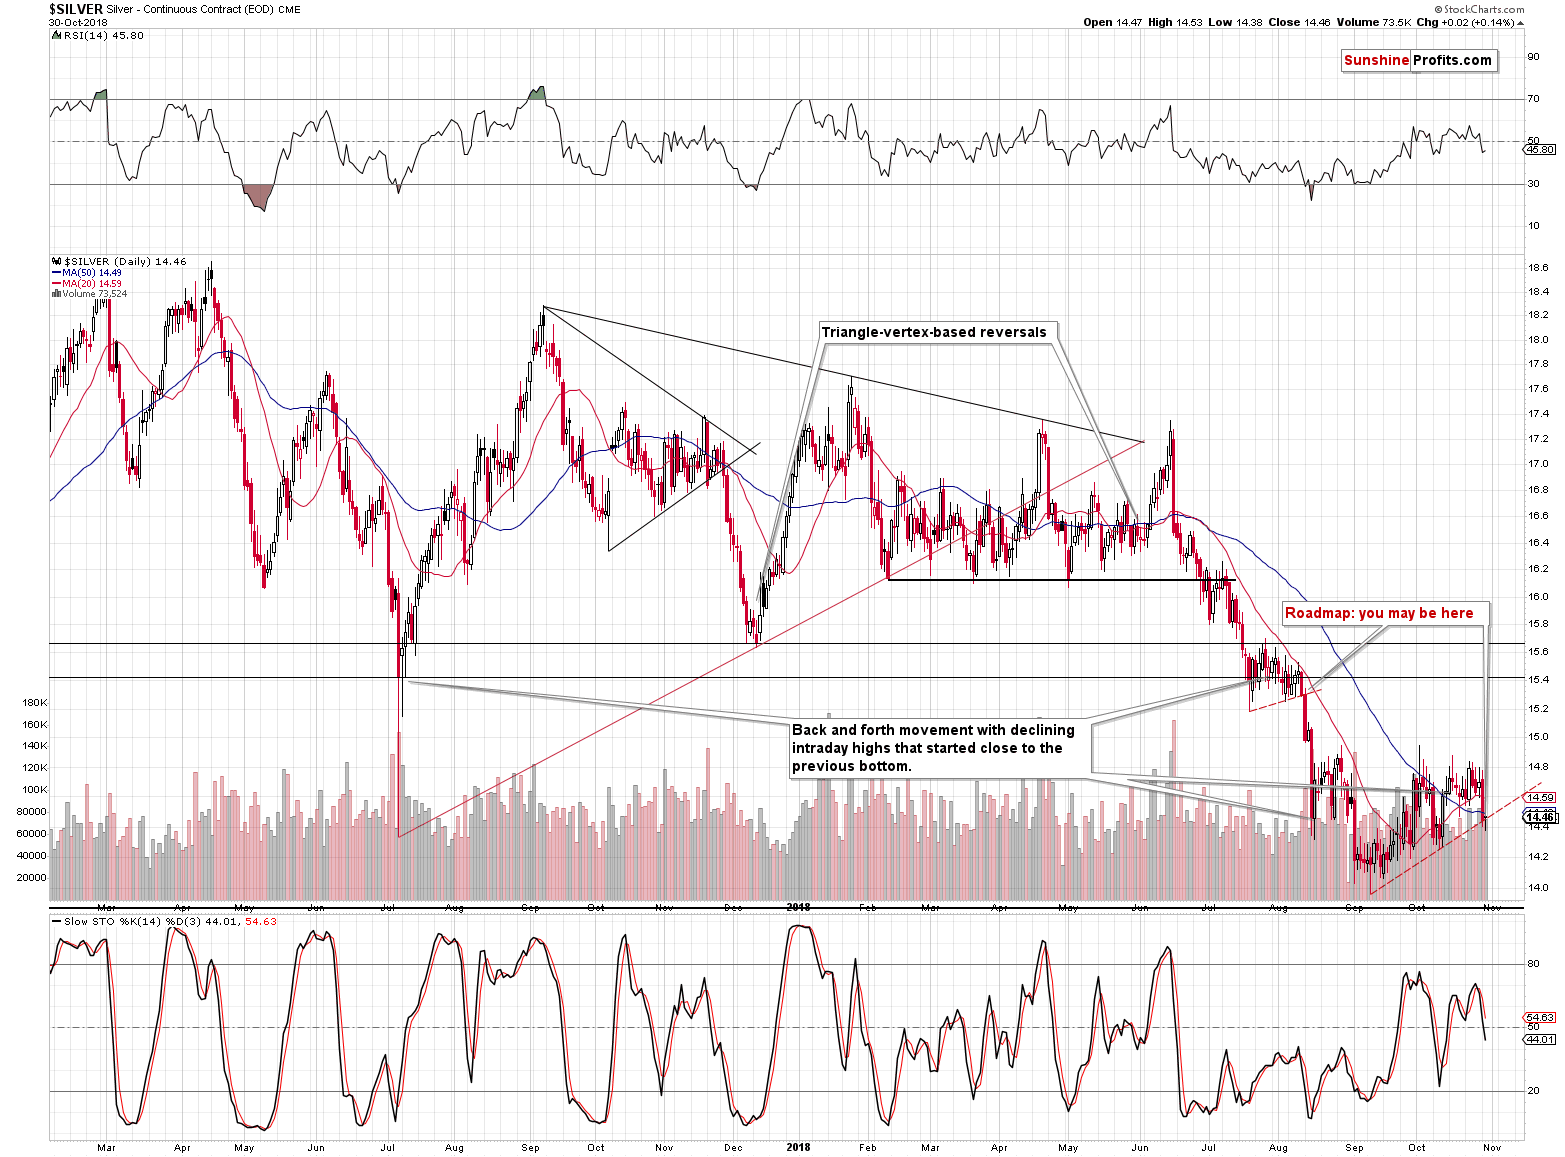
Silver has been moving back and forth recently with lower intraday highs. This seems like nothing special, until you notice that almost exactly the same thing happened in late July and early August. Right before the sharp $1+ decline.
And it’s not only the shape that’s alike. We can see similarity also in terms of the price level around which both consolidations took place. It was a major bottom in terms of the daily closing prices. In July and August silver moved back and forth around the July 2017 bottom. In this case, silver is moving around the mid-August bottom.
Moreover, this time, silver is consolidating after breaking below a very important long-term support line.
If the similarity to the July – August is to continue (and that’s likely), then we may have just seen the pre-slide move. Please compare where silver closed yesterday and where it closed on August 10th. In both cases that was a move to the rising support line that was based on the previous short-term lows. If the analogy is to continue, silver is likely to decline significantly shortly – perhaps even today.
The thing that we would like to add today is that a daily or even a few-day-long delay in the powerful slide is not something that would invalidate the above analogy, because the sideways trading pattern that we saw in July and August was shorter than the current one. A pattern that took longer to form can have a longer pause before the final breakdown from it – it’s normal. Consequently, just because we haven’t seen the big slide yesterday, it doesn’t mean that one isn’t coming very soon. It most likely is just around the corner.
Important Analyses
Before summarizing, we would like to emphasize that we have recently posted several analyses that are very important and that one should keep in mind, especially in the next several weeks. If you haven’t had the chance of reading them previously, we encourage you to do so today:
- Dear Gold Investor - Letters from 2013 - Analogy to 2013, which should make it easier to trade the upcoming sizable upswing (if enough factors point to it, that is) and to enter the market close to the final bottom.
- Gold to Soar Above $6,000 - discussion of gold’s long-term upside target of $6,000.
- Preparing for THE Bottom in Gold: Part 6 – What to Buy - extremely important analysis of the portfolio structure for the next huge, multi-year rally in the precious metals.
- Preparing for THE Bottom in Gold: Part 7 – Buy-and-hold on Steroids - description of a strategy dedicated to significantly boosting one’s long-term investment returns while staying invested in the PM sector.
- Gold’s Downside Target, Upcoming Rebound, and Miners’ Buy Plan - details regarding the shape of the following price moves, a buying plan for mining stocks, and a brief discussion of the final price targets for the current decline.
- Gold: What Happened vs. What Changed - discussion of the latest extreme readings from gold’s CoT report
- Key Factors for Gold & Silver Investors - discussion of key, long-term factors that support the bearish outlook for PMs. We are often asked what makes us so bearish – this article is a reply to this question.
- The Upcoming Silver Surprise - two sets of price targets for gold, silver and mining stocks: the initial and the final one.
- Precious Metals Sector: It’s 2013 All Over Again - comparison between 2013 and 2018 throughout the precious metals sector, the general stock market and the USD Index. Multiple similarities point to the repeat of a 2013-style volatile decline in the PMs.
- Changing One's Mind - Why, When, and How – discussing the way of analyzing the market that helps to stay focused on the growing one’s capital while not being influenced by the loss aversion bias. This essay might be particularly useful in light of the recent upswing in the PMs.
- Inverse H&S Patterns and Something Even More Extreme - gold targets for the current decline in terms of price and time.
Summary
Summing up,there are multiple factors in place that point to much lower precious metals and mining stock prices in the coming days and weeks and it seems that the recent strong performance of gold relative to the USD Index is over. The outlook for the precious metals sector is very bearish. All in all, it seems that the profits on our short positions will increase significantly very soon.
As always, we’ll keep you – our subscribers – informed.
To summarize:
Trading capital (supplementary part of the portfolio; our opinion): Full short positions (250% of the full position) in gold, silver and mining stocks are justified from the risk/reward perspective with the following stop-loss orders and exit profit-take price levels:
- Gold: profit-take exit price: $1,062; stop-loss: $1,257; initial target price for the DGLD ETN: $82.96; stop-loss for the DGLD ETN $49.27
- Silver: profit-take exit price: $12.72; stop-loss: $15.26; initial target price for the DSLV ETN: $46.97; stop-loss for the DSLV ETN $28.87
- Mining stocks (price levels for the GDX ETF): profit-take exit price: $13.12; stop-loss: $20.83; initial target price for the DUST ETF: $80.97; stop-loss for the DUST ETF $27.67
Note: the above is a specific preparation for a possible sudden price drop, it does not reflect the most likely outcome. You will find a more detailed explanation in our August 1 Alert. In case one wants to bet on junior mining stocks’ prices (we do not suggest doing so – we think senior mining stocks are more predictable in the case of short-term trades – if one wants to do it anyway, we provide the details), here are the stop-loss details and target prices:
- GDXJ ETF: profit-take exit price: $17.52; stop-loss: $31.23
- JDST ETF: initial target price: $154.97 stop-loss: $51.78
Long-term capital (core part of the portfolio; our opinion): No positions (in other words: cash)
Insurance capital (core part of the portfolio; our opinion): Full position
Important Details for New Subscribers
Whether you already subscribed or not, we encourage you to find out how to make the most of our alerts and read our replies to the most common alert-and-gold-trading-related-questions.
Please note that the in the trading section we describe the situation for the day that the alert is posted. In other words, it we are writing about a speculative position, it means that it is up-to-date on the day it was posted. We are also featuring the initial target prices, so that you can decide whether keeping a position on a given day is something that is in tune with your approach (some moves are too small for medium-term traders and some might appear too big for day-traders).
Plus, you might want to read why our stop-loss orders are usually relatively far from the current price.
Please note that a full position doesn’t mean using all of the capital for a given trade. You will find details on our thoughts on gold portfolio structuring in the Key Insights section on our website.
As a reminder – “initial target price” means exactly that – an “initial” one, it’s not a price level at which we suggest closing positions. If this becomes the case (like it did in the previous trade) we will refer to these levels as levels of exit orders (exactly as we’ve done previously). Stop-loss levels, however, are naturally not “initial”, but something that, in our opinion, might be entered as an order.
Since it is impossible to synchronize target prices and stop-loss levels for all the ETFs and ETNs with the main markets that we provide these levels for (gold, silver and mining stocks – the GDX ETF), the stop-loss levels and target prices for other ETNs and ETF (among other: UGLD, DGLD, USLV, DSLV, NUGT, DUST, JNUG, JDST) are provided as supplementary, and not as “final”. This means that if a stop-loss or a target level is reached for any of the “additional instruments” (DGLD for instance), but not for the “main instrument” (gold in this case), we will view positions in both gold and DGLD as still open and the stop-loss for DGLD would have to be moved lower. On the other hand, if gold moves to a stop-loss level but DGLD doesn’t, then we will view both positions (in gold and DGLD) as closed. In other words, since it’s not possible to be 100% certain that each related instrument moves to a given level when the underlying instrument does, we can’t provide levels that would be binding. The levels that we do provide are our best estimate of the levels that will correspond to the levels in the underlying assets, but it will be the underlying assets that one will need to focus on regarding the signs pointing to closing a given position or keeping it open. We might adjust the levels in the “additional instruments” without adjusting the levels in the “main instruments”, which will simply mean that we have improved our estimation of these levels, not that we changed our outlook on the markets. We are already working on a tool that would update these levels on a daily basis for the most popular ETFs, ETNs and individual mining stocks.
Our preferred ways to invest in and to trade gold along with the reasoning can be found in the how to buy gold section. Additionally, our preferred ETFs and ETNs can be found in our Gold & Silver ETF Ranking.
As a reminder, Gold & Silver Trading Alerts are posted before or on each trading day (we usually post them before the opening bell, but we don't promise doing that each day). If there's anything urgent, we will send you an additional small alert before posting the main one.
Thank you.
Sincerely,
Przemyslaw Radomski, CFA
Editor-in-chief, Gold & Silver Fund Manager
Gold & Silver Trading Alerts
Forex Trading Alerts
Oil Investment Updates
Oil Trading Alerts

