

Briefly: in our opinion, full (250% of the regular size of the position) speculative short positions in gold, silver and mining stocks are justified from the risk/reward perspective at the moment of publishing this alert. We are moving the stop-loss level for gold a bit higher.
Gold, silver and mining stocks moved higher on Friday and the USD Index declined. The move was particularly visible in the case of gold, so it might appear that the bottom in the yellow metal is already in. Especially given the extremely low number of positions held by Large Speculators as shown by the latest CoT report. Is it?
It’s very unlikely. Let’s jump right into the charts for details (charts courtesy of http://stockcharts.com).
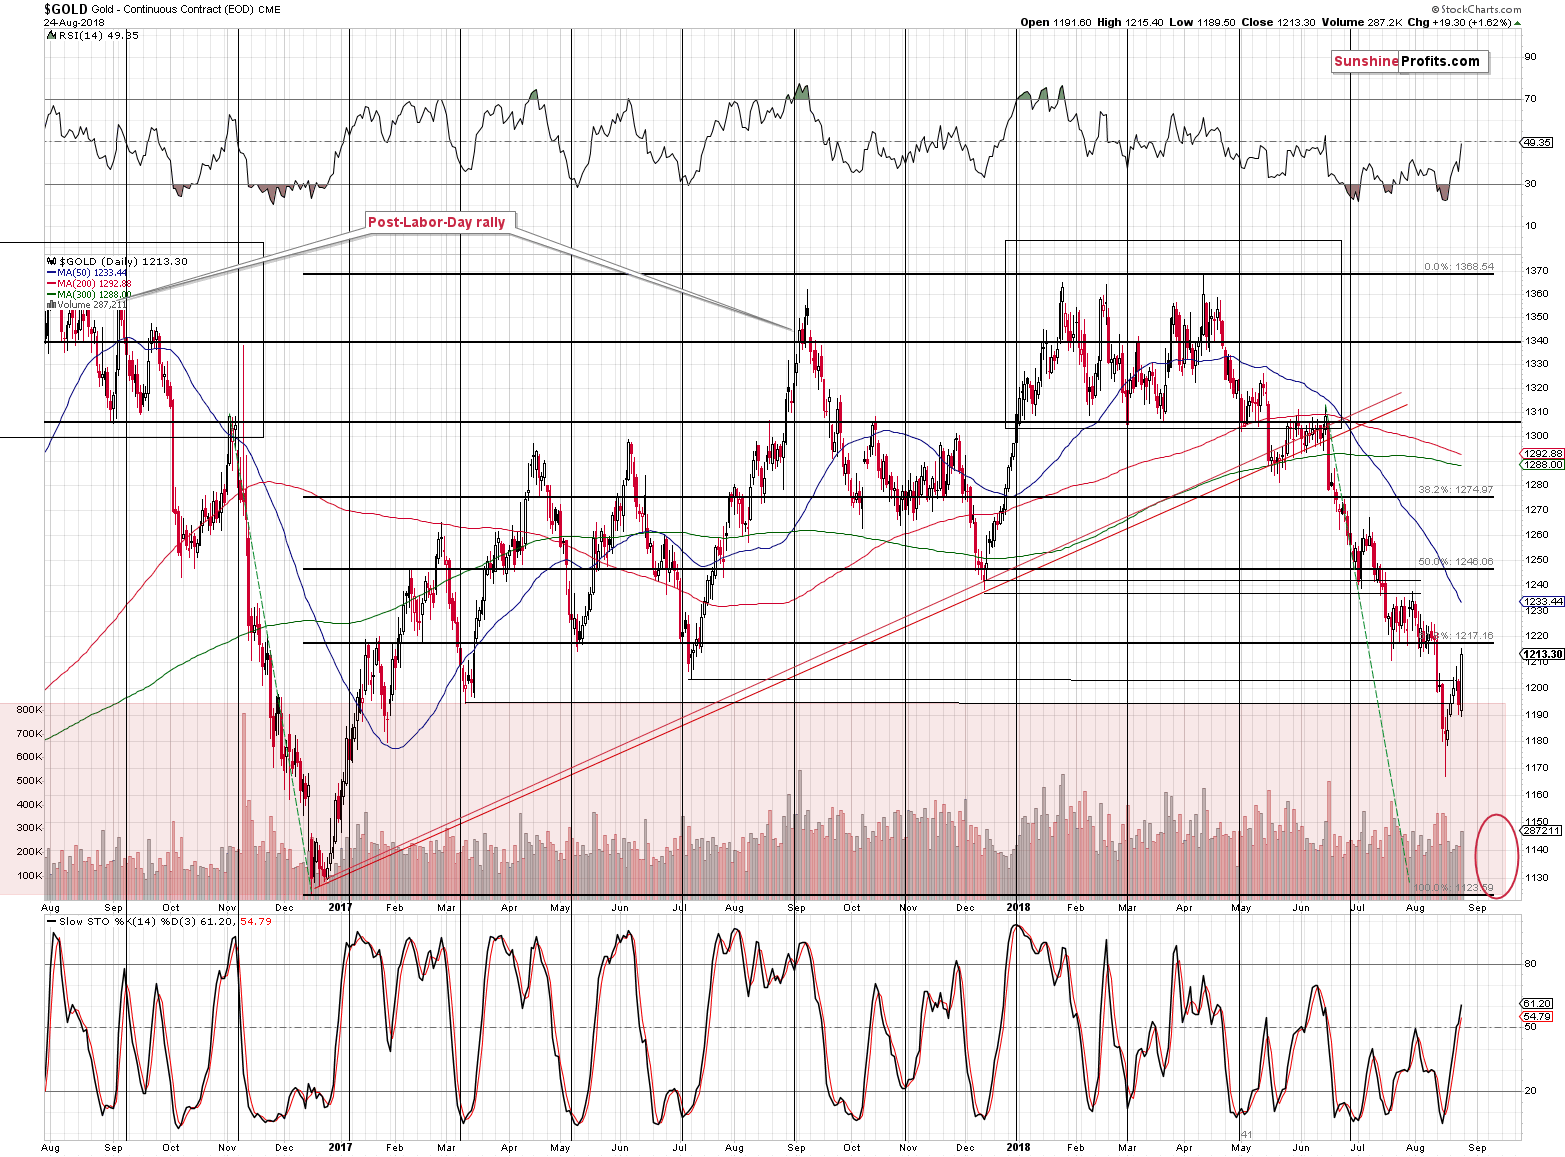
Gold moved close to its previous lows and the previous support provided by the 61.8% Fibonacci retracement level. Gold closed above some of the 2017 bottoms, but not above the mentioned Fibonacci retracement and not above the July 2018 and early August lows. Consequently, while the move might have appeared significant, it didn’t change much from the technical point of view. It still seems to be just a correction within a bigger decline. Especially that the above is the most bullish chart that we have right now.
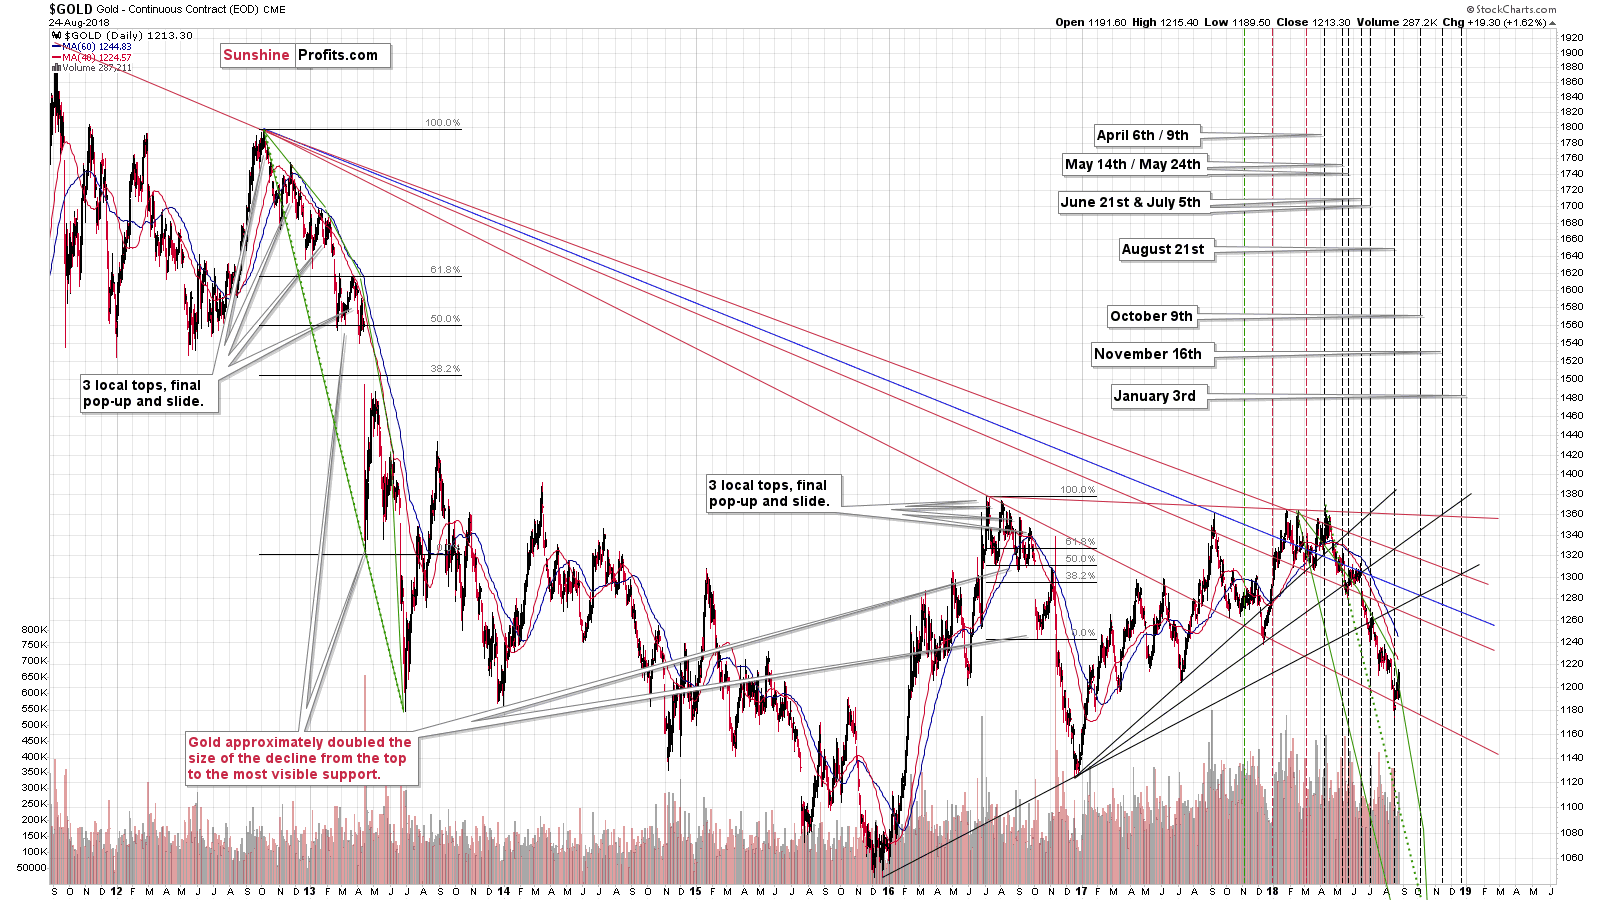
Gold’s short-term upswing followed the triangle vertex reversal, which means that it was nothing extraordinary. Unfortunately, we didn’t see many additional bullish signals and thus trading the upswing was particularly risky, but since the move has already taken place, the decline can now continue. We just wanted to remind you about the existence of the previous reversal to show that there was nothing special about the recent upswing. It’s not the first pause during this decline, but it may very well be the last before we see a huge, volatile, April-2013-style price drop.
Silver’s Correction
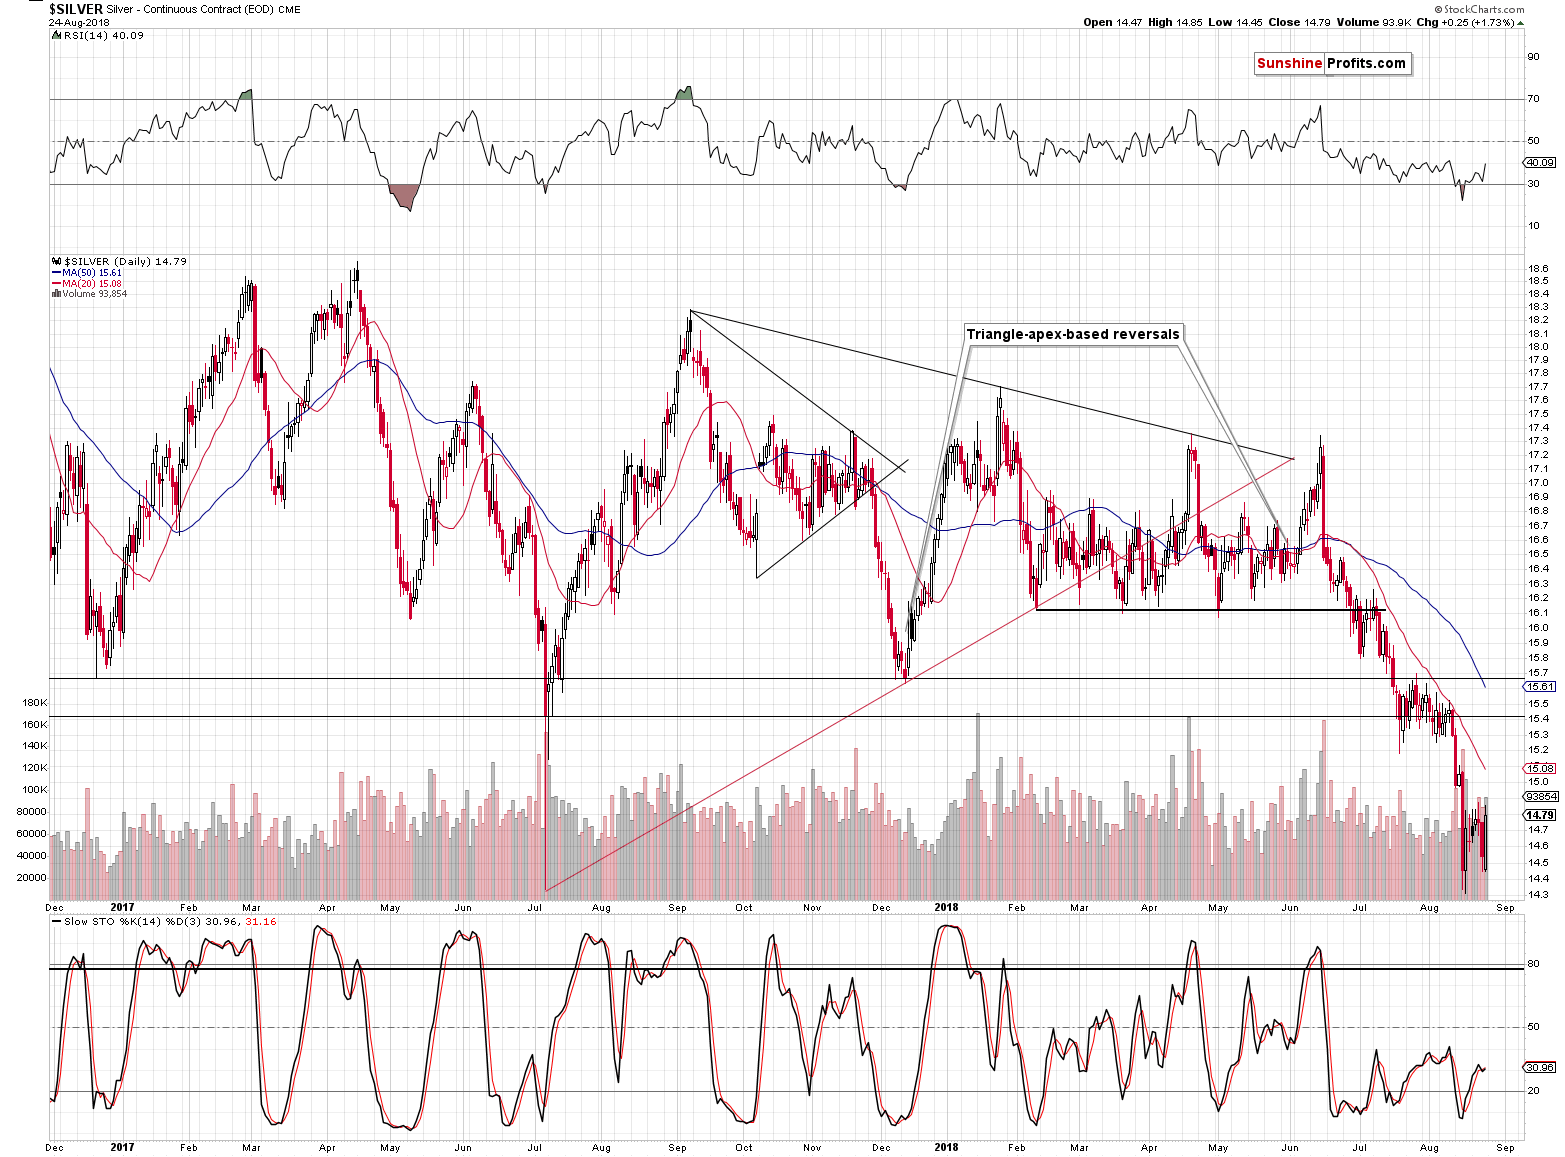
Silver didn’t move to new short-term intraday highs, so from the technical point of view, nothing changed. Silver paused after a very sharp decline and since it didn’t move back above the previously broken support, the implications remain bearish.
Silver didn’t outperform gold, but while silver’s short-term outperformance would serve as a bearish sign, the lack of it is not a bullish sign – it’s currently the normal course of action given the situation in the gold to silver ratio. We discussed the latter in detail in our previous Alert, and these comments remain up-to-date.
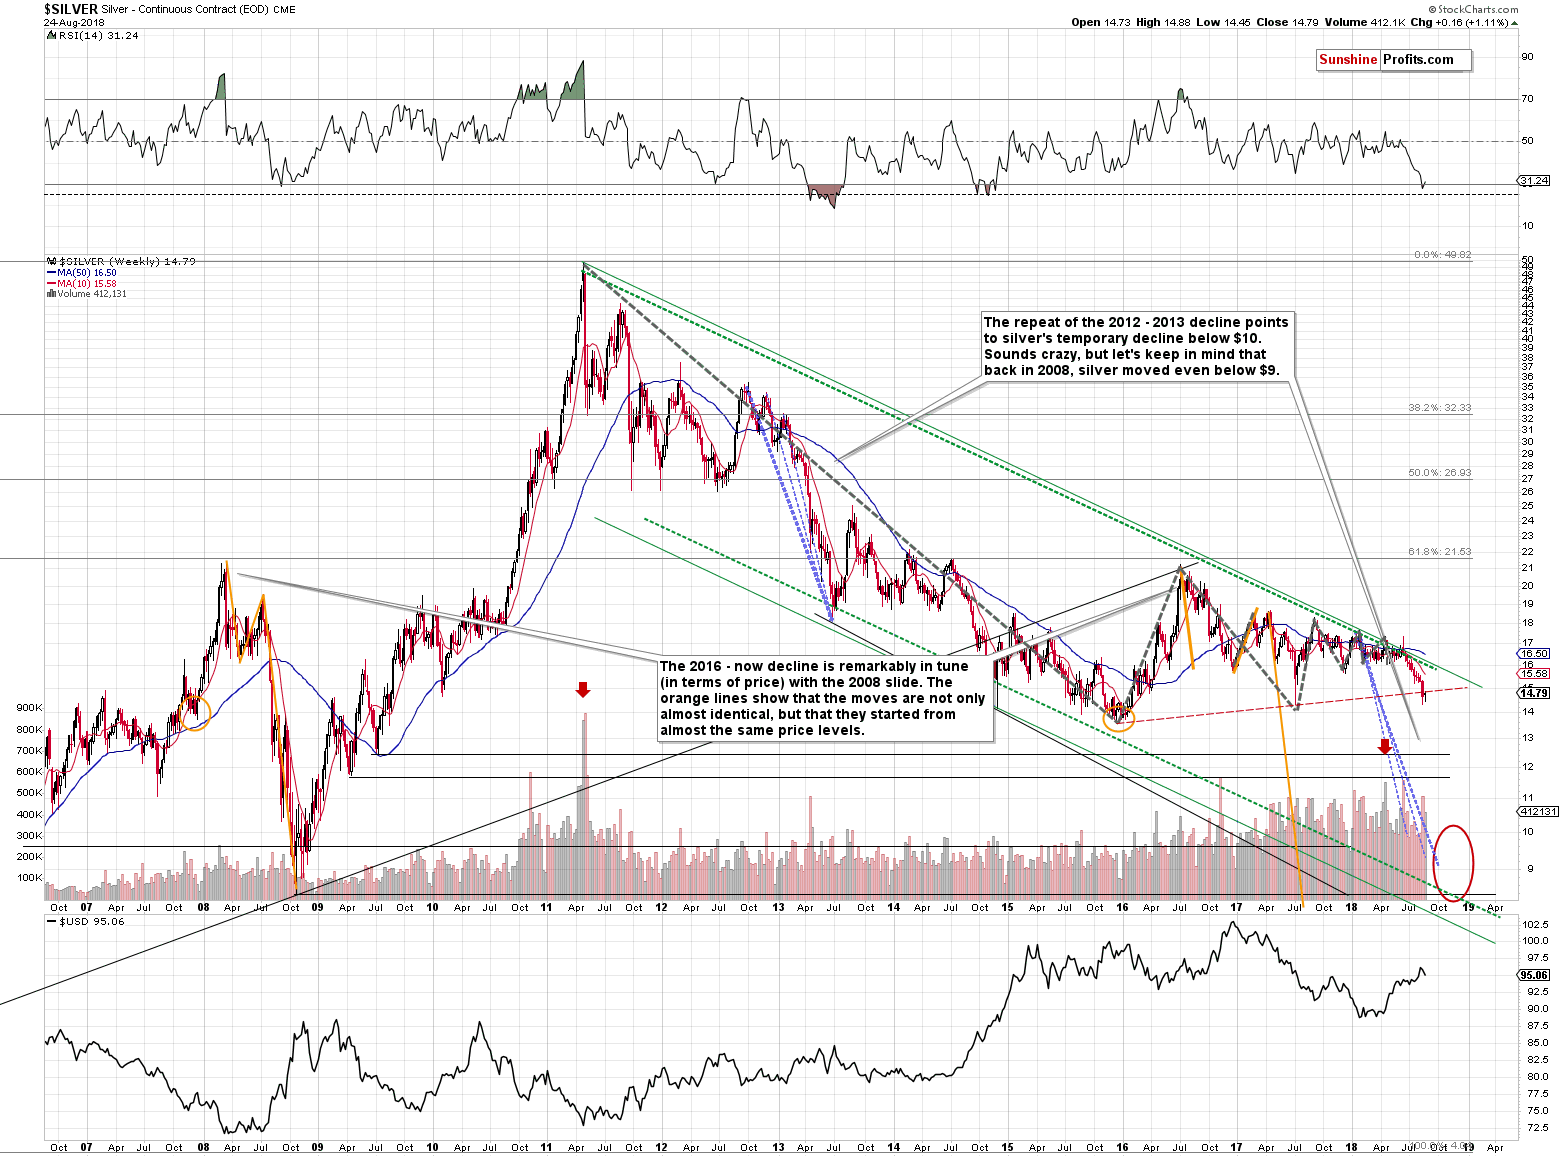
On the long-term silver chart, we can see that silver moved higher last week (by only $0.16, but still), but that wasn’t enough for the white metal to come back above the rising red resistance line based on the 2015 and 2017 bottoms. The implications of the breakdown remain in place and are strongly bearish.
Platinum’s Breakdown
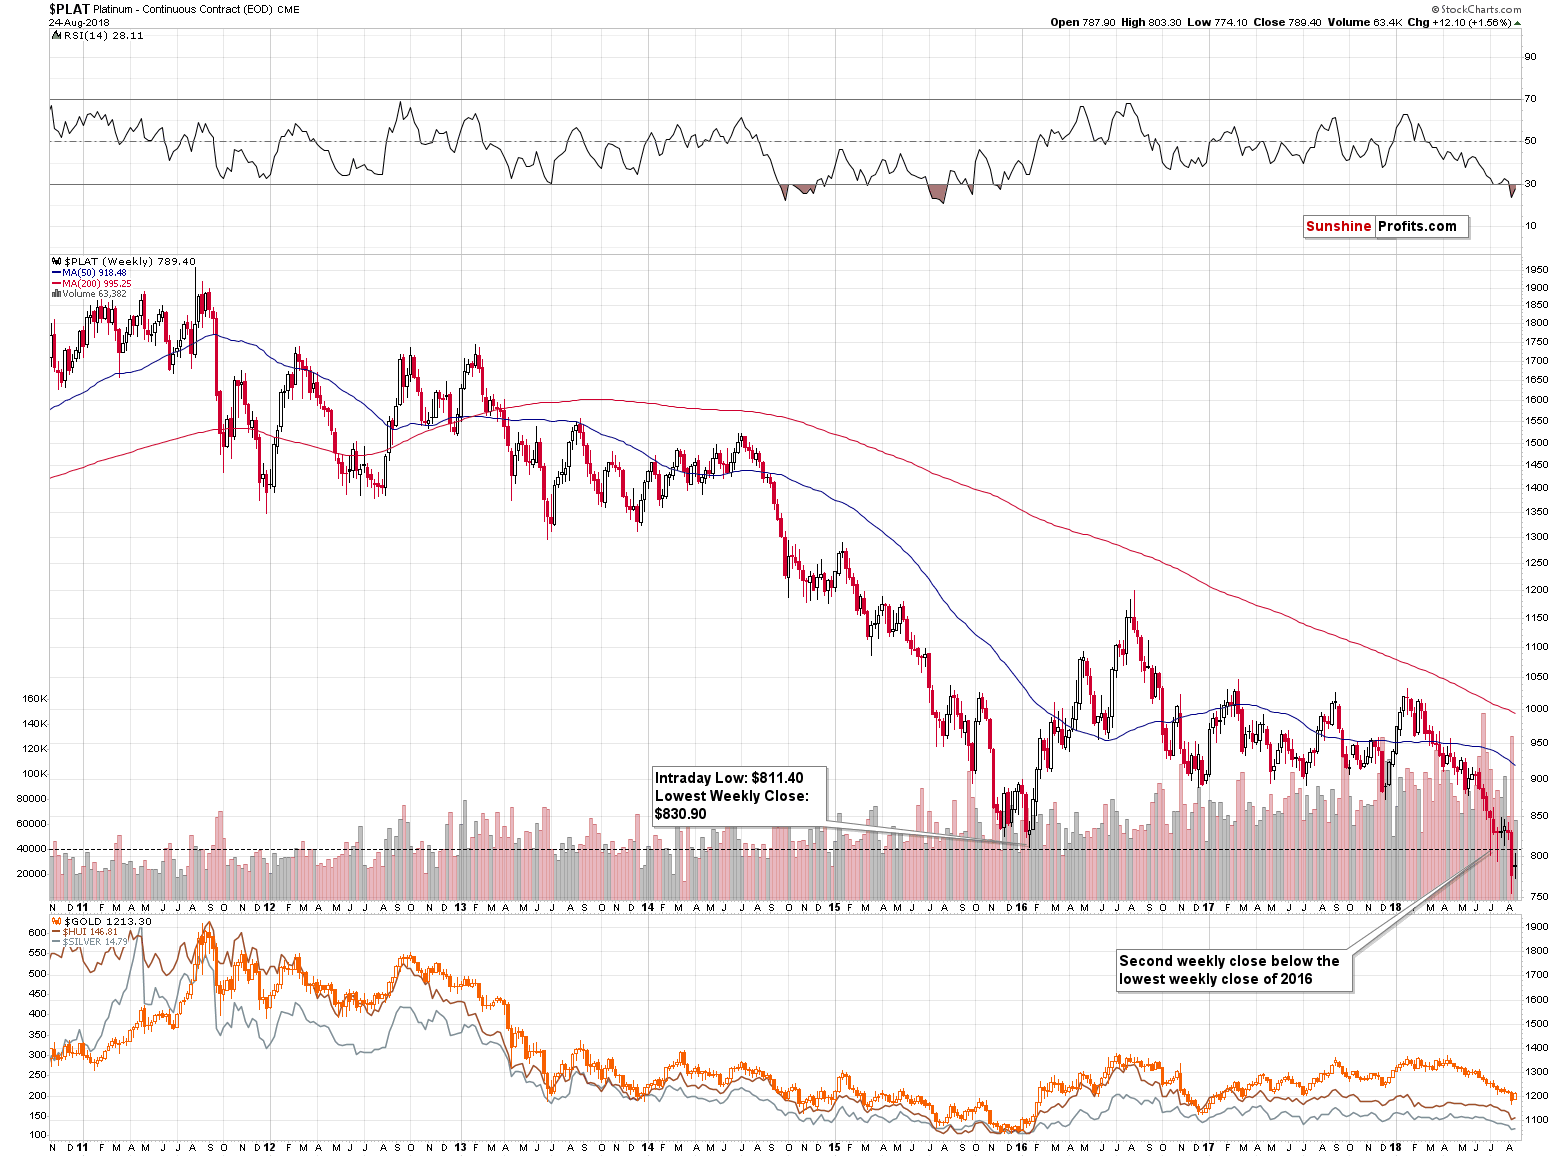
Another white metal – platinum – has just confirmed a breakdown below the 2015 lows in terms of weekly closing prices. Well, almost, because it would be best to have 3 weekly closes below a certain level, but since platinum closed below the 2015 low for many days, it seems that we can already say that the move is confirmed. The implications are clearly bearish for the platinum market, and to some extent to the rest of the precious metals sector as well, as the short-term moves tend to be aligned throughout the sector.
Mining Stocks’ Performance
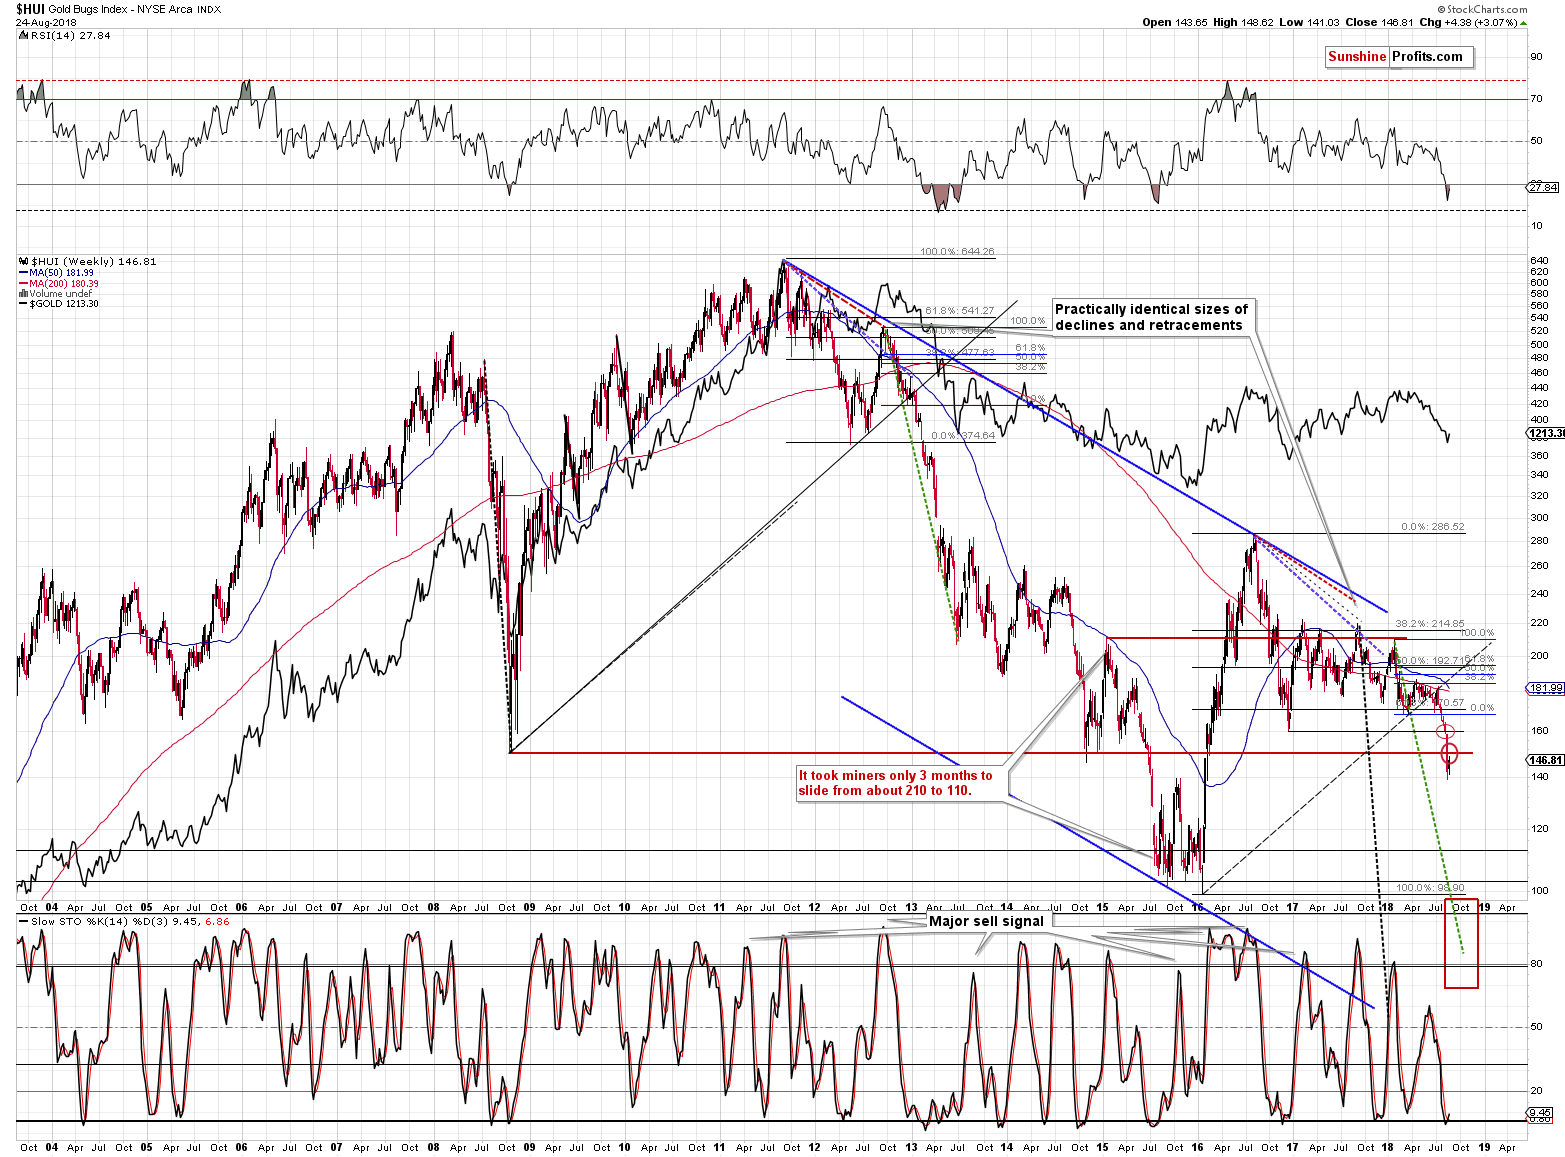
From the long-term point of view, nothing really changed. The HUI Index – proxy for gold stocks – is taking a breather after a volatile decline and a breakdown below the 2008 bottom. Gold rallied visibly last week, but mining stocks moved only a bit higher, thus once again indicating that what we saw was not the start of a new powerful upleg, but rather just a pause. Gold stocks had a good reason to rally and invalidate the previous breakdown but they didn’t manage to do it. The implications are bearish.
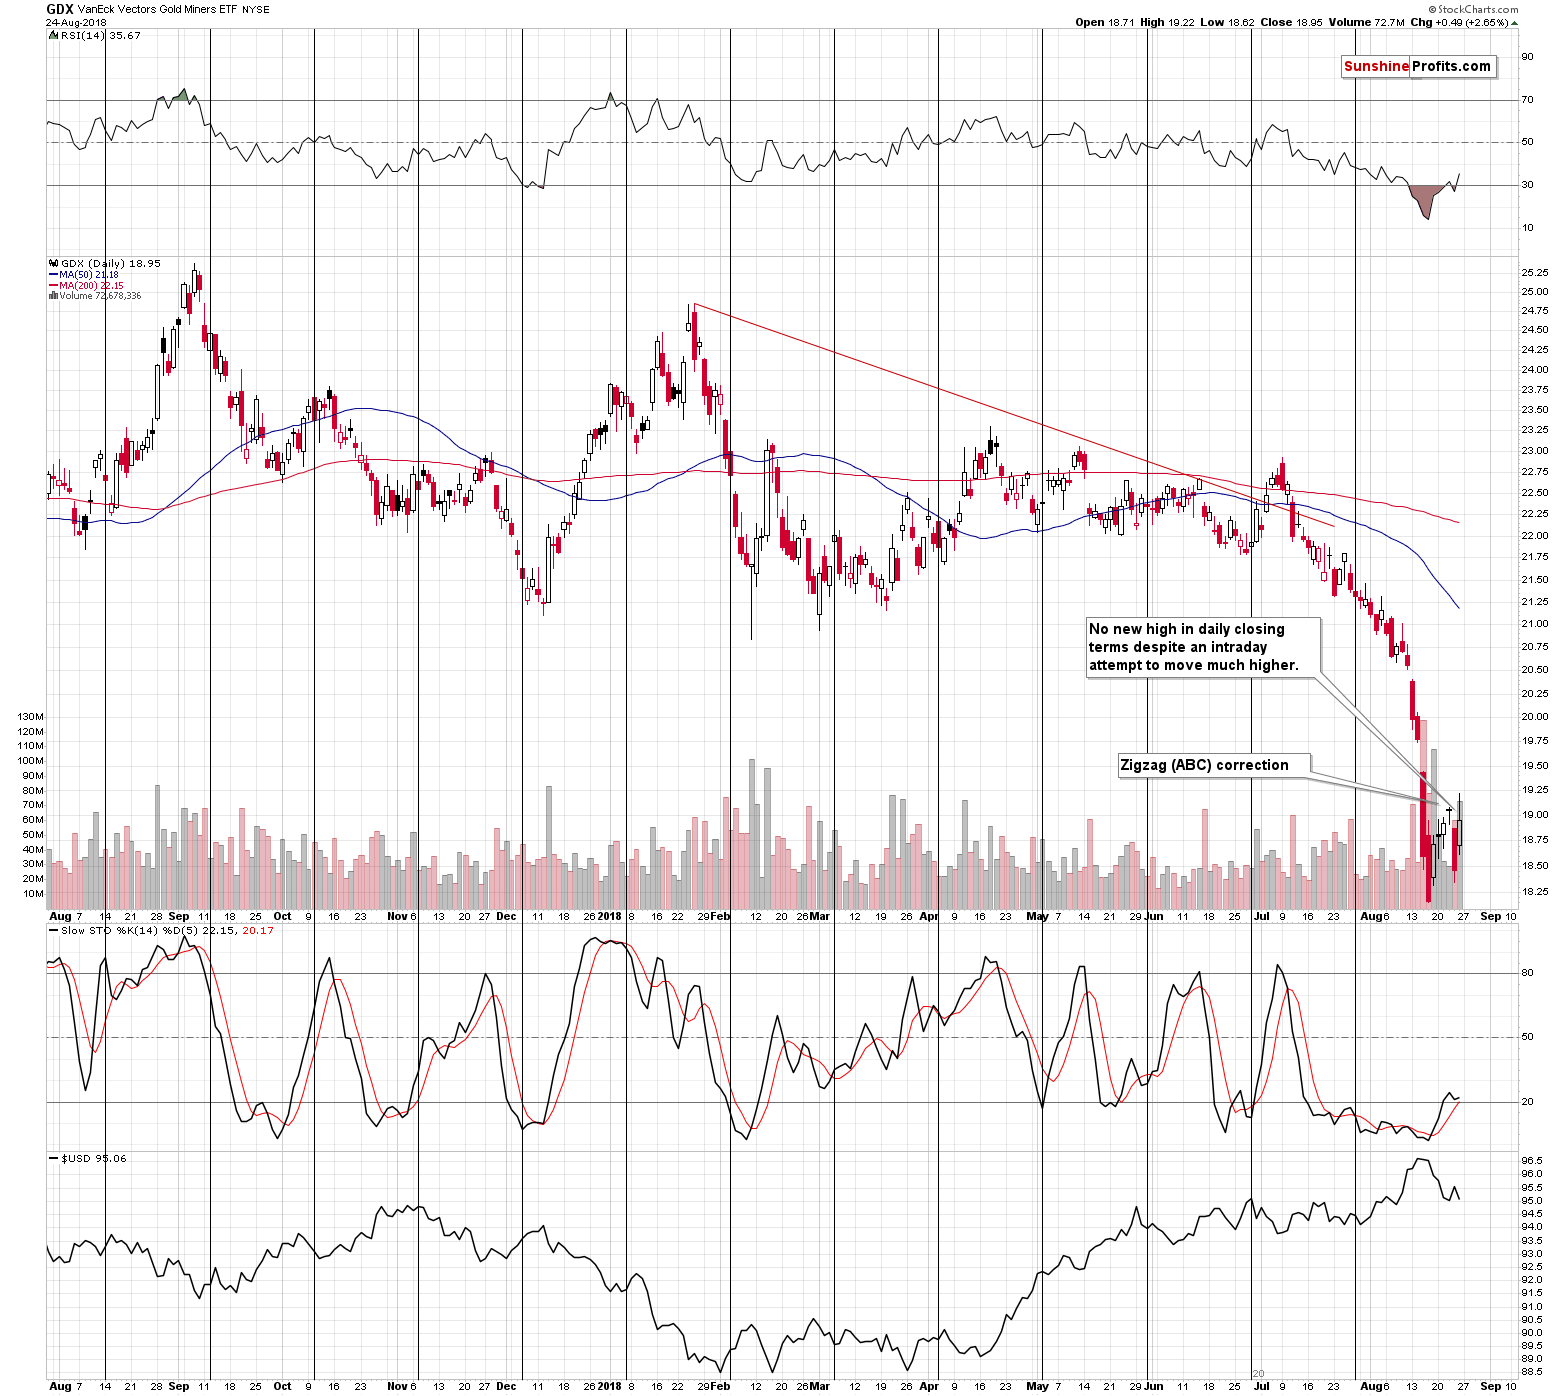
From the short-term point of view, we see that the GDX didn’t manage to close the day above Wednesday’s high despite the intraday attempt. It’s a subtle sign that the buying power is drying up for the miners and yet another confirmation of the miners’ relative (to gold) weakness. Again, if it was the start of a new powerful rally, the mining stocks would be very likely to soar and outperform. We are seeing the exact opposite, which suggests that the next big move will be to the downside.
USD Index – Reverse H&S Remains in Place
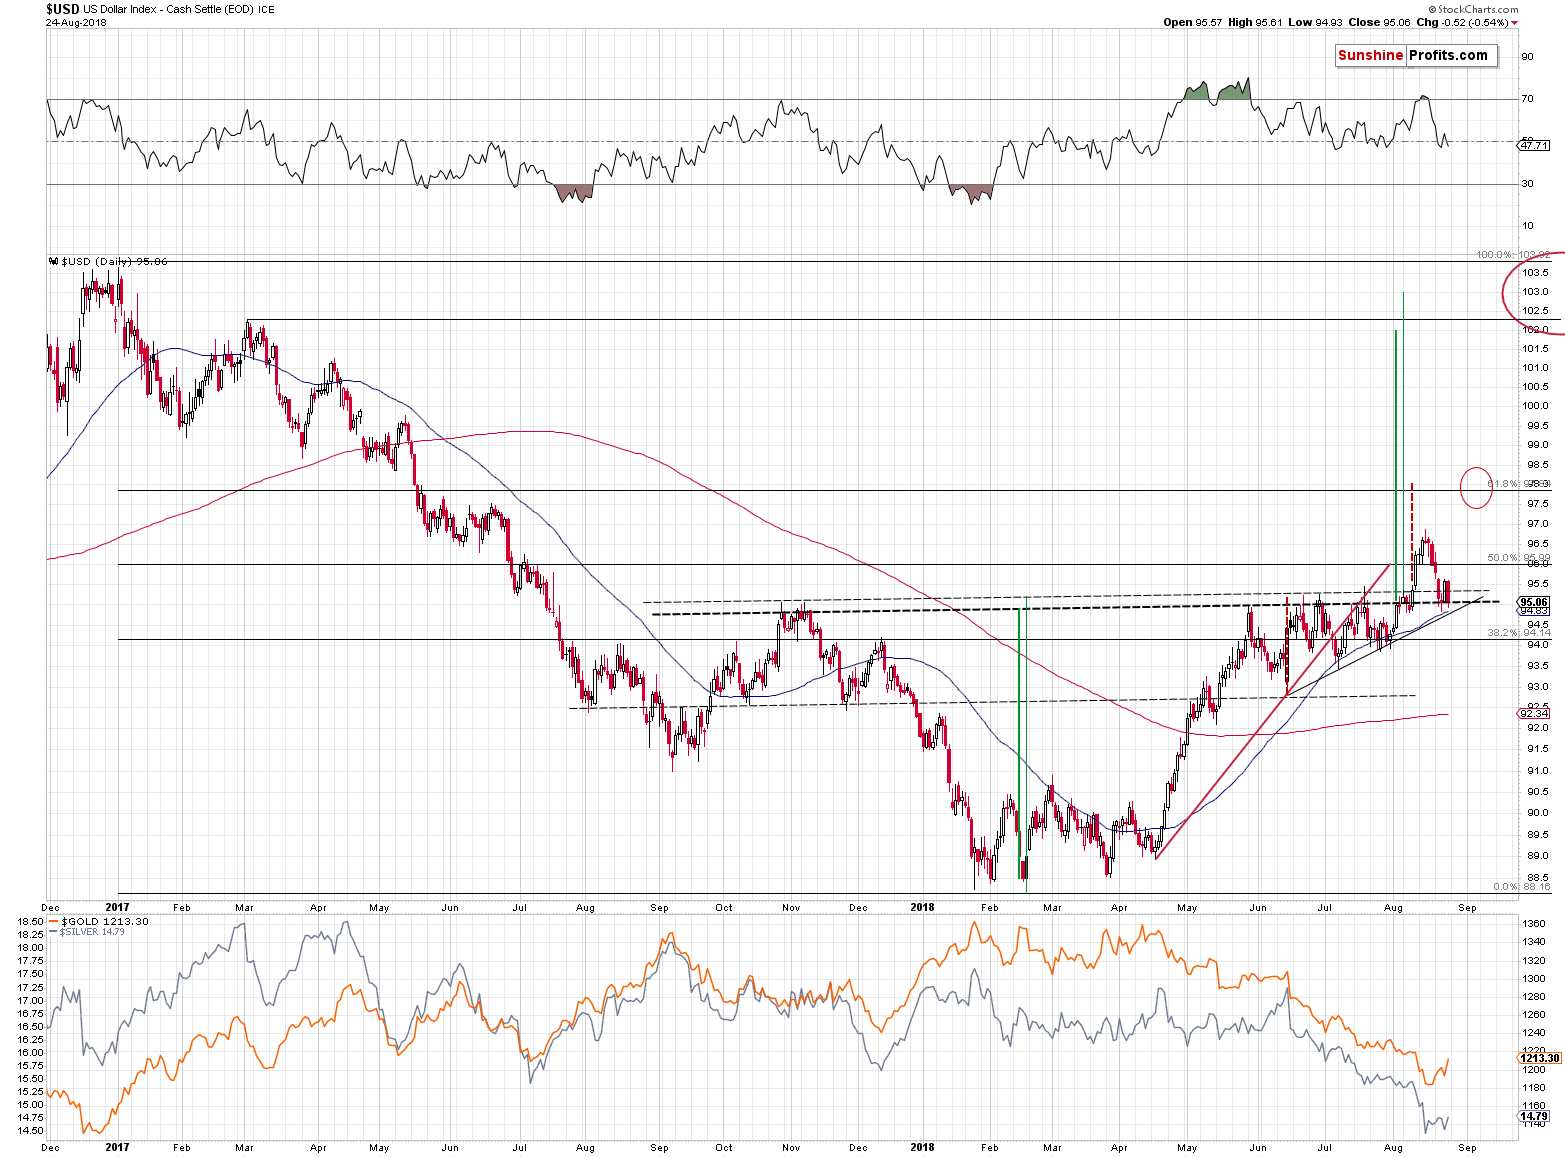
The most important thing about Friday’s price move is what didn’t happen. The USD Index moved lower, testing its early August lows (note how far the mining stocks are from their early August highs), but it didn’t close below the neck level of the reverse head-and-shoulders pattern.
That’s much more important than the daily decline itself, because the reverse head-and-shoulders pattern is what’s likely to determine the next big move in the USDX. Since the pattern was already confirmed by more than 3 daily closes above the neck level and the index is now verifying it once again by moving back to the neck level it tells us 2 things:
- The very bullish outlook remains in place
- The short-term downside is most likely very limited.
If the USD Index had broken visibly below the neck level and closed well below it, then we would say that the outlook for the short term had changed. But, that’s now what happened on Friday. The reverse head-and-shoulders pattern remains in place and so do its implications. They are very bullish for the USDX and very bearish for the precious metals sector.
Before summarizing, we would like to discuss the situation that’s featured by the latest gold CoT report.
Gold CoT – Really So Bullish?
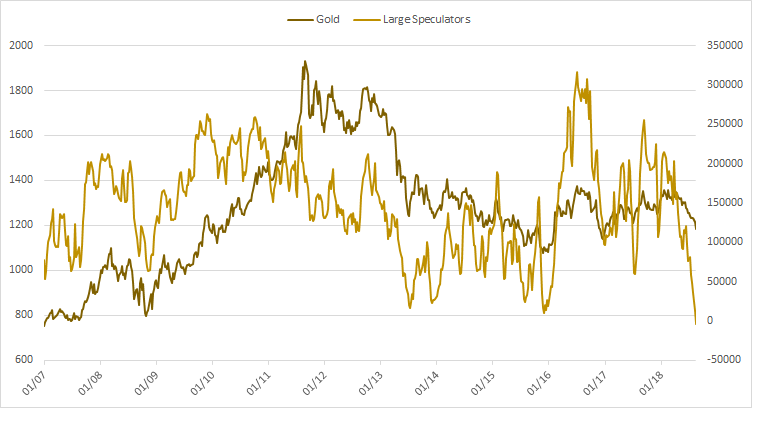
At the first sight, the implications of the above chart appear extremely bullish. The Large Speculators’ positions dropped below the levels that we saw at the 2013 bottom and at the 2015 bottom. Consequently, the above chart seems to be indicating that a major reversal from here is practically imminent.
This is generally not the case. The reversal is not imminent as there are several analytical problems with acting on the CoT numbers. We have outlined them in detail last month and practically everything that we wrote then remains up-to-date.
In particular, the part in which we quote our March 26, 2018 comments on silver CoT numbers are up-to-date (please note that silver is about $2 lower than when we wrote about the supposedly bullish silver CoT numbers). We will quote these comments and adjust them to fit the above gold CoT picture:
Before moving to mining stocks, we would like to reply to a few questions that we just received. Every now and then we are requested to comment on the CoT reports as they continue to be viewed as a very important tool in determining precious metals prices. Just as often, we explain that in our opinion, the usefulness of these reports is overestimated as there are many other indicators for PM prices that appear more useful in determining the precious metals’ direction, for instance the RSI.
A good indicator should have a trading range that’s rather stable and signals that are followed by similar action. The former is mostly missing, and the latter is not coherent.
Let’s take the gold CoT as an example and let’s use Large Speculators as a proxy for the entire report’s data.
Let’s start with the big picture, so that we can determine the buy and sell zones.
What was the buy zone? Based on the 2007 – 2012 data, one might think that it’s the level of 50,000 contracts as that was when gold’s price reversed. But no – this level didn’t stop gold in 2013 and in the following years. So, maybe the level close to 0 is the true support? That’s interesting, but the 2015 bottom took place on a lower position number than the 2013 bottom. The difference was not significant, but it was once again lower. If the important bottoms are being formed at lower levels in each case, then why should we expect the current reading to be the final bottom already?
Because the December 2015 bottom took place at the similar number of positions as the mid-2013 bottom? That’s just one similarity over more than 10 years of data – it’s not even close to being reliable. The previous bottoms (2007 and 2008) took place at much higher numbers of positions, so why shouldn’t this bottom take place at a much smaller (i.e. more negative) number of positions.
The same issue concerns finding the appropriate sell signal. In 2016 the number of Large Speculators’ positions moved to the previous long-term highs during the initial top, not at the final top for the 2016 rally. In other words, after we saw a small breakout above the previous highs in the number of positions, we saw gold take a breather and then move to new yearly highs.
Since we have just seen a breakdown in the number of positions, and gold has corrected a bit, why shouldn’t we expect a move to new lows in gold, based on the above chart? After all, the current situation so far appears to be a mirror image of what happened in 2016.
Overall, there is no clear buy zone for the CoT-based indicator and thus it’s not clear (far from it) that the current move a bit below the previous lows marks a major price bottom.
Moreover, the entire gold-price-to-Large-Speculator-positions link broke down during the biggest upswing of the past decade. The large speculators’ position rallied according to the general “rule” and… More or less in the middle of the upswing, it started to decline. The large speculators’ position became totally useless in predicting the final top for the rally. If that was the case during the key rally of the past decade, then should you really trust this tool when it comes to timing the details of the key decline of the decade? It seems that we are in the early stage of this kind of movement, so should one really bother with looking at the CoT numbers, which could be useful… to a point after which they could provide the opposite of useful signals? The way situation developed in 2010 and 2011 should make you really doubt the CoT numbers’ usefulness in the following months.
Naturally, the entire previous paragraph assumes that the current price regime is different from the previous months’ back-and-forth trading. If only we had seen something suggesting that this situation is different than everything else that we saw in the past 10 years.
Oh wait, we did.
The large speculator’s position just moved below 0, which indicates a new data regime. In other words, we saw a breakdown in the number of positions of large speculators, which suggests that… Well, they will move to a new low – but nobody knows what this low would be. That’s the smaller problem, though.
The bigger problem is that if gold is starting its major – final – decline, then we might not be able to trust the CoT data at all, just like one shouldn’t have trusted it in 2010 and 2011.
Taking both factors into account makes any bullish implications of the above charts rather insignificant at this time.
By the way, did you notice how the analyses that discuss the CoT data are almost always focused on short or (in the best case) medium term? If you feature the big picture, you see how incoherent the implications are and why this tool should be used at best as something that confirms other types of analysis and not on a stand-alone basis.
Important Analyses
Before summarizing, we would like to emphasize that we have recently posted several analyses that are very important and that one should keep in mind, especially in the next several weeks. If you haven’t had the chance of reading them previously, we encourage you to do so today:
- Dear Gold Investor - Letters from 2013 - Analogy to 2013, which should make it easier to trade the upcoming sizable upswing (if enough factors point to it, that is) and to enter the market close to the final bottom.
- Gold to Soar Above $6,000 - discussion of gold’s long-term upside target of $6,000.
- Preparing for THE Bottom in Gold: Part 6 – What to Buy - extremely important analysis of the portfolio structure for the next huge, multi-year rally in the precious metals.
- Gold’s Downside Target, Upcoming Rebound, and Miners’ Buy Plan - details regarding the shape of the following price moves, a buying plan for mining stocks, and a brief discussion of the final price targets for the current decline.
- Key Factors for Gold & Silver Investors - discussion of key, long-term factors that support the bearish outlook for PMs. We are often asked what makes us so bearish – this article is a reply to this question.
We will also be posting another issue of the “Preparing for THE Bottom” series shortly (likely next week). The title will be “Buy-and-hold on Steroids”. Stay tuned.
Summing up, gold’s move higher last week is not as important as it seems at first sight and we can say the same thing about the current gold CoT numbers. It’s much more important that the USD Index didn’t invalidate the reverse head-and-shoulders formation. This means that the pause in precious metals and mining stocks is over or very close to being over and that another big slide is likely just ahead. Based on what we can infer from the 2013 decline, it is the time that we should pay extra attention to the PMs as their decline is likely not close to being over since no meaningful support has been reached in the case of gold and mining stocks.
Also, since the outlook didn’t change, but the price of gold increased, we are moving our stop-loss level for gold higher.
As always, we’ll keep you – our subscribers – informed.
To summarize:
Trading capital (supplementary part of the portfolio; our opinion): Full short positions (250% of the full position) in gold, silver and mining stocks are justified from the risk/reward perspective with the following stop-loss orders and exit profit-take price levels:
- Gold: profit-take exit price: $1,062; stop-loss: $1,231; initial target price for the DGLD ETN: $82.96; stop-loss for the DGLD ETN $52.37
- Silver: profit-take exit price: $12.72; stop-loss: $15.56; initial target price for the DSLV ETN: $46.97; stop-loss for the DSLV ETN $28.87
- Mining stocks (price levels for the GDX ETF): profit-take exit price: $13.12; stop-loss: $20.81; initial target price for the DUST ETF: $80.97; stop-loss for the DUST ETF $30.87
Note: the above is a specific preparation for a possible sudden price drop, it does not reflect the most likely outcome. You will find a more detailed explanation in our August 1 Alert. In case one wants to bet on junior mining stocks’ prices (we do not suggest doing so – we think senior mining stocks are more predictable in the case of short-term trades – if one wants to do it anyway, we provide the details), here are the stop-loss details and target prices:
- GDXJ ETF: profit-take exit price: $17.52; stop-loss: $30.72
- JDST ETF: initial target price: $154.97 stop-loss: $62.78
Long-term capital (core part of the portfolio; our opinion): No positions (in other words: cash)
Insurance capital (core part of the portfolio; our opinion): Full position
Important Details for New Subscribers
Whether you already subscribed or not, we encourage you to find out how to make the most of our alerts and read our replies to the most common alert-and-gold-trading-related-questions.
Please note that the in the trading section we describe the situation for the day that the alert is posted. In other words, it we are writing about a speculative position, it means that it is up-to-date on the day it was posted. We are also featuring the initial target prices, so that you can decide whether keeping a position on a given day is something that is in tune with your approach (some moves are too small for medium-term traders and some might appear too big for day-traders).
Plus, you might want to read why our stop-loss orders are usually relatively far from the current price.
Please note that a full position doesn’t mean using all of the capital for a given trade. You will find details on our thoughts on gold portfolio structuring in the Key Insights section on our website.
As a reminder – “initial target price” means exactly that – an “initial” one, it’s not a price level at which we suggest closing positions. If this becomes the case (like it did in the previous trade) we will refer to these levels as levels of exit orders (exactly as we’ve done previously). Stop-loss levels, however, are naturally not “initial”, but something that, in our opinion, might be entered as an order.
Since it is impossible to synchronize target prices and stop-loss levels for all the ETFs and ETNs with the main markets that we provide these levels for (gold, silver and mining stocks – the GDX ETF), the stop-loss levels and target prices for other ETNs and ETF (among other: UGLD, DGLD, USLV, DSLV, NUGT, DUST, JNUG, JDST) are provided as supplementary, and not as “final”. This means that if a stop-loss or a target level is reached for any of the “additional instruments” (DGLD for instance), but not for the “main instrument” (gold in this case), we will view positions in both gold and DGLD as still open and the stop-loss for DGLD would have to be moved lower. On the other hand, if gold moves to a stop-loss level but DGLD doesn’t, then we will view both positions (in gold and DGLD) as closed. In other words, since it’s not possible to be 100% certain that each related instrument moves to a given level when the underlying instrument does, we can’t provide levels that would be binding. The levels that we do provide are our best estimate of the levels that will correspond to the levels in the underlying assets, but it will be the underlying assets that one will need to focus on regarding the signs pointing to closing a given position or keeping it open. We might adjust the levels in the “additional instruments” without adjusting the levels in the “main instruments”, which will simply mean that we have improved our estimation of these levels, not that we changed our outlook on the markets. We are already working on a tool that would update these levels on a daily basis for the most popular ETFs, ETNs and individual mining stocks.
Our preferred ways to invest in and to trade gold along with the reasoning can be found in the how to buy gold section. Additionally, our preferred ETFs and ETNs can be found in our Gold & Silver ETF Ranking.
As a reminder, Gold & Silver Trading Alerts are posted before or on each trading day (we usually post them before the opening bell, but we don't promise doing that each day). If there's anything urgent, we will send you an additional small alert before posting the main one.
=====
Latest Free Trading Alerts:
Stocks reached the new record high on Friday, as investors' sentiment remained bullish following the recent advance. However, the S&P 500 index continues to trade close to the late January high and the resistance level. So will it continue higher? Or is this a topping pattern before downward reversal?
S&P 500 at New Record, but Still Very Close to January High
=====
Hand-picked precious-metals-related links:
PRECIOUS-Gold slips but stays above $1,200 as dollar firms
Floods in India's Top Buyer May Hit Wedding Season Gold Demand
Hedge Funds Kept Betting Against Gold Even as Prices Began Rally
=====
In other news:
Dollar steady after Powell speech, NAFTA hopes lift Mexican peso
Stocks Climb in Holiday-Hit Trading; Dollar Steady: Markets Wrap
World stocks at highest in over two weeks, China's yuan rallies
Italy Vows to Veto EU Budget After Feeling Shunned by EU
Turkish Lira Tumbles as Volatility Returns After Holiday Week
Oil falls ahead of OPEC+ monitoring committee call
=====
Thank you.
Sincerely,
Przemyslaw Radomski, CFA
Founder, Editor-in-chief, Gold & Silver Fund Manager
Gold & Silver Trading Alerts
Forex Trading Alerts
Oil Investment Updates
Oil Trading Alerts

