

The U.S. stock market indexes gained 0.5-0.9% on Friday extending their short-term uptrend, as investors' sentiment remained bullish. The S&P 500 index has reached yet another new record high at the level of 2,876.16. The Dow Jones Industrial Average gained 0.5% and the technology Nasdaq Composite gained 0.9% on Friday.
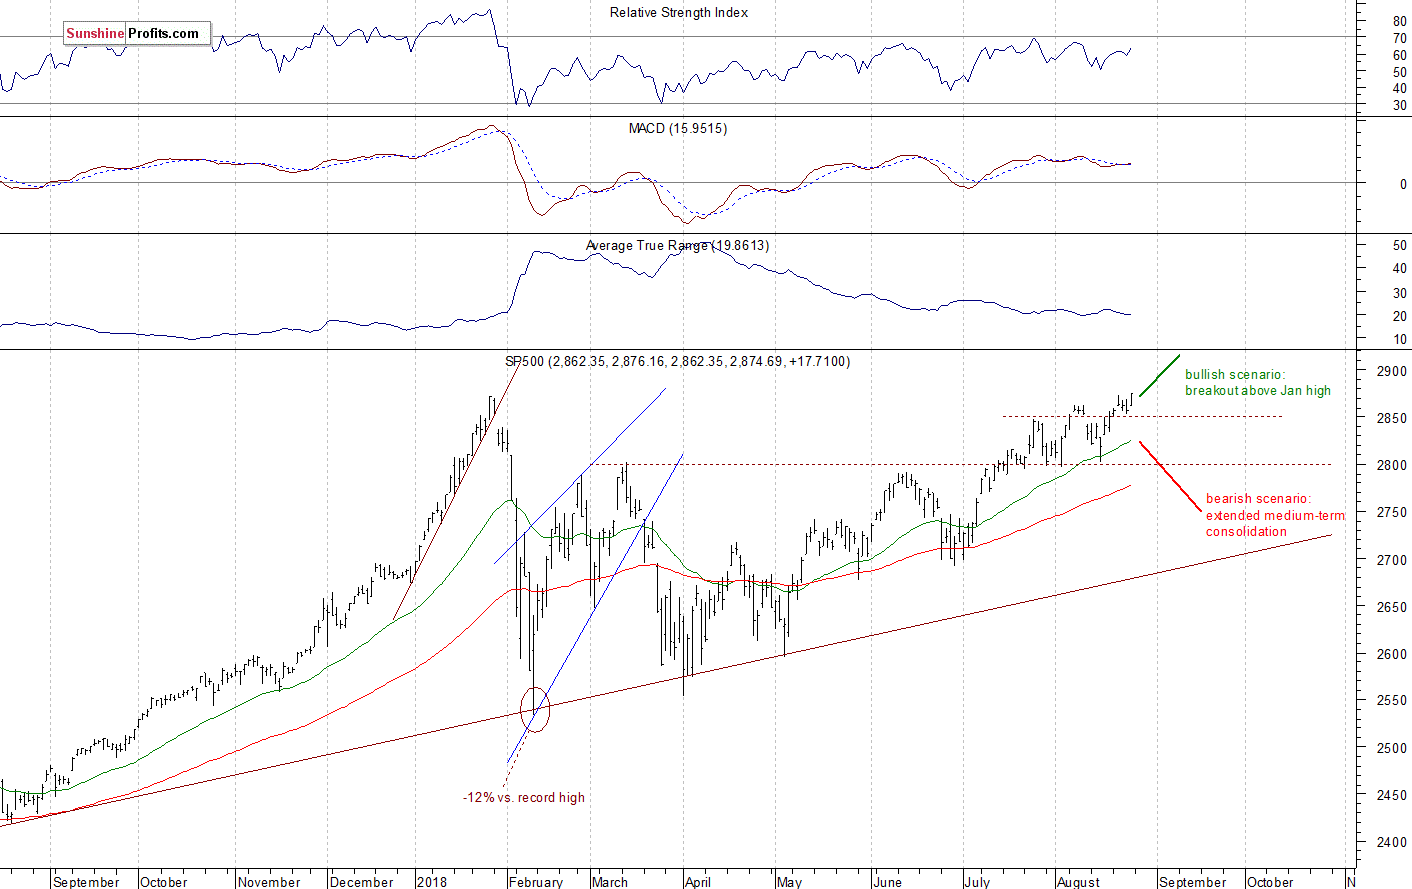
The nearest important level of support of the S&P 500 index is now at around 2,860-2,865, marked by the previous short-term resistance level. The next support level is at 2,850. The support level is also at 2,830-2,835, marked by some short-term local lows. On the other hand, a potential resistance level is at around 2,900.
The broad stock market reached the new record high on Friday, as it broke slightly above its Tuesday's high of around 2,873. Will the S&P 500 index continue higher? There are still two possible medium-term scenarios - bearish that will lead us towards the February low again, and the bullish one - breakout higher towards 3,000 mark. The latter one got very real recently:
Positive Expectations Again
The index futures contracts trade 0.3% above their Friday's closing prices. So expectations before the opening of today's trading session are positive. The European stock market indexes have gained 0.2-0.6% so far. There will be no new important economic data announcements today. The broad stock market will probably open higher today. Then we may see some more short-term fluctuations following the recent run-up. There have been no confirmed negative signals so far. However, we still can see some selling pressure at the medium-term resistance level.
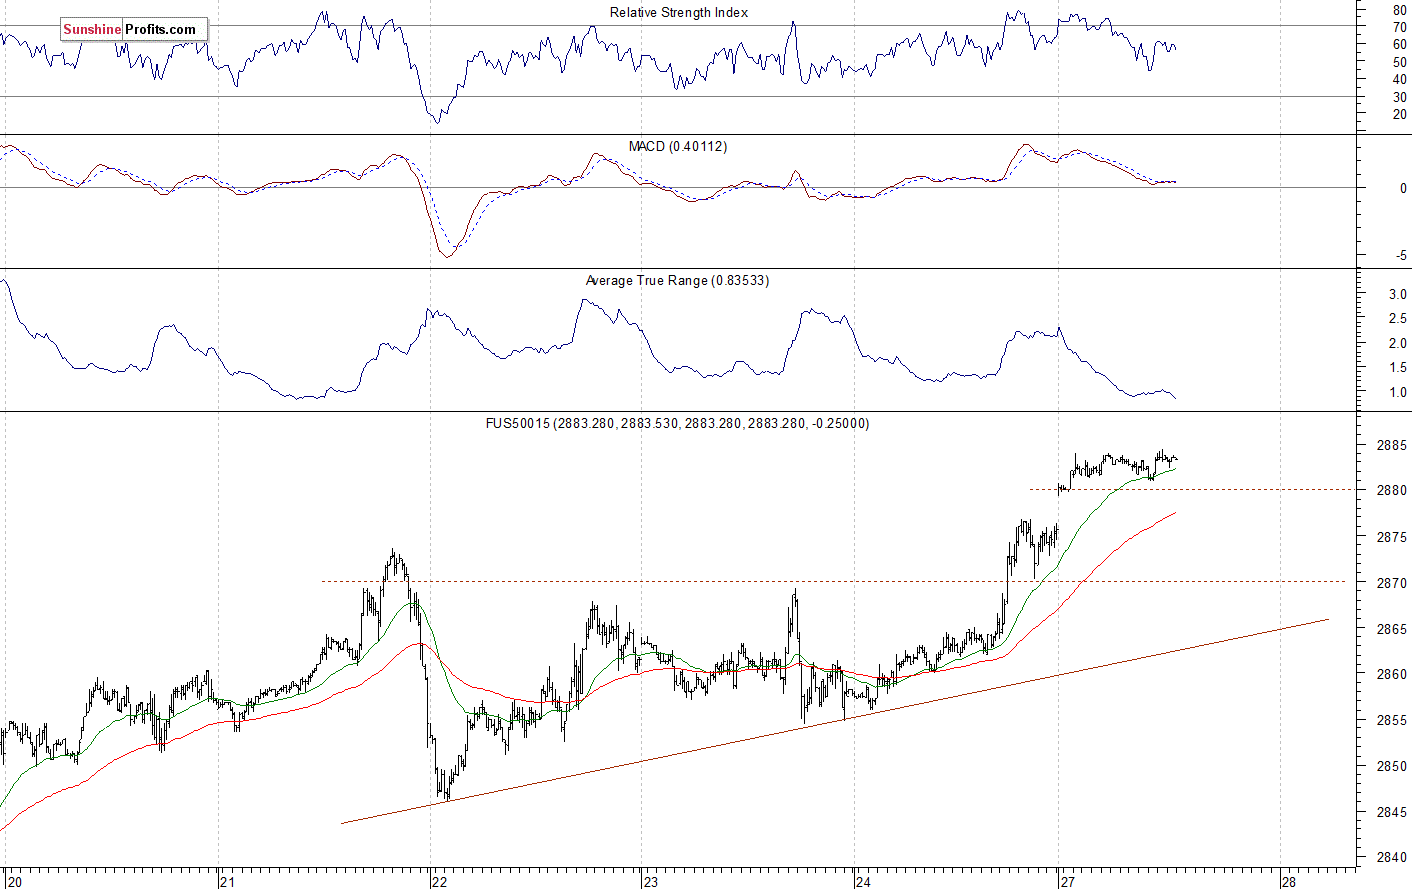
The S&P 500 futures contract trades within an intraday consolidation following its overnight advance. The market trades close to the new record high above the level of 2,880. The nearest important level of support is at around 2,870-2,875, marked by some recent fluctuations. The support level is also at 2,865, marked by the recent local highs. The futures contract accelerated its short-term uptrend this morning, as we can see on the 15-minute chart:
Nasdaq Also at New Record High
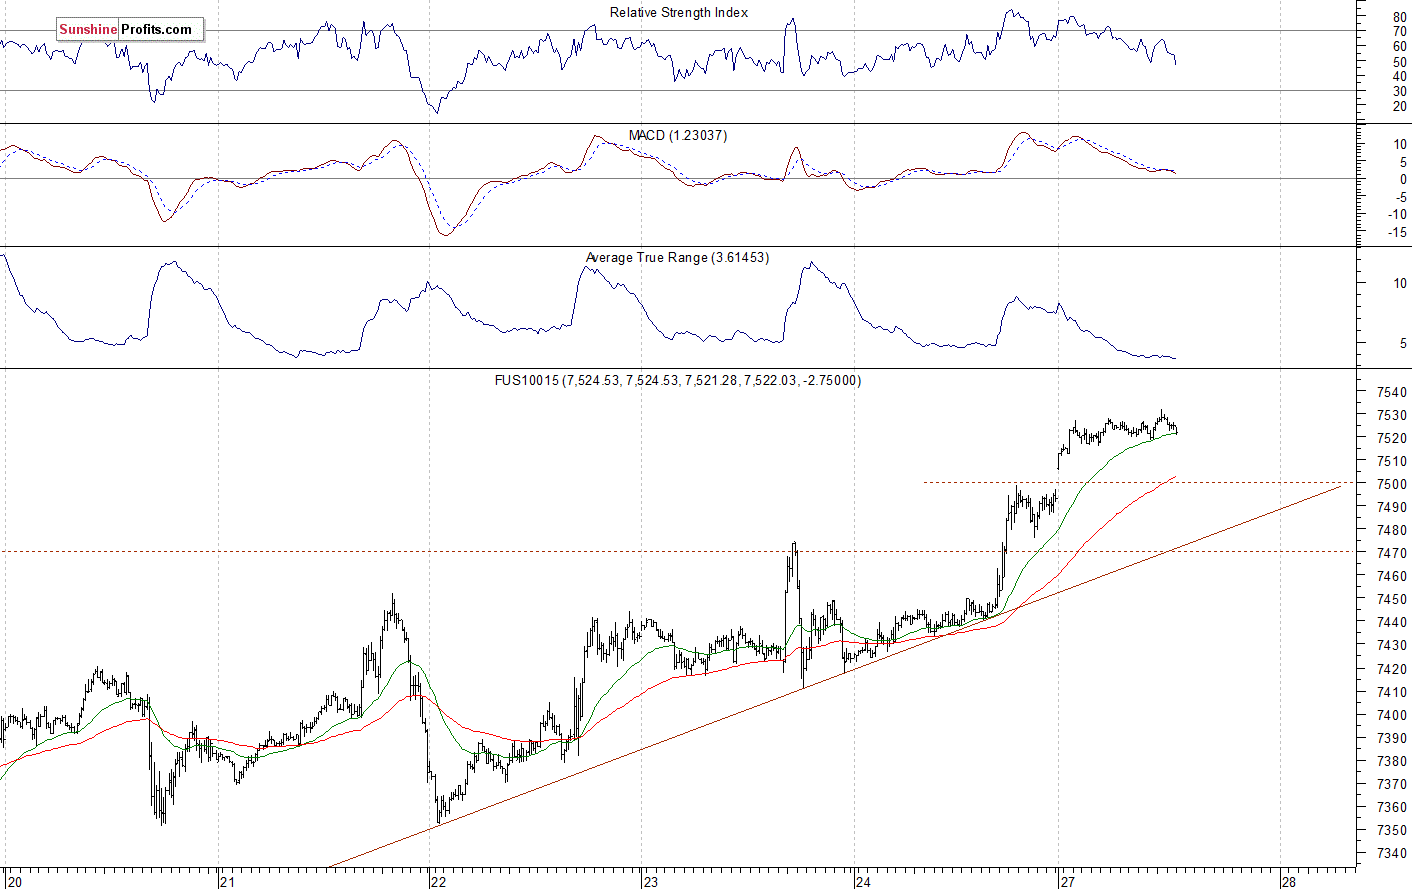
The technology Nasdaq 100 futures contract follows a similar path, as it trades within an intraday consolidation. The market trades close to its new record high above the level of 7,530. On the other hand, the nearest important level of support is at around 7,480-7,500, marked by the recent level of resistance. The Nasdaq futures contract extends its advance above the level of 7,500, as the 15-minute chart shows:
Apple, Amazon Going Sideways
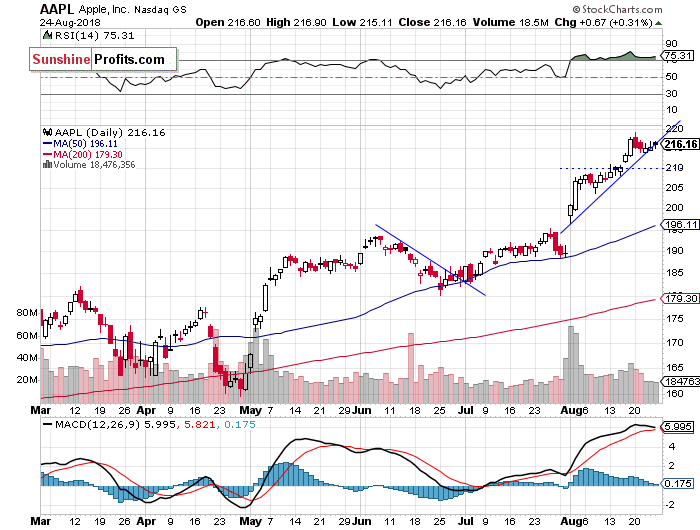
Let's take a look at Apple, Inc. stock (AAPL) daily chart (chart courtesy of http://stockcharts.com). It reached the new record high at the level of $219.18 a week ago on Monday. Since then it fluctuated. There have been no confirmed negative signals so far. However, we may see a downward correction at some point. The nearest important level of support is now at $205-210, marked by the recent consolidation. The price is at its upward trend line:
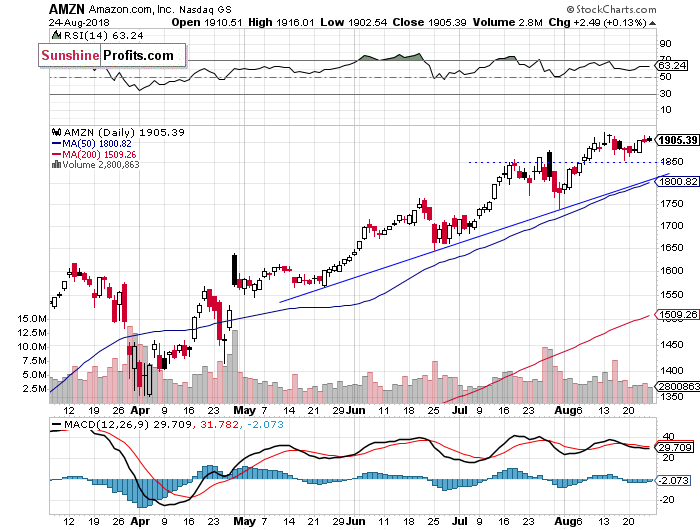
Now let's take a look at Amazon.com, Inc. stock (AMZN) daily chart. It reached the new record high in the early August at the level of $1,925.00. Since then it traded within a short-term consolidation. The stock got closer to the record high last week. The nearest important level of resistance remains at around $1,925. On the other hand, support level is at $1,850:
Dow Jones at the Local High Again
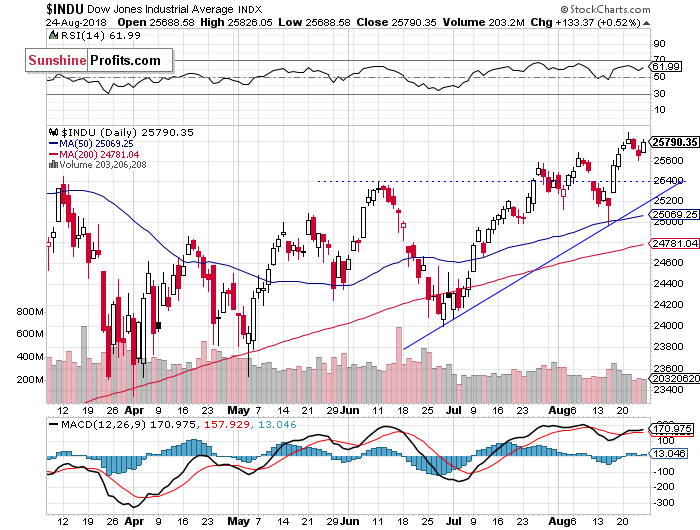
The Dow Jones Industrial Average reached the new local high on Tuesday a week ago, as it extended its last week's rally following breaking above its early August local high. The blue-chip stocks' gauge remains close to that local high. The nearest important level of resistance remains at around 25,900. There have been no confirmed negative signals so far:
The S&P 500 index reached the new record high of 2,876.16 on Friday. However, the broad stock market continues to trade relatively close to its late January high of around 2,873. Will it continue towards 3,000 mark? We may see some more short-term uncertainty along the medium-term resistance level.
Concluding, the broad stock market will likely open higher today. But then we may see some more short-term uncertainty, as stocks fluctuate along their medium-term resistance level marked by the late January high. There have been no confirmed negative signals so far.
If you enjoyed the above analysis and would like to receive free follow-ups, we encourage you to sign up for our daily newsletter – it’s free and if you don’t like it, you can unsubscribe with just 2 clicks. If you sign up today, you’ll also get 7 days of free access to our premium daily Gold & Silver Trading Alerts. Sign up today!
Thank you.
Paul Rejczak
Stock Trading Strategist
Stock Trading Alerts
Sunshine Profits - Free Stock Market Analysis
