

Briefly: in our opinion, full (250% of the regular size of the position) speculative short positions in gold, silver and mining stocks are justified from the risk/reward perspective at the moment of publishing this alert.
There were only a few analyses that we started with a quote, and there were even fewer that we began by quoting a song. It may even be the first one ever.
I am the storm and I am the wonder
And the flashlights, nightmares
And sudden explosions
- Royksopp, “What Else Is There”
And you will have all the above in September. At least if you’re going to pay attention to gold, silver and mining stocks.
We warned that the key factors had been in place for a long time and those who were willing to listen, have already positioned themselves accordingly. The multiple bearish confirmations, like the steady rise in the gold to silver ratio and the underperformance of mining stocks, have been repeated over and over again. And it looks like PMs are ready to take the main dive. Yes gold will very likely soar to new highs, but not before an epic decline. Are you prepared?
In the early part of the previous week, the USD Index moved lower, while the precious metals sector moved higher. But, right before the end of the week, we saw that it was just a trap for those who really wanted to see gold rallying instead of objectively observing what was going on and unemotionally acting on the observations. Let’s take a look at the facts, starting with the USD Index chart (chart courtesy of http://stockcharts.com).
Breakdown? You Mean Breakout?
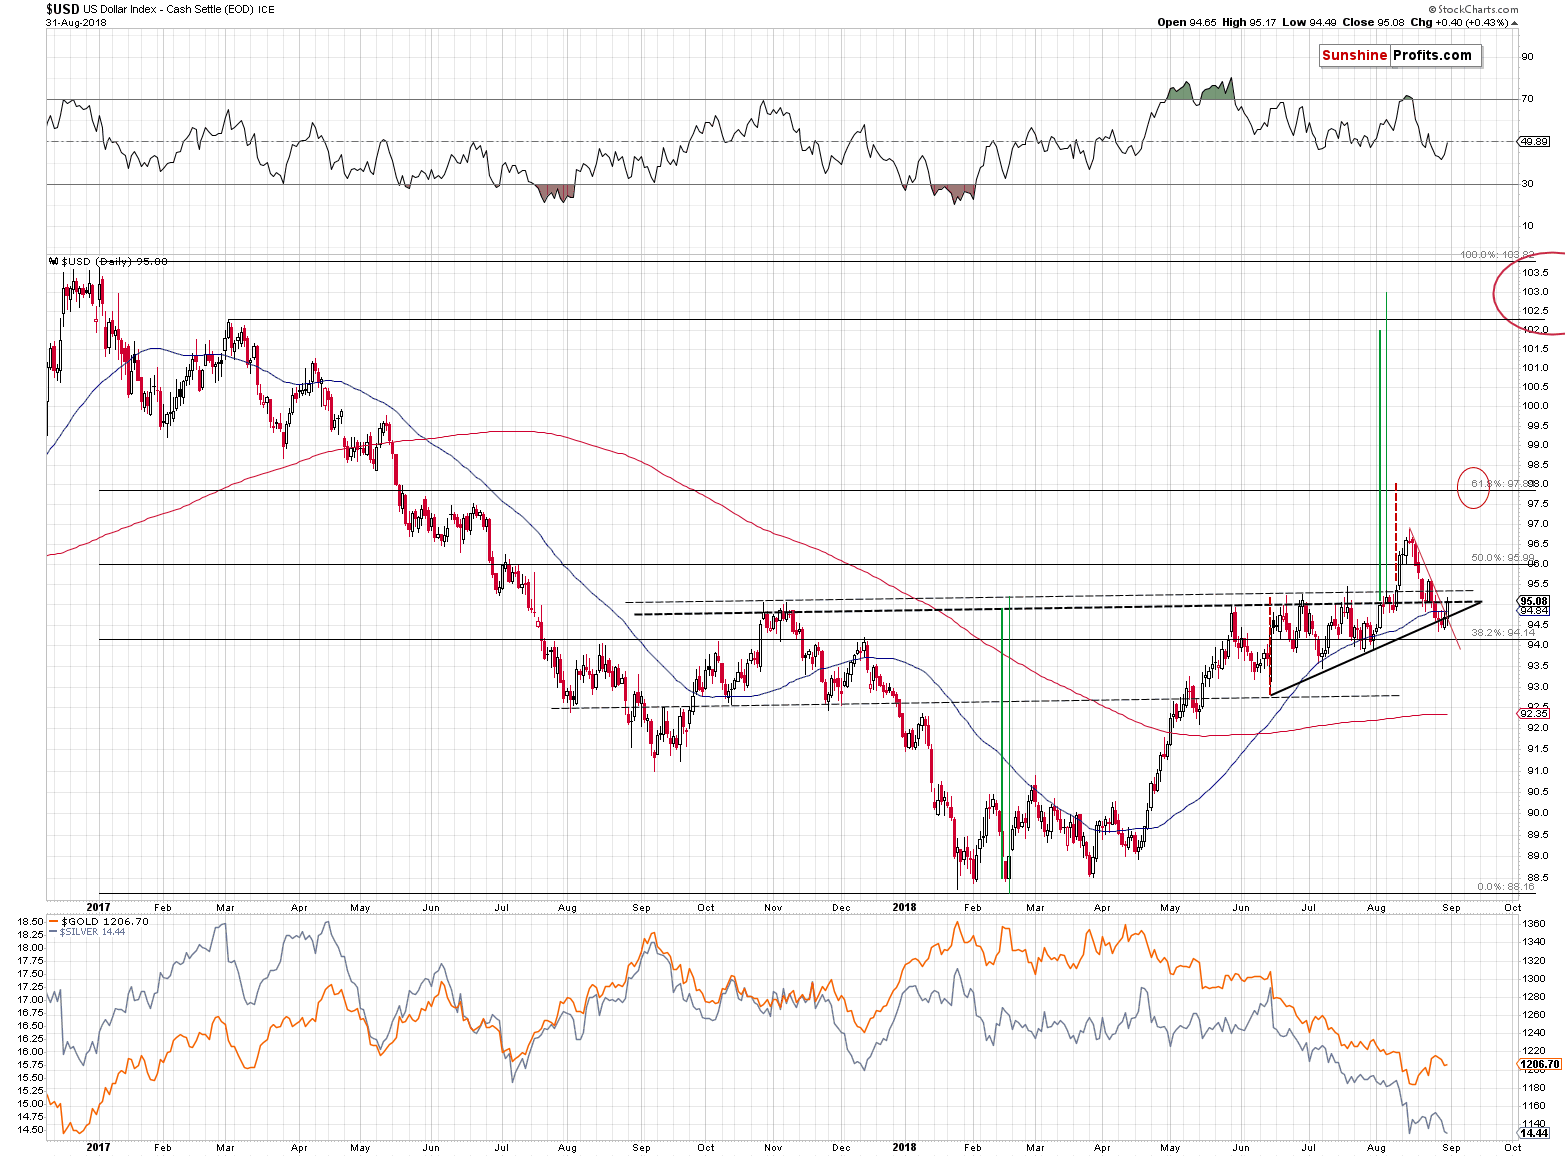
The objective fact is that the USD Index closed the week above 95, so from the weekly point of view there was no decline. Despite the early decline, overall, the USDX moved higher by 0.02 last week. And it never really invalidated the breakout above the neck level of the reverse head-and-shoulders pattern.
Moreover, from the very short-term point of view, we just saw a breakout above the declining red resistance line and the USD rally continues in today’s pre-market trading (95.55 at the moment of writing these words). The outlook for the USD Index remains very bullish, not only from the long-term point of view, but also due to medium- and short-term signals.
Before moving further, we would like to briefly discuss one thing that is often misunderstood when discussing the outlook for the USD Index. It is often said that the USD Index can’t rally, because of all the problems in the U.S. economy, the ballooning debt, etc. The problems are real, but they – alone – are not enough for the USD to either rally or decline.
What?! You’re saying that the key fundamental information is irrelevant?!
No. That’s not what we are saying. We are saying that the USD Index is… and index. Precisely, it’s an average of the currency exchange rates. The EUR/USD exchange rate has the biggest (over 50%) weight in the index and the USD/JPY exchange rate has the second biggest weight. This means that for the USD Index to rally, the dollar doesn’t have to be perfect. It just has to be a better option than the euro and the yen.
There is a saying that the currencies do not float, but sink at different rates (called inflation). If the non-USD currencies sink faster, the exchange rate mechanisms will cause the USD Index to rally.
The analysts that take a big magnifying glass when discussing what’s wrong with the U.S. economy, but that at the same time entirely ignore the situation in Europe and Japan are entirely missing the point. The situation in the U.S. can be very bad, the debt could be astronomical, but if the situation is even worse in the other major economies (especially in the EU and in Japan), the USD Index is still likely to rally.
So, the next time someone tells you how bad the outlook for the USD Index is, don’t ask them why they think the situation in the US economy is bad. Ask them why they think things are so much better for the EU and Japan. Getting “huh?” as a reply is a good indication that you might want to consider different sources of information.
Having said that, let’s move to the charts and their implications for the following days and weeks.
Gold’s Flag Is Over
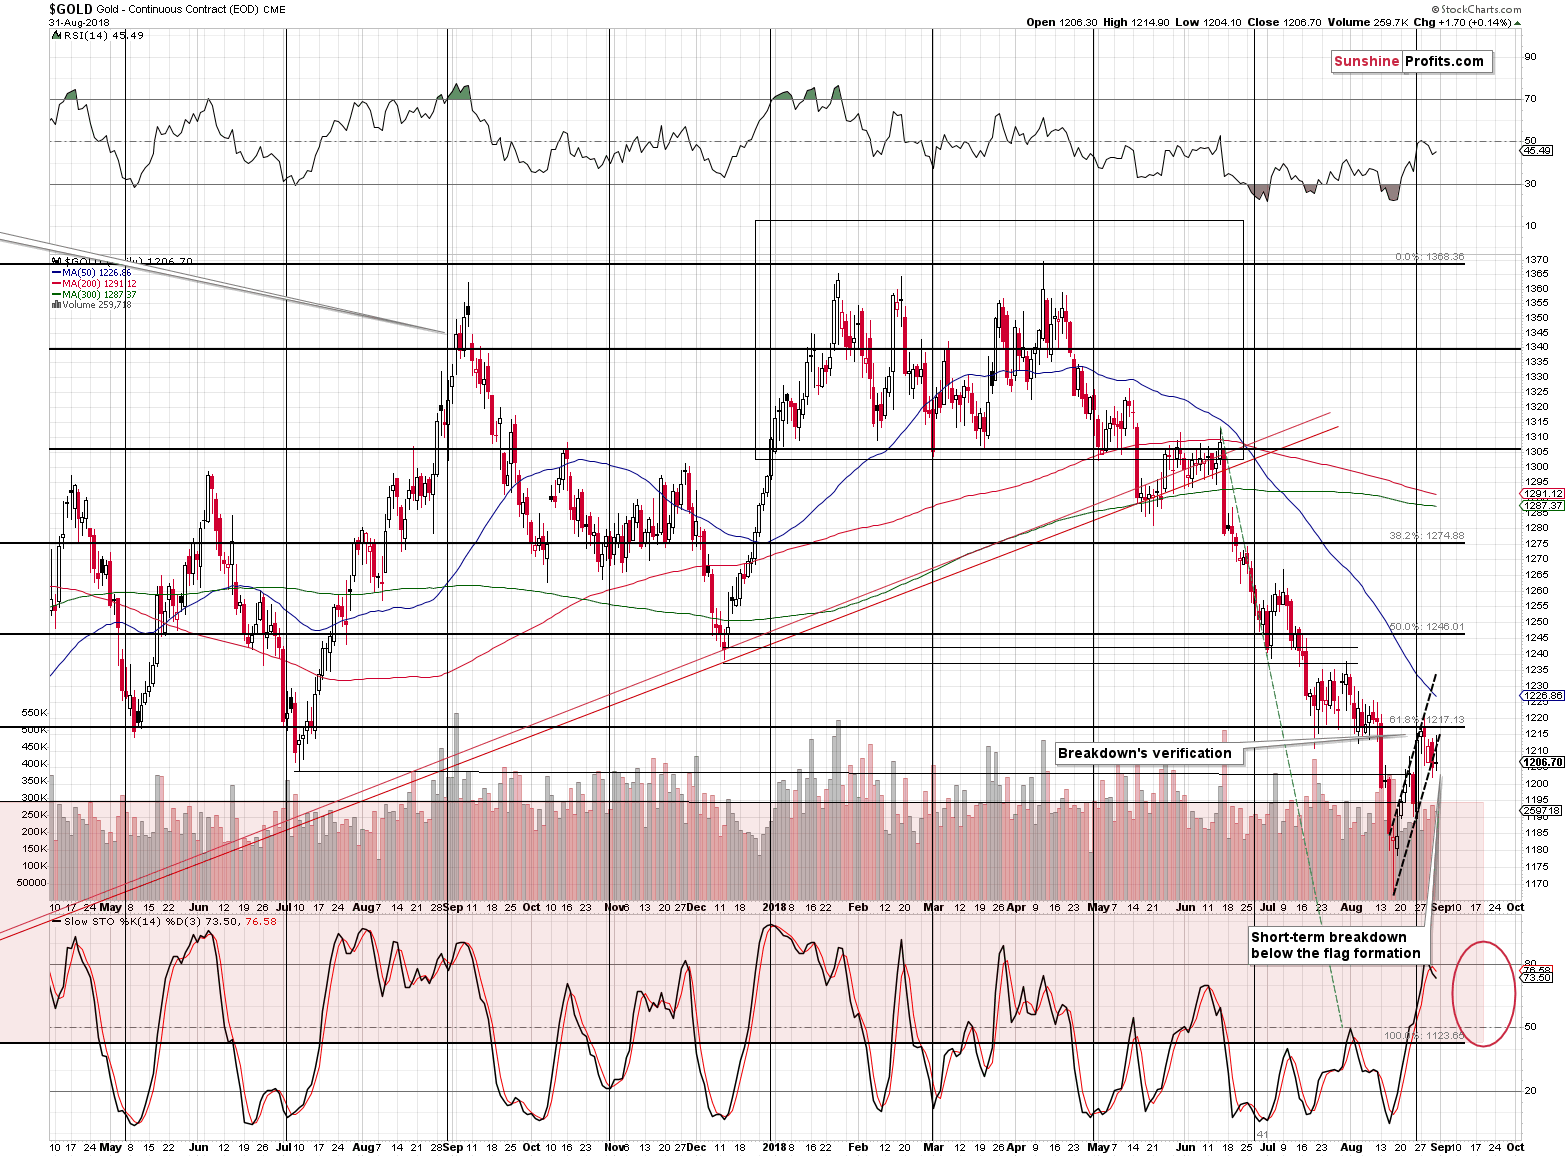
At the moment of writing these words, the price of gold is trading at $1,195, which is well below the flag pattern. This is a strong signal that the correction is over, and that gold is now ready to slide much lower.
The moves that follow the flag patterns tend to be similar in size to the moves that preceded them. Gold declined by about 14.6% (April top – August bottom) before the pattern, so if it declines in a similar way (counting from the late August top), we’re likely to see gold at $1,221 * (1 – 14.6%) = $1,043.73 relatively soon. In other words, based on the recent flag pattern, gold is likely to slide to the December 2015 bottom. And you – our subscribers – have been prepared for this eventuality for more than a month.
If you think the above is bearish, just wait until we tell you what just happened in silver.
Silver’s Breakdown
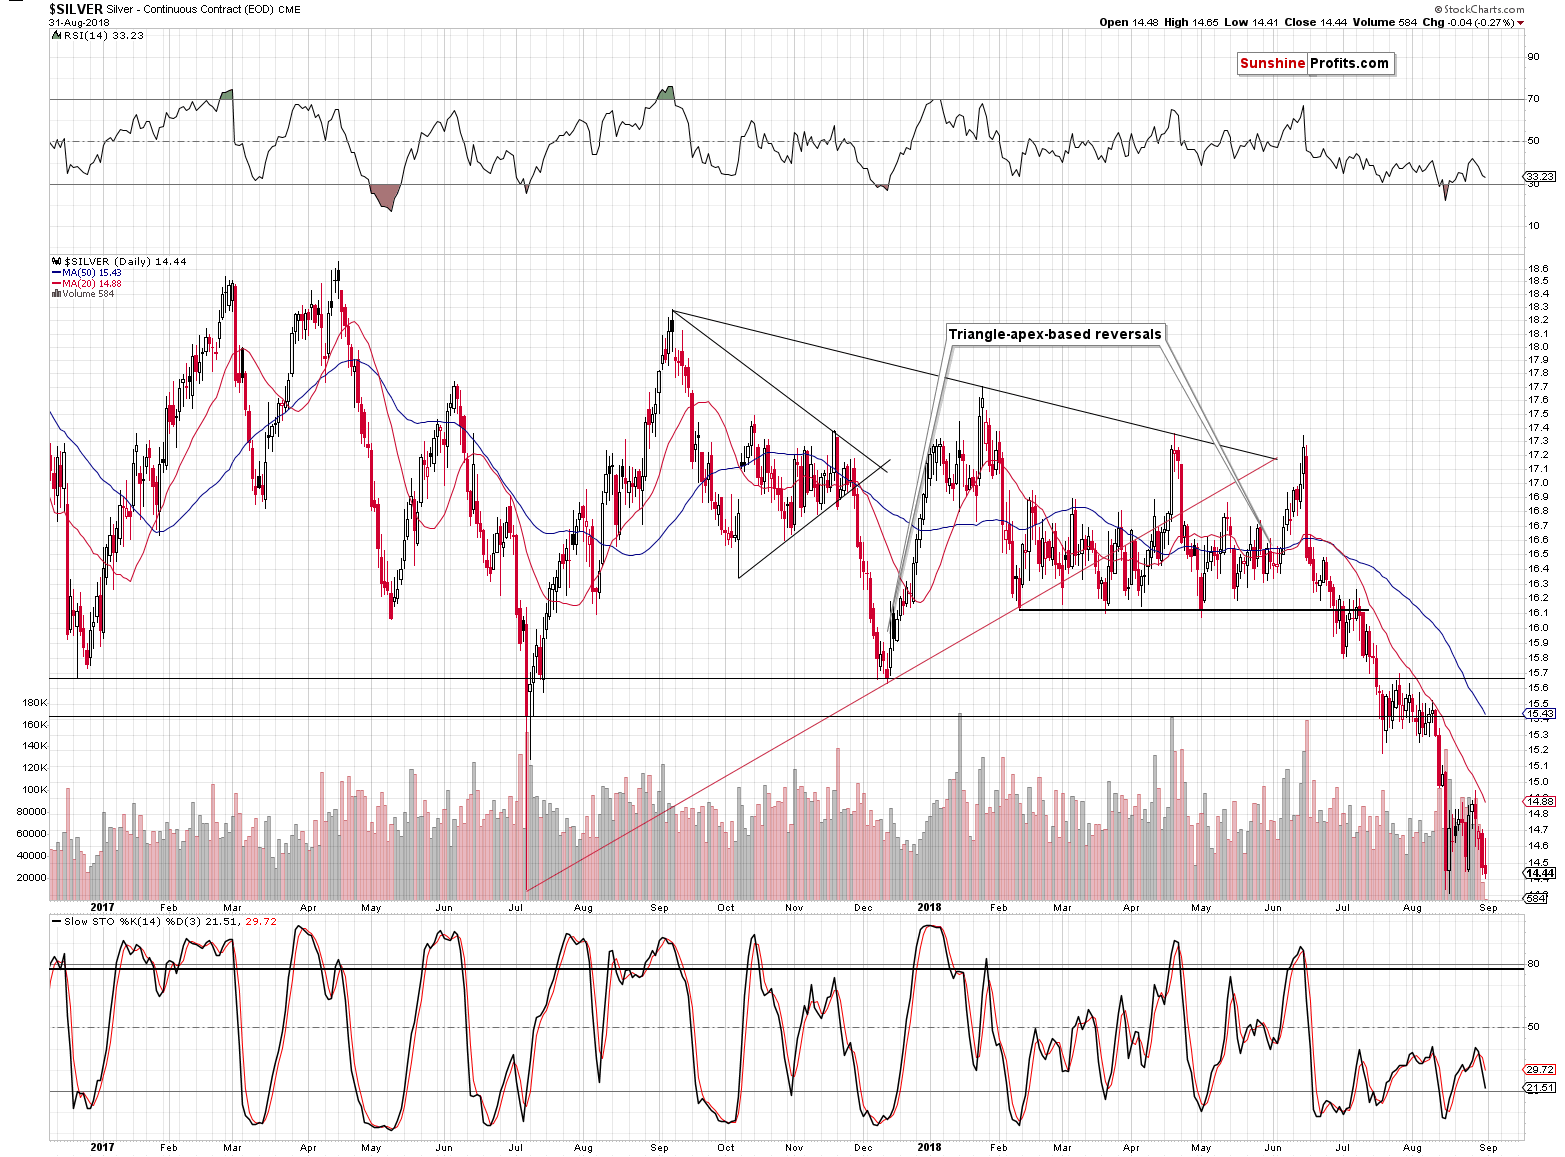
At the end of August, silver closed the session at a new low in terms of daily and weekly closing prices. That’s an unconfirmed, but still major, breakdown. As an unconfirmed move, it wouldn’t have been so important, if it wasn’t for a different fact.
The thing is that the entire late-August consolidation was a pause that followed the breakdown below the rising red support line. So, the unconfirmed move is a part of a different move, in which the decline is already more than confirmed.
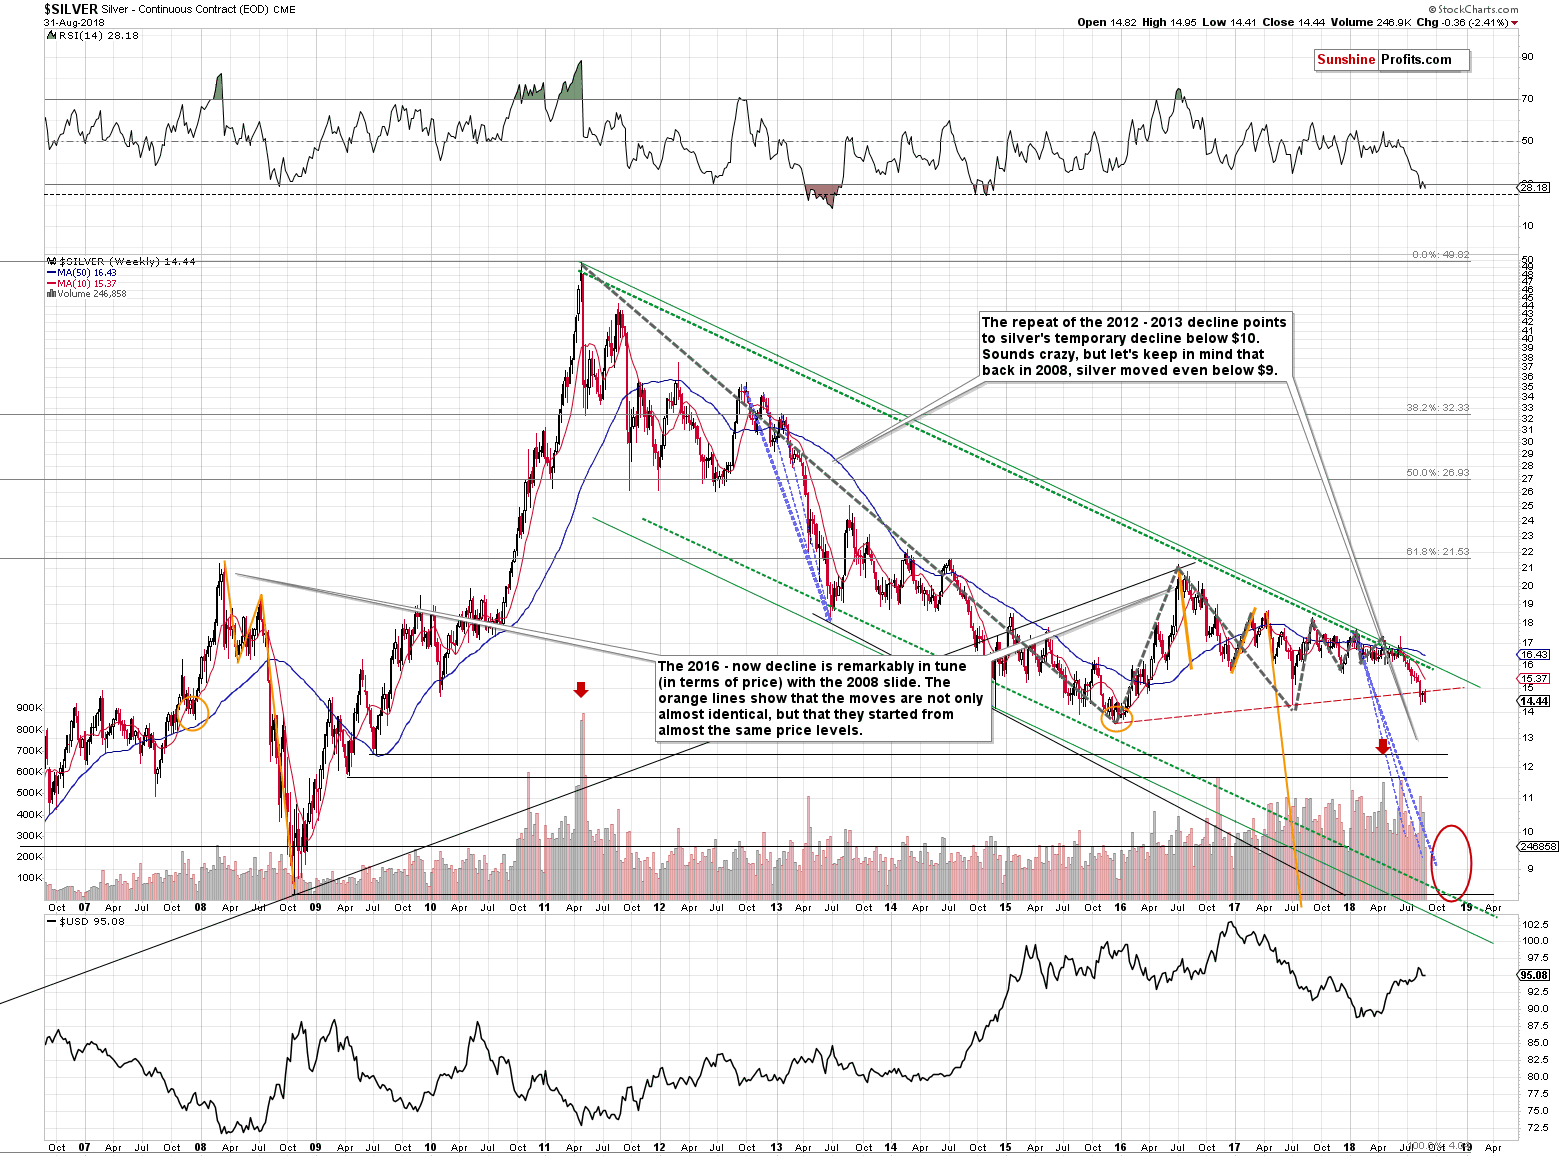
The implications are very bearish, especially that silver’s 2015 bottom is not far away and the gold to silver ratio is on the rise (the real long-term resistance is at about 100, not 80-85). This means that if gold is to move much lower shortly, then silver is very likely to slide below the 2015 lows. To be clear, we expect the same for gold, but we think that in the case of silver, the decline will be even bigger and more profound.
At the moment of writing these words, we have silver futures at $14.30, which means that the white metal already moved to new intraday lows of this year.
Miners’ Breakdown
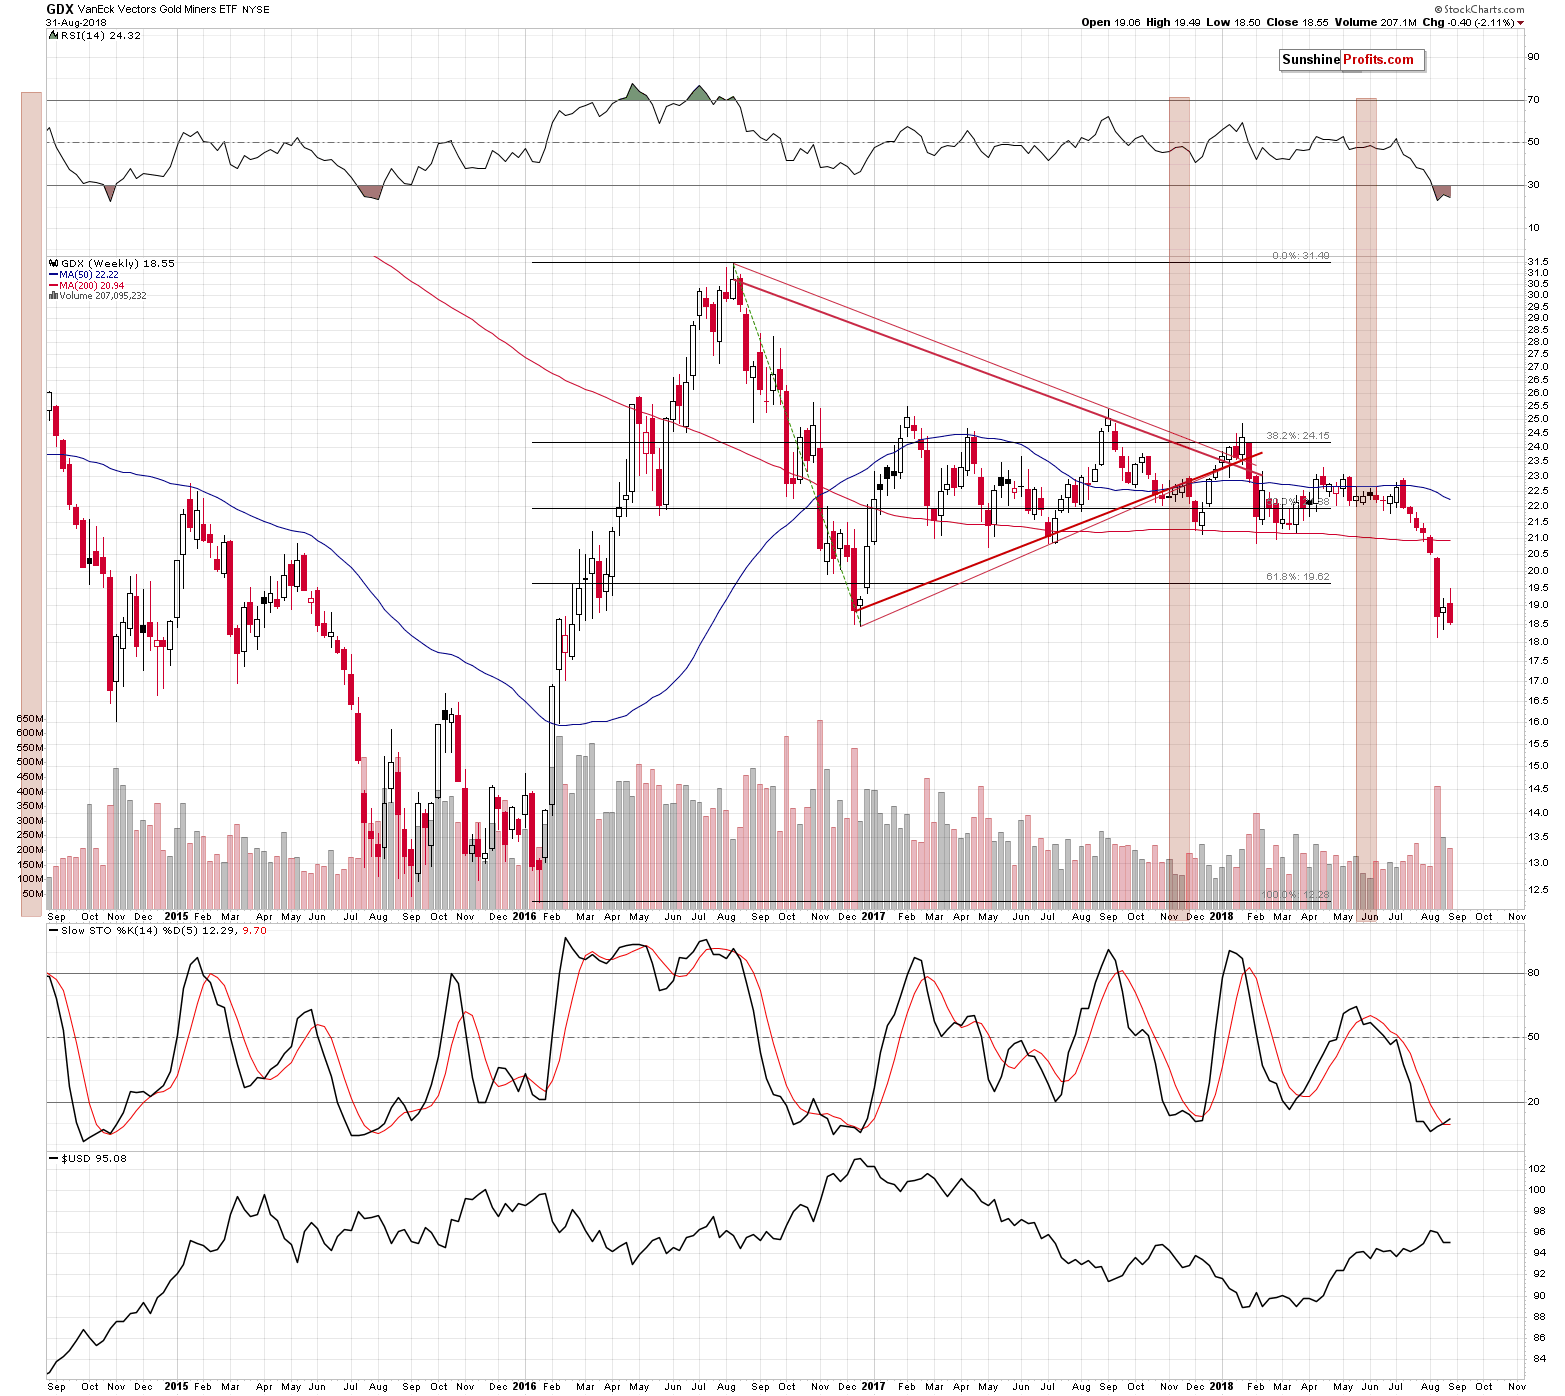
Last week, the GDX ETF, a proxy for the mining stocks sector, closed below the previous 2018 weekly closing prices. In other words, we just saw a breakdown in terms of the weekly closing prices.
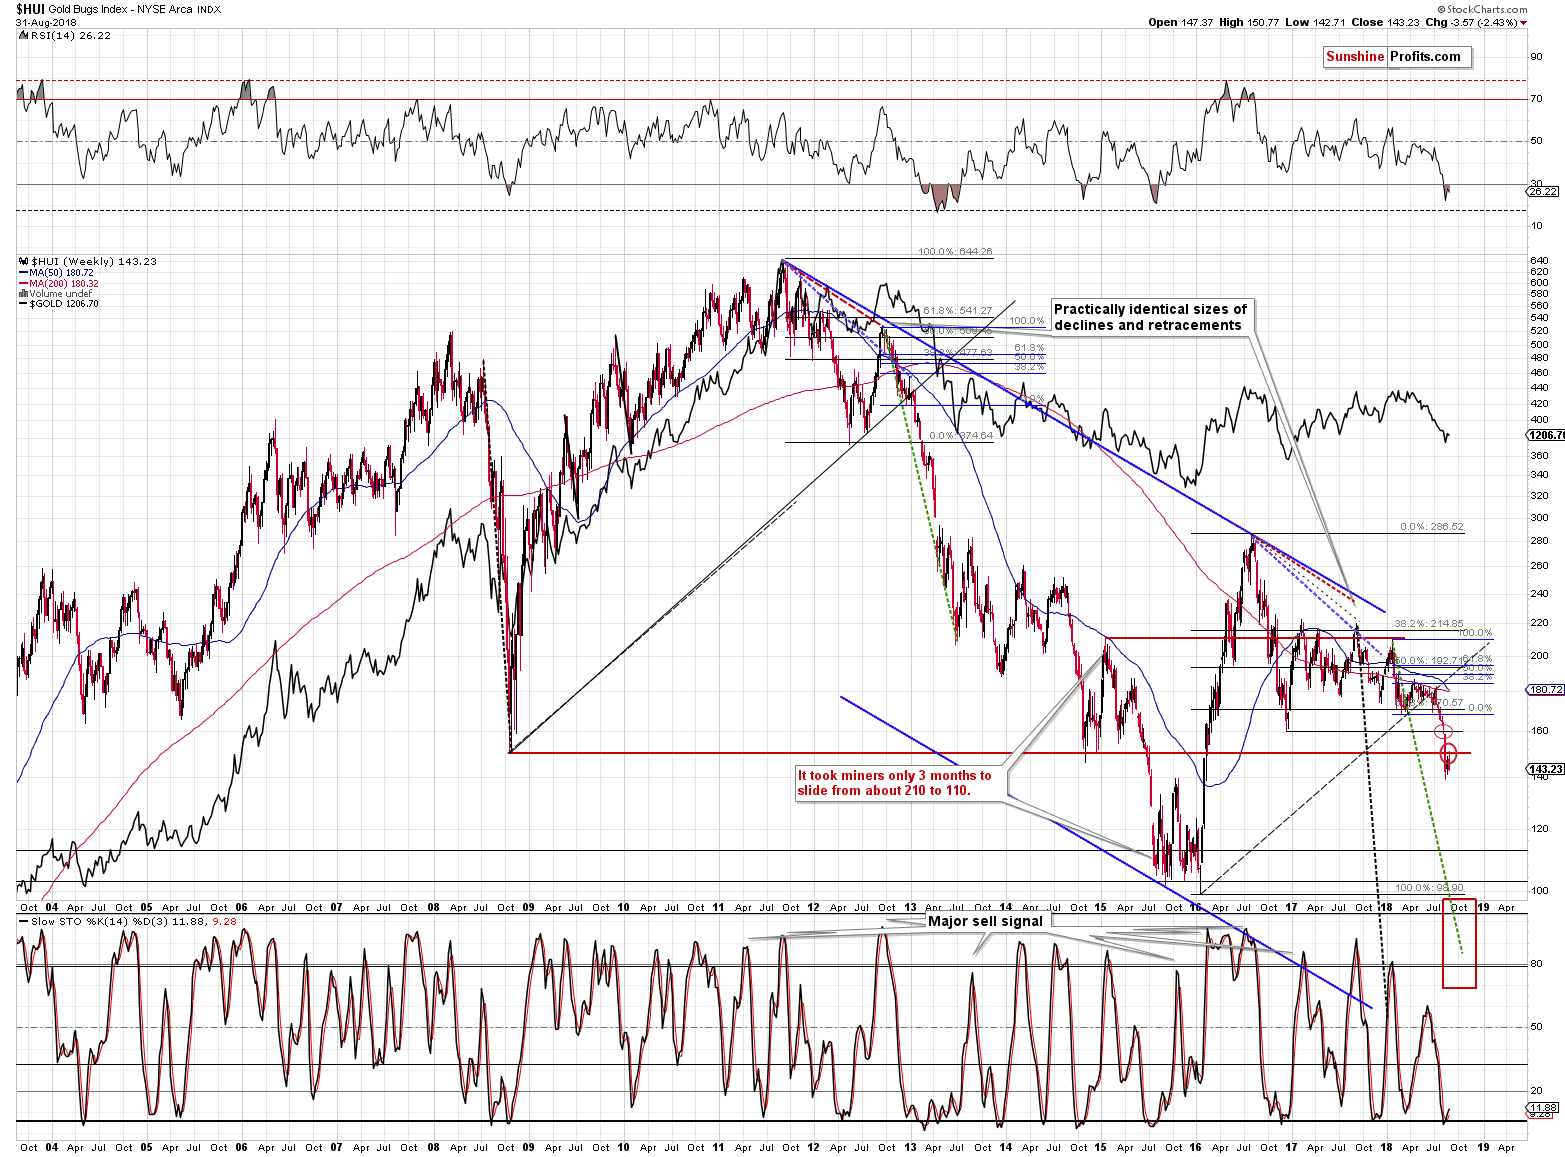
The HUI Index, an even more important proxy for mining stocks, moved a bit higher after breaking below the 2008 and late 2014 lows and then it declined once again. The breakdowns were verified. The decline can now continue.
The decline is likely to be big and sharp as there is no significant support all the way down to the 2015 and 2016 lows. That’s a big slide. And it may not end there. In fact, miners are likely to move to new lows just like gold and silver are. It’s not apparent how low they will slide, but it is likely that this becomes clearer once the entire sector moves lower. We’ll keep you – our subscribers – informed.
Finally, we would like to address the question that we’ve been asked multiple times recently. The SP Silver-Miner Indicator that we described in our Buy-and-hold on Steroids essay is not yet available for public viewing. We have it to use in our Excel spreadsheets, but we are not yet prepared to provide it on our website (it needs a few technical adjustments). But, please note that the first time when it’s really useful will be after the final bottom as THE bottom is likely to be immediately followed by mining stocks outperformance. The SP Silver-Miner Indicator will become exceptionally useful after that time, as it will help to detect the optimal moment for making the switch from the miners to silver (at least in the case of a part of one’s portfolio).
Important Analyses
Before summarizing, we would like to emphasize that we have recently posted several analyses that are very important and that one should keep in mind, especially in the next several weeks. If you haven’t had the chance of reading them previously, we encourage you to do so today:
- Dear Gold Investor - Letters from 2013 - Analogy to 2013, which should make it easier to trade the upcoming sizable upswing (if enough factors point to it, that is) and to enter the market close to the final bottom.
- Gold to Soar Above $6,000 - discussion of gold’s long-term upside target of $6,000.
- Preparing for THE Bottom in Gold: Part 6 – What to Buy - extremely important analysis of the portfolio structure for the next huge, multi-year rally in the precious metals.
- Preparing for THE Bottom in Gold: Part 7 – Buy-and-hold on Steroids – description of a strategy dedicated to significantly boosting one’s long-term investment returns while staying invested in the PM sector.
- Gold’s Downside Target, Upcoming Rebound, and Miners’ Buy Plan - details regarding the shape of the following price moves, a buying plan for mining stocks, and a brief discussion of the final price targets for the current decline.
- Gold: What Happened vs. What Changed – discussion of the latest extreme readings from gold’s CoT report
- Key Factors for Gold & Silver Investors - discussion of key, long-term factors that support the bearish outlook for PMs. We are often asked what makes us so bearish – this article is a reply to this question.
Summary
Summing up, it’s very likely that the pause in the precious metals market is over and the next big move down is already underway. The move is likely to be sharp and the profits on the current short position are likely to change from being huge to being enormous and then finally to being ridiculous.
On a personal note, Nadia and I would like to thank everyone who sent their congratulations and best wishes to us for our wedding, which took place this Saturday. We really appreciate it. Your kind words made this amazing day even better.
Thank you.
To summarize:
Trading capital (supplementary part of the portfolio; our opinion): Full short positions (250% of the full position) in gold, silver and mining stocks are justified from the risk/reward perspective with the following stop-loss orders and exit profit-take price levels:
- Gold: profit-take exit price: $1,062; stop-loss: $1,231; initial target price for the DGLD ETN: $82.96; stop-loss for the DGLD ETN $52.37
- Silver: profit-take exit price: $12.72; stop-loss: $15.56; initial target price for the DSLV ETN: $46.97; stop-loss for the DSLV ETN $28.87
- Mining stocks (price levels for the GDX ETF): profit-take exit price: $13.12; stop-loss: $20.81; initial target price for the DUST ETF: $80.97; stop-loss for the DUST ETF $30.87
Note: the above is a specific preparation for a possible sudden price drop, it does not reflect the most likely outcome. You will find a more detailed explanation in our August 1 Alert. In case one wants to bet on junior mining stocks’ prices (we do not suggest doing so – we think senior mining stocks are more predictable in the case of short-term trades – if one wants to do it anyway, we provide the details), here are the stop-loss details and target prices:
- GDXJ ETF: profit-take exit price: $17.52; stop-loss: $30.72
- JDST ETF: initial target price: $154.97 stop-loss: $62.78
Long-term capital (core part of the portfolio; our opinion): No positions (in other words: cash)
Insurance capital (core part of the portfolio; our opinion): Full position
Important Details for New Subscribers
Whether you already subscribed or not, we encourage you to find out how to make the most of our alerts and read our replies to the most common alert-and-gold-trading-related-questions.
Please note that the in the trading section we describe the situation for the day that the alert is posted. In other words, it we are writing about a speculative position, it means that it is up-to-date on the day it was posted. We are also featuring the initial target prices, so that you can decide whether keeping a position on a given day is something that is in tune with your approach (some moves are too small for medium-term traders and some might appear too big for day-traders).
Plus, you might want to read why our stop-loss orders are usually relatively far from the current price.
Please note that a full position doesn’t mean using all of the capital for a given trade. You will find details on our thoughts on gold portfolio structuring in the Key Insights section on our website.
As a reminder – “initial target price” means exactly that – an “initial” one, it’s not a price level at which we suggest closing positions. If this becomes the case (like it did in the previous trade) we will refer to these levels as levels of exit orders (exactly as we’ve done previously). Stop-loss levels, however, are naturally not “initial”, but something that, in our opinion, might be entered as an order.
Since it is impossible to synchronize target prices and stop-loss levels for all the ETFs and ETNs with the main markets that we provide these levels for (gold, silver and mining stocks – the GDX ETF), the stop-loss levels and target prices for other ETNs and ETF (among other: UGLD, DGLD, USLV, DSLV, NUGT, DUST, JNUG, JDST) are provided as supplementary, and not as “final”. This means that if a stop-loss or a target level is reached for any of the “additional instruments” (DGLD for instance), but not for the “main instrument” (gold in this case), we will view positions in both gold and DGLD as still open and the stop-loss for DGLD would have to be moved lower. On the other hand, if gold moves to a stop-loss level but DGLD doesn’t, then we will view both positions (in gold and DGLD) as closed. In other words, since it’s not possible to be 100% certain that each related instrument moves to a given level when the underlying instrument does, we can’t provide levels that would be binding. The levels that we do provide are our best estimate of the levels that will correspond to the levels in the underlying assets, but it will be the underlying assets that one will need to focus on regarding the signs pointing to closing a given position or keeping it open. We might adjust the levels in the “additional instruments” without adjusting the levels in the “main instruments”, which will simply mean that we have improved our estimation of these levels, not that we changed our outlook on the markets. We are already working on a tool that would update these levels on a daily basis for the most popular ETFs, ETNs and individual mining stocks.
Our preferred ways to invest in and to trade gold along with the reasoning can be found in the how to buy gold section. Additionally, our preferred ETFs and ETNs can be found in our Gold & Silver ETF Ranking.
As a reminder, Gold & Silver Trading Alerts are posted before or on each trading day (we usually post them before the opening bell, but we don't promise doing that each day). If there's anything urgent, we will send you an additional small alert before posting the main one.
=====
Hand-picked precious-metals-related links:
PRECIOUS-Gold falls as trade, emerging market worries lift dollar
CFA UK survey: Investor risk appetite falls in Q2 as gold seen as best value since 2012
Perth Mint Reveals 2019 designs of Australian Bullion Coin Program
RBI buys gold for first time in nearly a decade
London Precious Metals Vault Holdings
=====
In other news:
Dollar shifts up through the gears, EM currencies skid again
European Stocks Strengthen; Dollar Extends Advance: Markets Wrap
ECB Endgame Has Governments Debating Possible Rate-Hike Damage
Turkish Central Bank Pledges Policy Action to Stem Inflation
Australia's central bank keeps interest rates at record low for 25th month
Japan issues evacuation advisories for one million as typhoon hits west coast
Argentina launches fresh austerity measures to stem peso crisis
Oil prices rise as Gulf of Mexico rigs evacuated
=====
Thank you.
Sincerely,
Przemyslaw Radomski, CFA
Founder, Editor-in-chief, Gold & Silver Fund Manager
Gold & Silver Trading Alerts
Forex Trading Alerts
Oil Investment Updates
Oil Trading Alerts

