

Briefly: In our opinion, full (150% of the regular full position) speculative short positions in gold, silver and mining stocks are justified from the risk/reward perspective at the moment of publishing this alert.
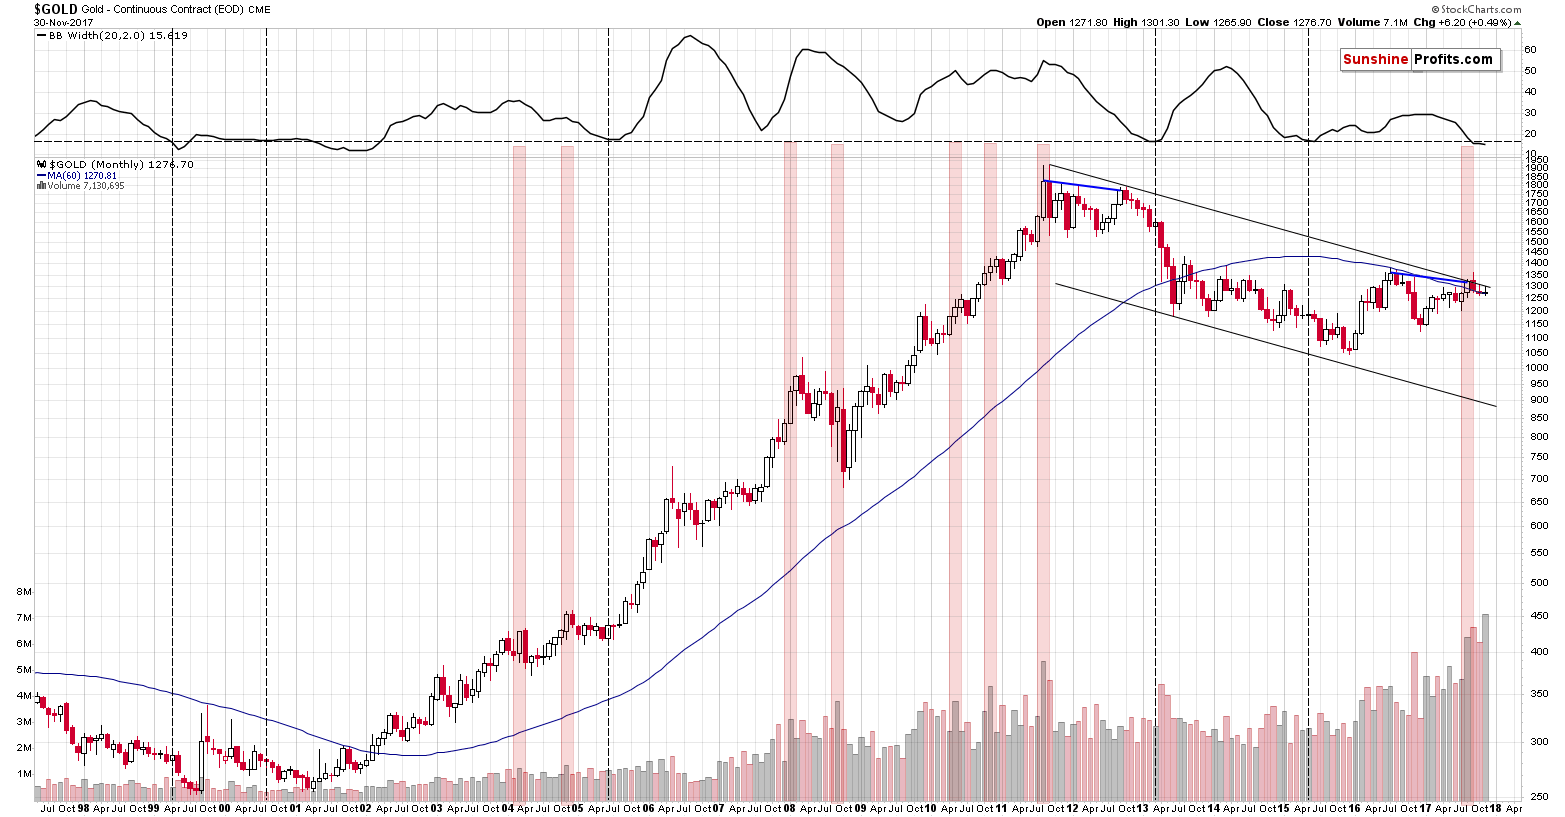
November turned out to be an up-month in gold and the analogy to what happened in late 2012 is no longer crystal clear. Moreover, gold’s monthly upswing was accompanied by extreme, record-breaking volume. Will we see a breakout shortly?
That’s highly unlikely. Let’s move right into gold’s long term chart – it will be easier to discuss the above issues with the price moves in front of us (chart courtesy of http://stockcharts.com).
Before we move to the details, let’s recall what we wrote about two weeks ago on gold’s big yearly volume:
We were asked to comment on the fact that the yearly volume in gold in 2016 was huge (even bigger than the one from 2011) and that the volume in gold so far this year is already bigger than in 2016. In particular, the question is if this is bullish, as both 2016 and 2017 were years when gold rallied. After all, an upswing on big volume is generally a bullish sign. This question was likely based on this article: http://www.swpcayman.com/news/commentary.php?u=buildup-gold-trading-volumes
In short, it doesn’t seem that it’s an important factor for the gold market’s outlook. It’s not even clear that it’s bullish at all.
The reason is provided by the context and there are multiple factors that make any bullish implications rather irrelevant:
- The volume was high in 2016 and 2017 and so was the price, but if we consider the starting and ending price of 2016 (and the intra-year high) and we consider the same for this year (taking the current price instead of the yearly closing price), we’ll see that the yearly performance is not a clear rally (a big bright candlestick on a yearly candlestick chart) - it’s a… reversal, especially in the case of 2016. In 2016 gold rallied from $1,060 to $1,377 only to close the year at about $1,152, invalidating most of the rally. Huge volume confirms the bearish implications of reversals, so the implications here are bearish rather than bullish. By the way, the months with the highest volume in both 2016 and 2017 were the ones when gold declined.
- Gold’s increase in yearly volume in terms of futures is not confirmed by yearly volume levels for the GLD ETF (this applies also to other precious metals ETFs, for instance PHYS and for the Central Fund of Canada). Yes, the volume for 2016 was higher than for 2015, but not as high as it was in 2010 or 2011. The 2017 performance is also far from spectacular - it appears that the 2017 volume for the GLD ETF will be lower than in 2016. Consequently, it could be the case that the increase in the gold futures’ volume is not suggesting anything very bullish for the gold market, but it simply shows an increase in the interest in the futures market. The following points seem to confirm it.
- Gold is not the only market where the futures volume moved to record highs. The same is the case with crude oil and copper. Why are the commodity futures’ volume soaring, but not the one for the GLD ETF? Because the likely common denominator is not the performance of gold, but the interest in the futures market.
- When gold futures’ volume previous increased substantially it meant that bigger declines were to be seen in the following months - this happened in 2008 and 2011. So, why would the move above the previous highs in the volume levels mean something else than a bigger decline this time? “This time is different” is often a costly phrase.
All in all, it doesn’t seem that the increase in the volume levels in the gold futures market is significant and it’s definitely not something to be viewed as bullish.
Just like the entire yearly “rally” and volume that we described above, gold’s price in November is a rally only theoretically (after all, gold ended the month $6 higher, so by definition it was a rally). In practice, gold rallied $31 and then declined $25, which is not really a rally, but a reversal. If it’s a reversal, then the huge volume that we saw is a major bearish confirmation, not a bullish one.
Having discussed the huge-volume “rally”, let’s discuss if what we saw last month invalidates the now-2012 analogy. In our view it doesn’t because of two reasons.
Firstly, the December 2012 decline wasn’t huge and this November’s rally was tiny, so they are not very different and in light of the previous months’ similarity, it would take a big difference (or a few subsequent small differences) to invalidate the analogy.
Secondly, it appears that gold really “wanted to” decline this week, but it had “bad luck” in terms of a pause and a quick decline in the USD Index. It doesn’t seem that gold impacts the currency moves, but the that the relationship works in the opposite direction – currencies impact gold. Gold usually responds to the USD’s declines with rallies and in the past two days it declined in spite of lower USD prices. That’s a big bearish sign and in light of what we wrote earlier, it strongly suggests that if the USD hadn’t interrupted gold in its plunge, the latter would have been much bigger. If gold’s decline was bigger by at least $6, it would have made November a down month for gold and if the addition to the decline was at least $15 or so (which seems a more realistic expectation in our view), then the analogy would be perfectly confirmed.
Should we view the analogy as invalidated because of a more or less random (in the sense that it’s an external factor from the gold market’s point of view) factor in the final part of the month? It doesn’t seem justified to do so. If gold continues to decline in the coming days - either today or next week – then, in our opinion, the now-2012 analogy will be just as confirmed as if gold had declined last month.
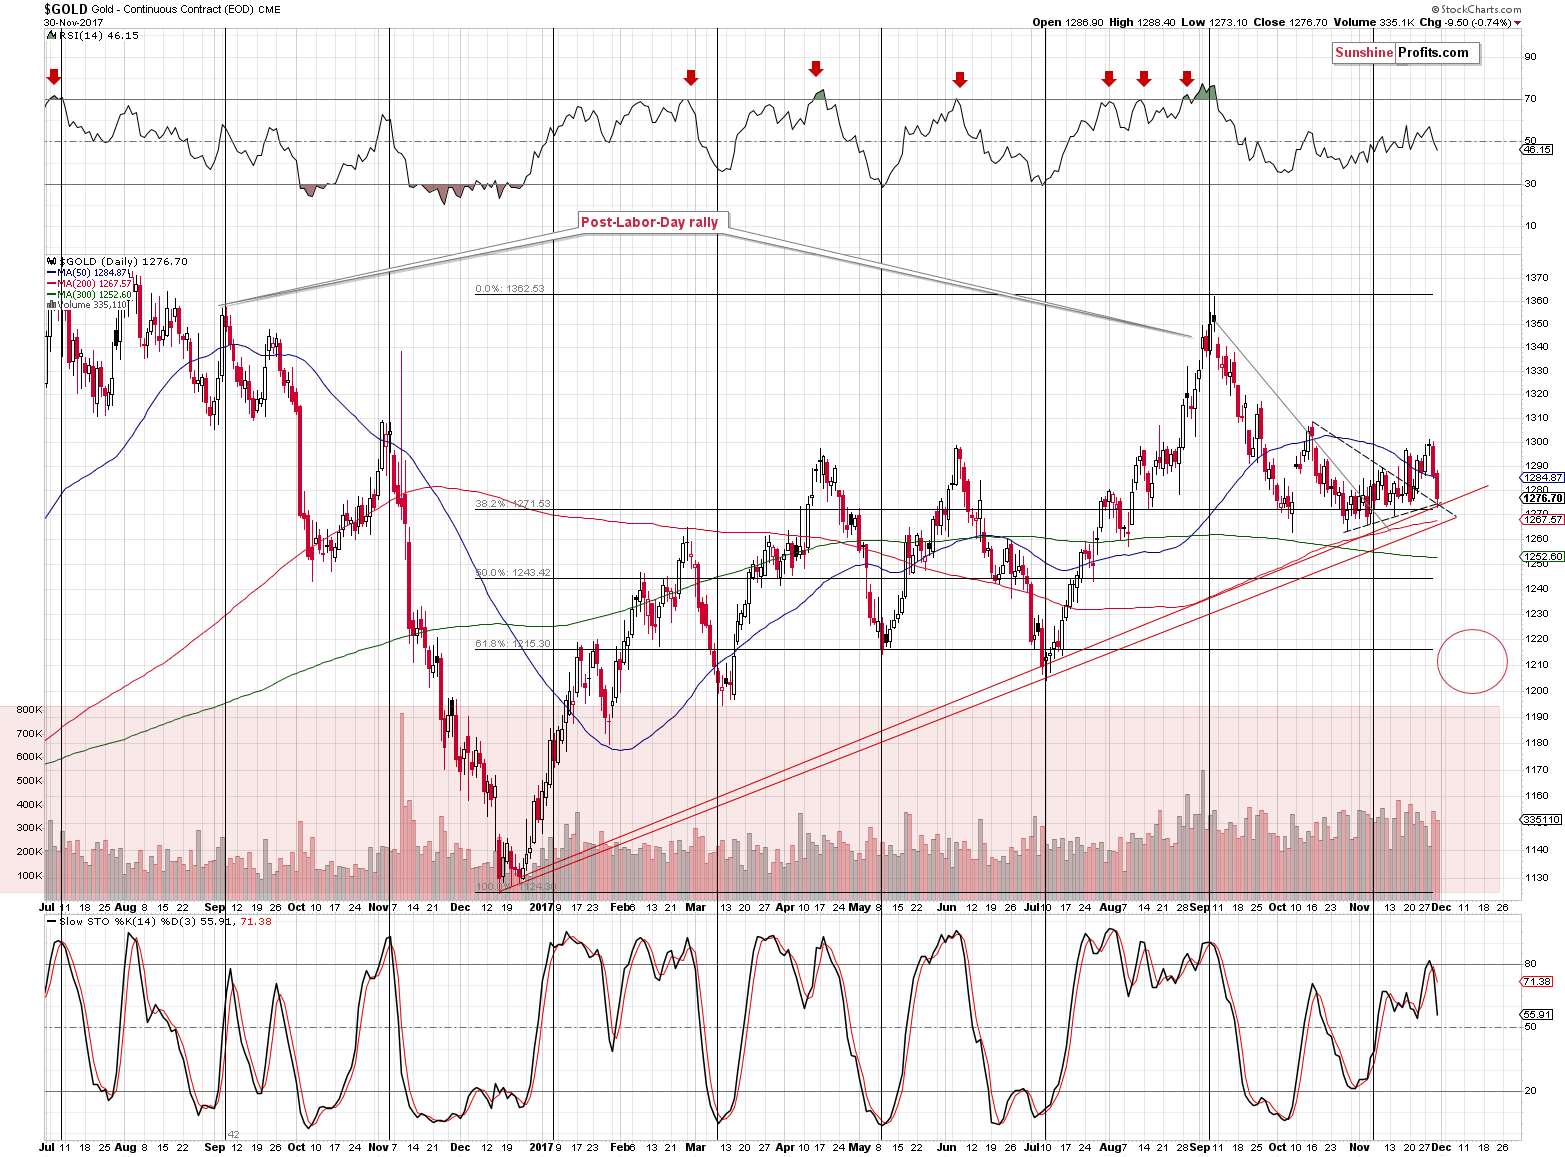
From the short-term point of view, gold declined once again and the decline took place on visible volume. That’s bearish and we can say the same about the sell signal from the Stochastic indicator.
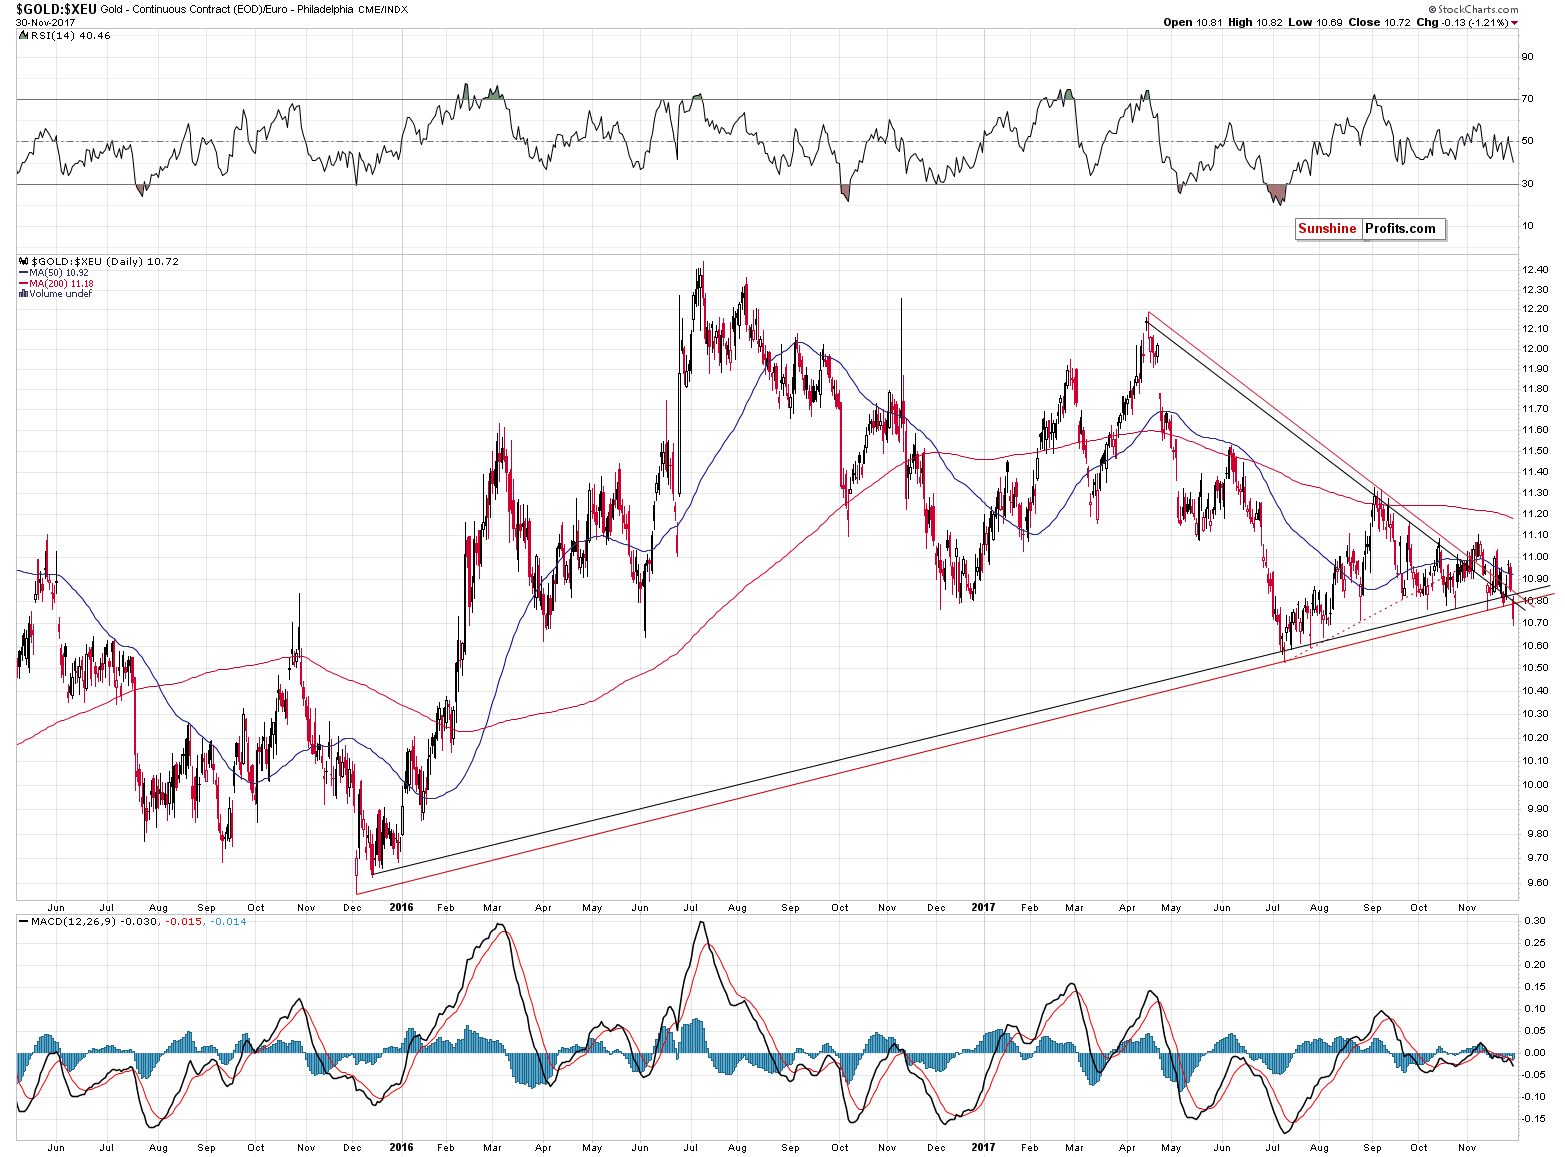
In terms of the euro, the bearish signals are much more profound. Gold has just broken below the rising, medium-term support line and the most recent local top was formed approximately at the apex of the triangle pattern (in terms of time). The latter makes it considerably more likely that an important top was just formed and thus that the breakdown that we just saw will be confirmed.
As far as the apex of the triangle is concerned, it’s actually a combination of two such patterns – they are based on the same tops and bottoms, but in one case (red lines) they are based on the intraday extremes and in the other case (black lines) they are based on the daily closing prices. The most recent top took place right between the apexes created based on both patterns.
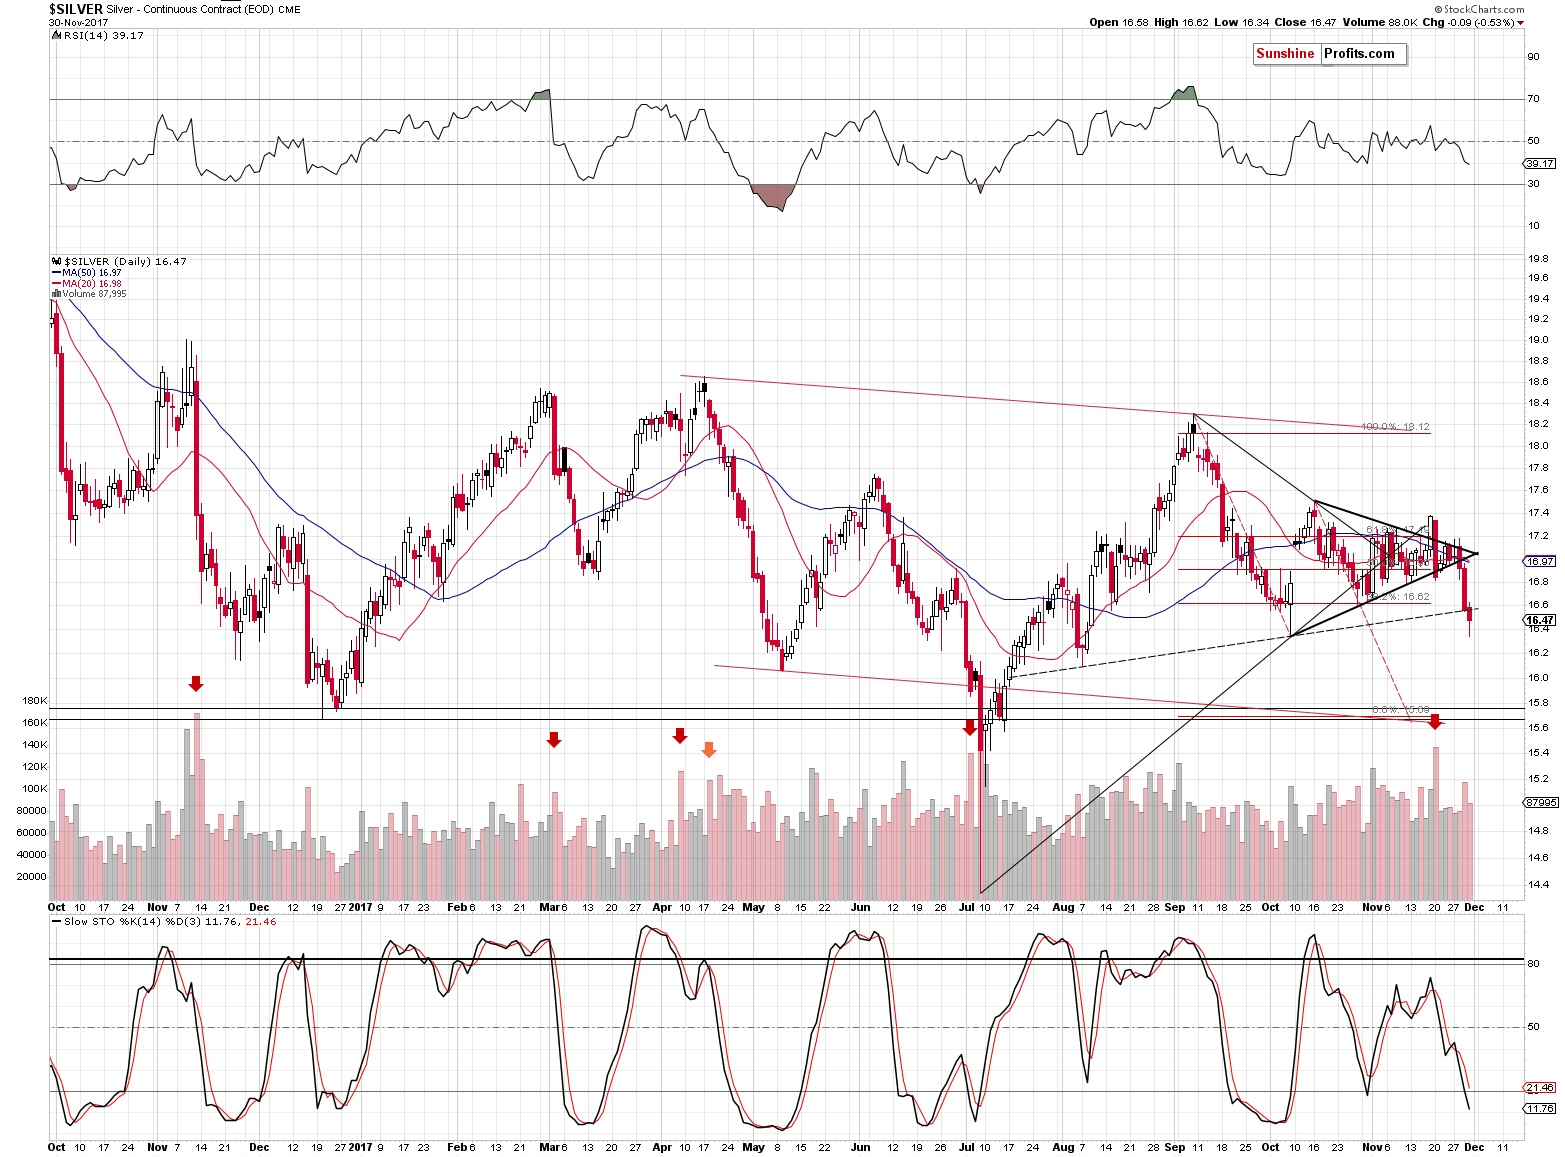
Silver declined and it reversed before the end of the session, which appears to be a reversal. But does this reversal really have bullish implications? It doesn’t seem to be the case. The volume wasn’t huge enough to confirm the reversal and it was not low enough to invalidate the bearish implications of the decline either.
The key thing to the proper analysis of the silver price swing is the awareness of what the USD and S&P 500 did. The former declined a bit, while stocks truly soared, which created perfect circumstances for a silver rally. Yet, instead of a rally, we saw a decline and a move below the rising support line based on the August and October lows. Consequently, silver’s action was very bearish as it showed great weakness in this market.
Moreover, the mentioned support line could be viewed as a neck level of a head and shoulders pattern (with a rather long right shoulder, similar to the one that we saw in the euro), which serves as an additional bearish indication (it’s only a small addition to the bearish implications of the breakdown as such, as its implications are bearish regardless of the H&S formation being in place or not).
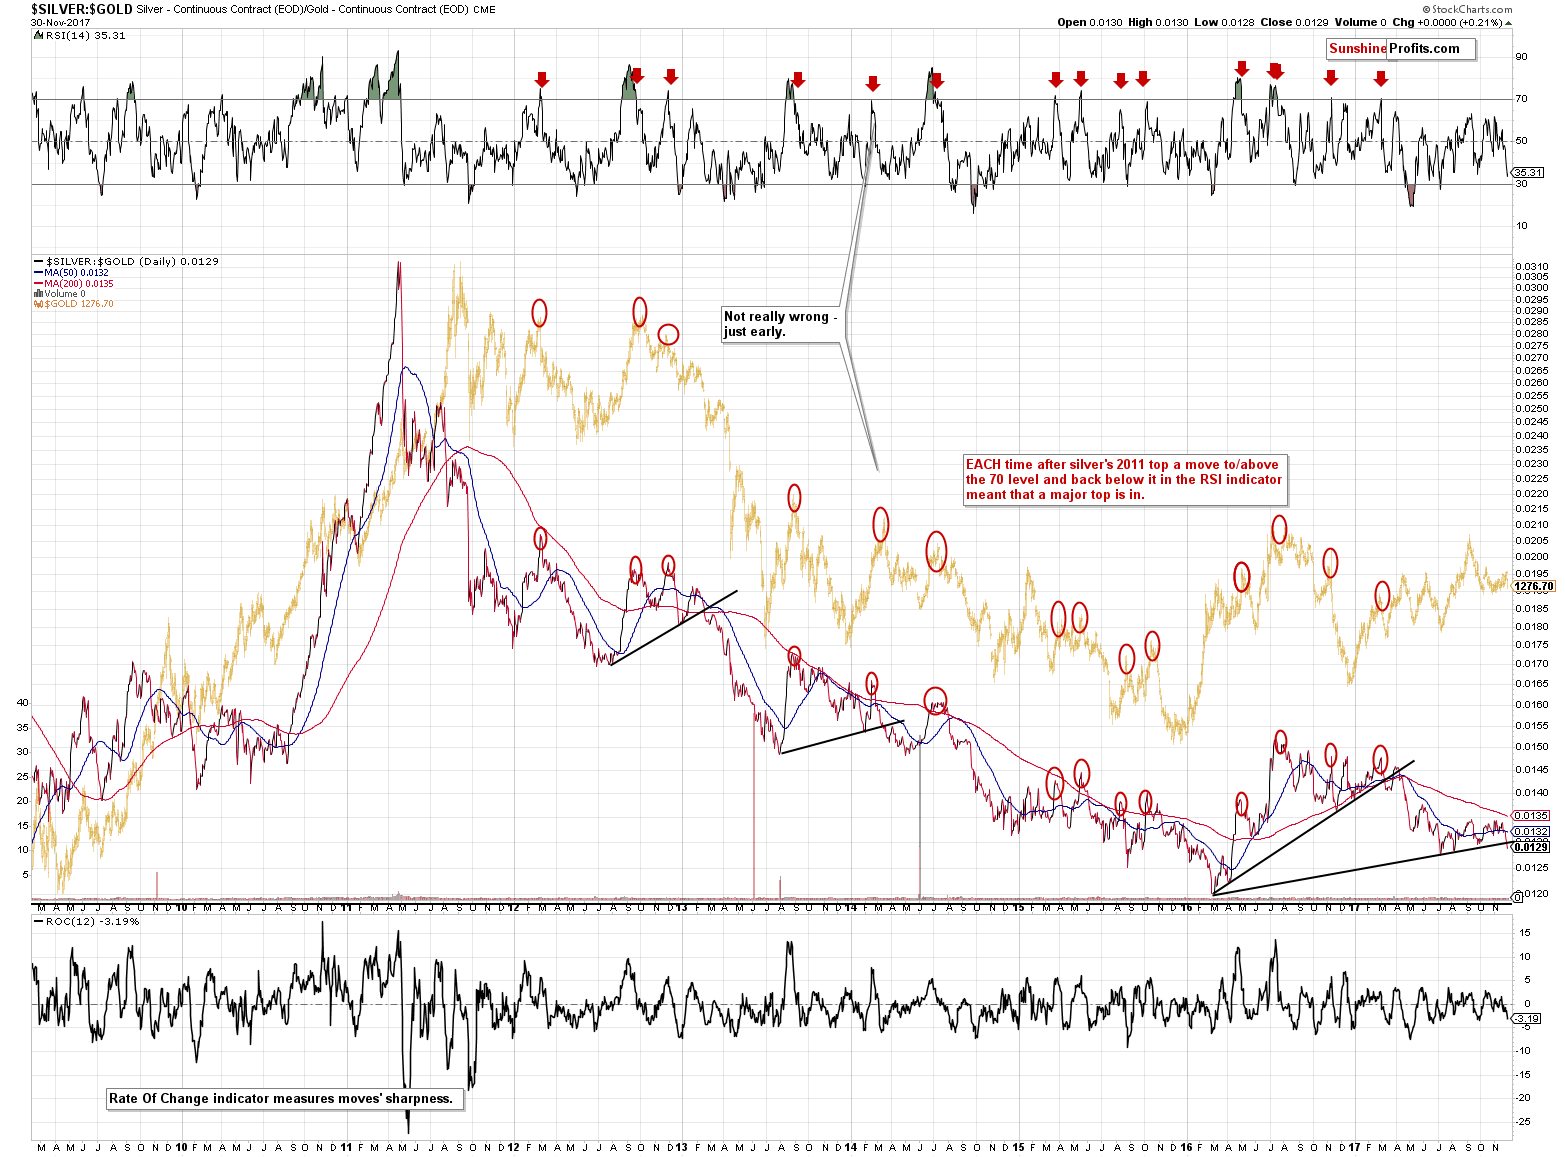
The silver to gold ratio chart also features a breakdown below a rising support line. In the past few years there were very few cases when we saw analogous breakdowns, so it’s a good idea to check what happened after each of them.
The 2013 breakdown was followed by a major decline in gold, the 2014 one was followed by a moderate decline in gold, and the one that we saw in the first half of this year was not followed by a decline, but it did mark the moment after which the rally stopped for several months.
The implications are bearish in the case of the ratio and the breakdown on its own, but in light of many other analogies to the pre-2013-slide action, the latter are further confirmed by the above and the overall implications are strongly bearish for the following months and weeks.
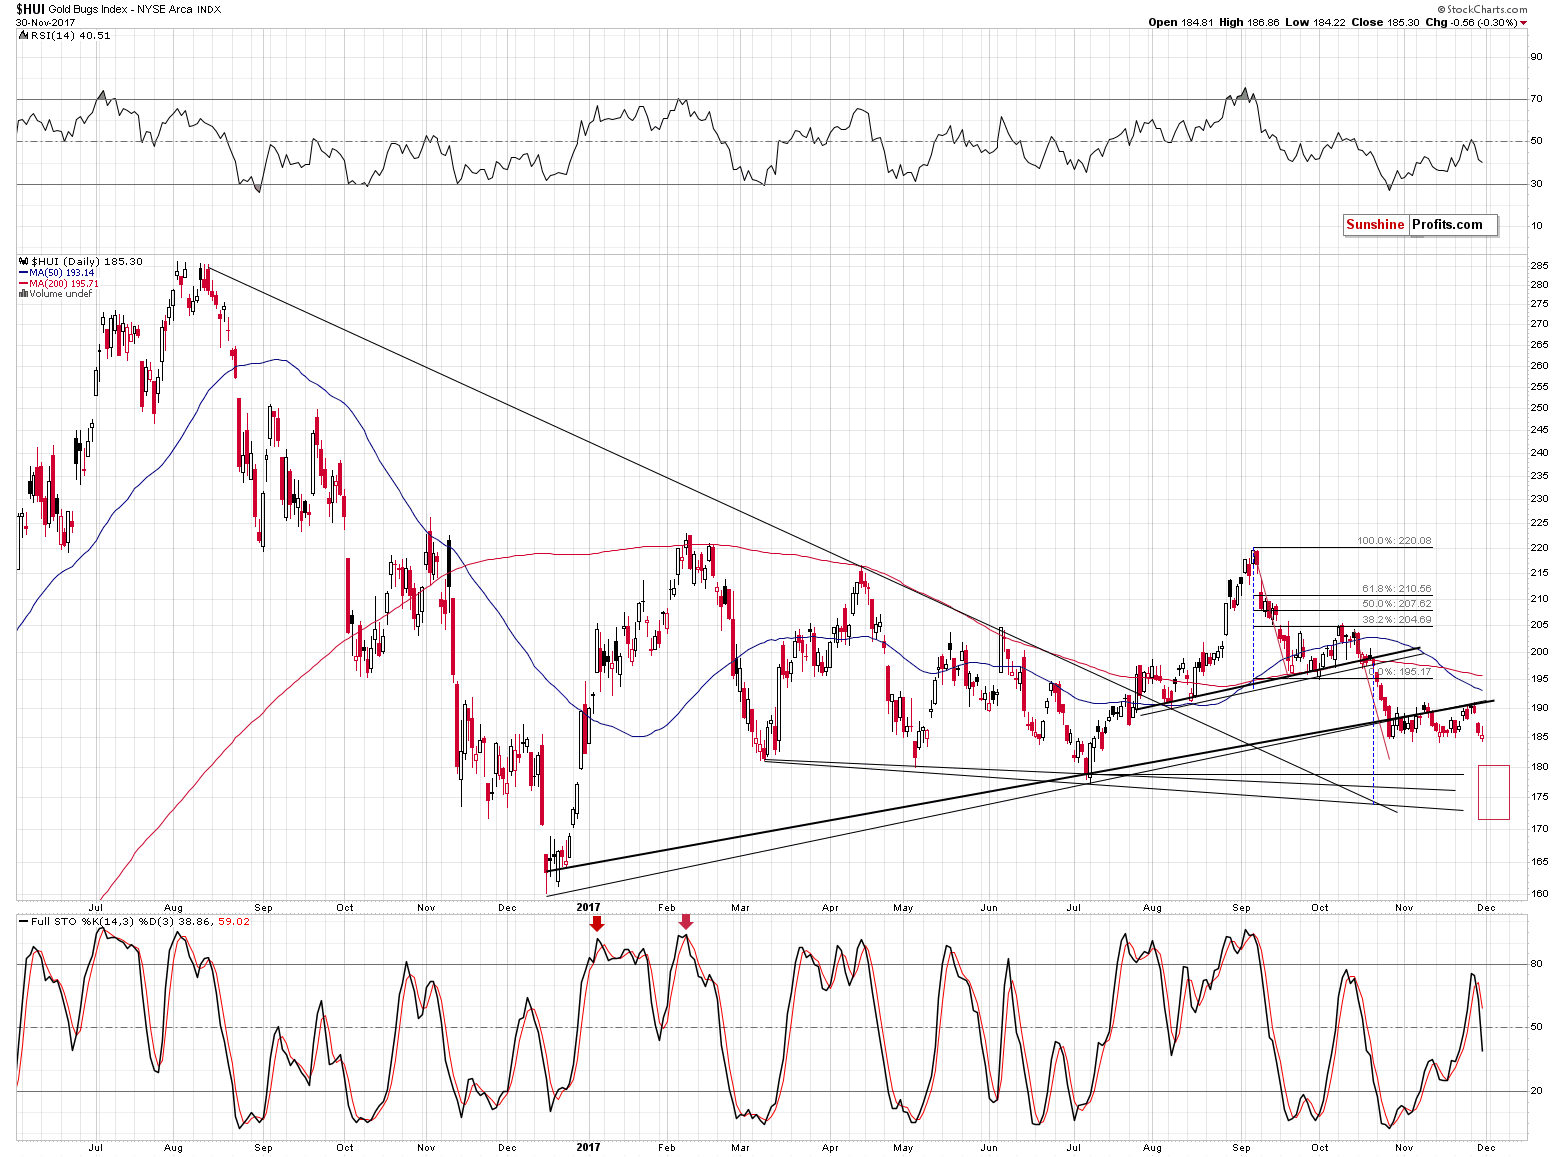
Gold stocks declined only a little yesterday, but in light of huge rally in the main stock indices, the action of the former is much more bearish than it appears at first sight.
Summing up, November’s reversal in gold and the huge volume that accompanied it seems to have bearish implications, not bullish ones, and the similarity to the pre-2013 slide remains in place. Metals and miners had a perfect environment for a rally yesterday and they declined instead, which makes the implications of the session bearish. They are particularly strong in the case of silver, which even managed to break below the medium-term support line.
The big decline in PMs appears to be underway.
Naturally, the medium-term outlook remains bearish, especially that the analogy to the 2012-2013 decline remains in place and the previously discussed long-term signals remain in place: gold’s huge monthly volume, the analogy in the HUI Index, the analogy between the two most recent series of interest rate hikes, and the RSI signal from gold priced in the Japanese yen.
As always, we will keep you – our subscribers – informed.
To summarize:
Trading capital (supplementary part of the portfolio; our opinion): Short positions (150% of the full position) in gold, silver and mining stocks are justified from the risk/reward perspective with the following stop-loss orders and exit price levels / profit-take orders:
- Gold: exit price: $1,218; stop-loss: $1,366; exit price for the DGLD ETN: $51.98; stop-loss for the DGLD ETN $38.74
- Silver: exit price: $15.82; stop-loss: $19.22; exit price for the DSLV ETN: $28.88; stop-loss for the DSLV ETN $17.93
- Mining stocks (price levels for the GDX ETF): exit price: $21.23; stop-loss: $26.34; exit price for the DUST ETF: $29.97; stop-loss for the DUST ETF $21.37
In case one wants to bet on junior mining stocks' prices (we do not suggest doing so – we think senior mining stocks are more predictable in the case of short-term trades – if one wants to do it anyway, we provide the details), here are the stop-loss details and exit prices:
- GDXJ ETF: exit price: $30.28; stop-loss: $45.31
- JDST ETF: exit price: $66.27; stop-loss: $43.12
Long-term capital (core part of the portfolio; our opinion): No positions (in other words: cash)
Insurance capital (core part of the portfolio; our opinion): Full position
Important Details for New Subscribers
Whether you already subscribed or not, we encourage you to find out how to make the most of our alerts and read our replies to the most common alert-and-gold-trading-related-questions.
Please note that the in the trading section we describe the situation for the day that the alert is posted. In other words, it we are writing about a speculative position, it means that it is up-to-date on the day it was posted. We are also featuring the initial target prices, so that you can decide whether keeping a position on a given day is something that is in tune with your approach (some moves are too small for medium-term traders and some might appear too big for day-traders).
Plus, you might want to read why our stop-loss orders are usually relatively far from the current price.
Please note that a full position doesn’t mean using all of the capital for a given trade. You will find details on our thoughts on gold portfolio structuring in the Key Insights section on our website.
As a reminder – “initial target price” means exactly that – an “initial” one, it’s not a price level at which we suggest closing positions. If this becomes the case (like it did in the previous trade) we will refer to these levels as levels of exit orders (exactly as we’ve done previously). Stop-loss levels, however, are naturally not “initial”, but something that, in our opinion, might be entered as an order.
Since it is impossible to synchronize target prices and stop-loss levels for all the ETFs and ETNs with the main markets that we provide these levels for (gold, silver and mining stocks – the GDX ETF), the stop-loss levels and target prices for other ETNs and ETF (among other: UGLD, DGLD, USLV, DSLV, NUGT, DUST, JNUG, JDST) are provided as supplementary, and not as “final”. This means that if a stop-loss or a target level is reached for any of the “additional instruments” (DGLD for instance), but not for the “main instrument” (gold in this case), we will view positions in both gold and DGLD as still open and the stop-loss for DGLD would have to be moved lower. On the other hand, if gold moves to a stop-loss level but DGLD doesn’t, then we will view both positions (in gold and DGLD) as closed. In other words, since it’s not possible to be 100% certain that each related instrument moves to a given level when the underlying instrument does, we can’t provide levels that would be binding. The levels that we do provide are our best estimate of the levels that will correspond to the levels in the underlying assets, but it will be the underlying assets that one will need to focus on regarding the signs pointing to closing a given position or keeping it open. We might adjust the levels in the “additional instruments” without adjusting the levels in the “main instruments”, which will simply mean that we have improved our estimation of these levels, not that we changed our outlook on the markets. We are already working on a tool that would update these levels on a daily basis for the most popular ETFs, ETNs and individual mining stocks.
Our preferred ways to invest in and to trade gold along with the reasoning can be found in the how to buy gold section. Additionally, our preferred ETFs and ETNs can be found in our Gold & Silver ETF Ranking.
As a reminder, Gold & Silver Trading Alerts are posted before or on each trading day (we usually post them before the opening bell, but we don't promise doing that each day). If there's anything urgent, we will send you an additional small alert before posting the main one.
=====
Latest Free Trading Alerts:
On Tuesday, Powell testified before the U.S. Congress. What do his remarks mean for the gold market?
The 2017 is almost gone. How will gold end this year? We invite you to read our today’s article about the current bullish and bearish factors driving the gold market and find out whether the yellow metal will finally jump above $1,300.
=====
Hand-picked precious-metals-related links:
PRECIOUS-Gold inches up on weaker dollar; improved risk appetite weighs
Millennials, online sales driving gold demand, says WGC
U.S. Mint American Eagle gold, silver coin sales fall sharply
=====
In other news:
Stocks Drop as Tech Selloff Resumes; Dollar Steady: Markets Wrap
Markets ignore best European factory data in 17 years
Here’s Where the GOP Tax Plan Stands Right Now
OPEC and allies extend oil production cuts by 9 months
Could The IRS Court Win Against Coinbase Be The First Dent In Crypto's Armor?
=====
Thank you.
Sincerely,
Przemyslaw Radomski, CFA
Founder, Editor-in-chief, Gold & Silver Fund Manager
Gold & Silver Trading Alerts
Forex Trading Alerts
Oil Investment Updates
Oil Trading Alerts

