

Briefly: in our opinion, full (200% of the regular size of the position) speculative long positions in gold, silver and mining stocks are justified from the risk/reward perspective at the moment of publishing this alert.
Platinum’s powerful decline is turning into a powerful reversal and an invalidation of earlier breakdowns. The implications are becoming clearly bullish for the precious metals investors even though silver hasn’t rallied much in the past several days. With all the bullish signals that are currently in play, is it possible that what we are seeing at this time is something more than just a short-term bottom?
One long-term (!) signal shows that the situation is currently just as extreme as it was in early 2001. It’s the strength in gold stocks despite gold’s decline. It’s as enormous as it was in 2001 and the miners’ strength is something that has proved to provide important signals over and over again in the case of smaller timeframes. Did the medium-term outlook just change? Is this a final chance to get into gold, silver and miners before they take off like they did in 2008 and 2016?
Before discussing the above, let’s briefly go through the short-term developments. Briefly, because practically everything developed in tune with what we wrote on Tuesday.
Let’s start with the key market that was the likely reason behind this week’s very short-term decline – platinum, and with quoting what we wrote on it previously (charts courtesy of http://stockcharts.com).
Platinum’s Breakdown and Its Invalidation
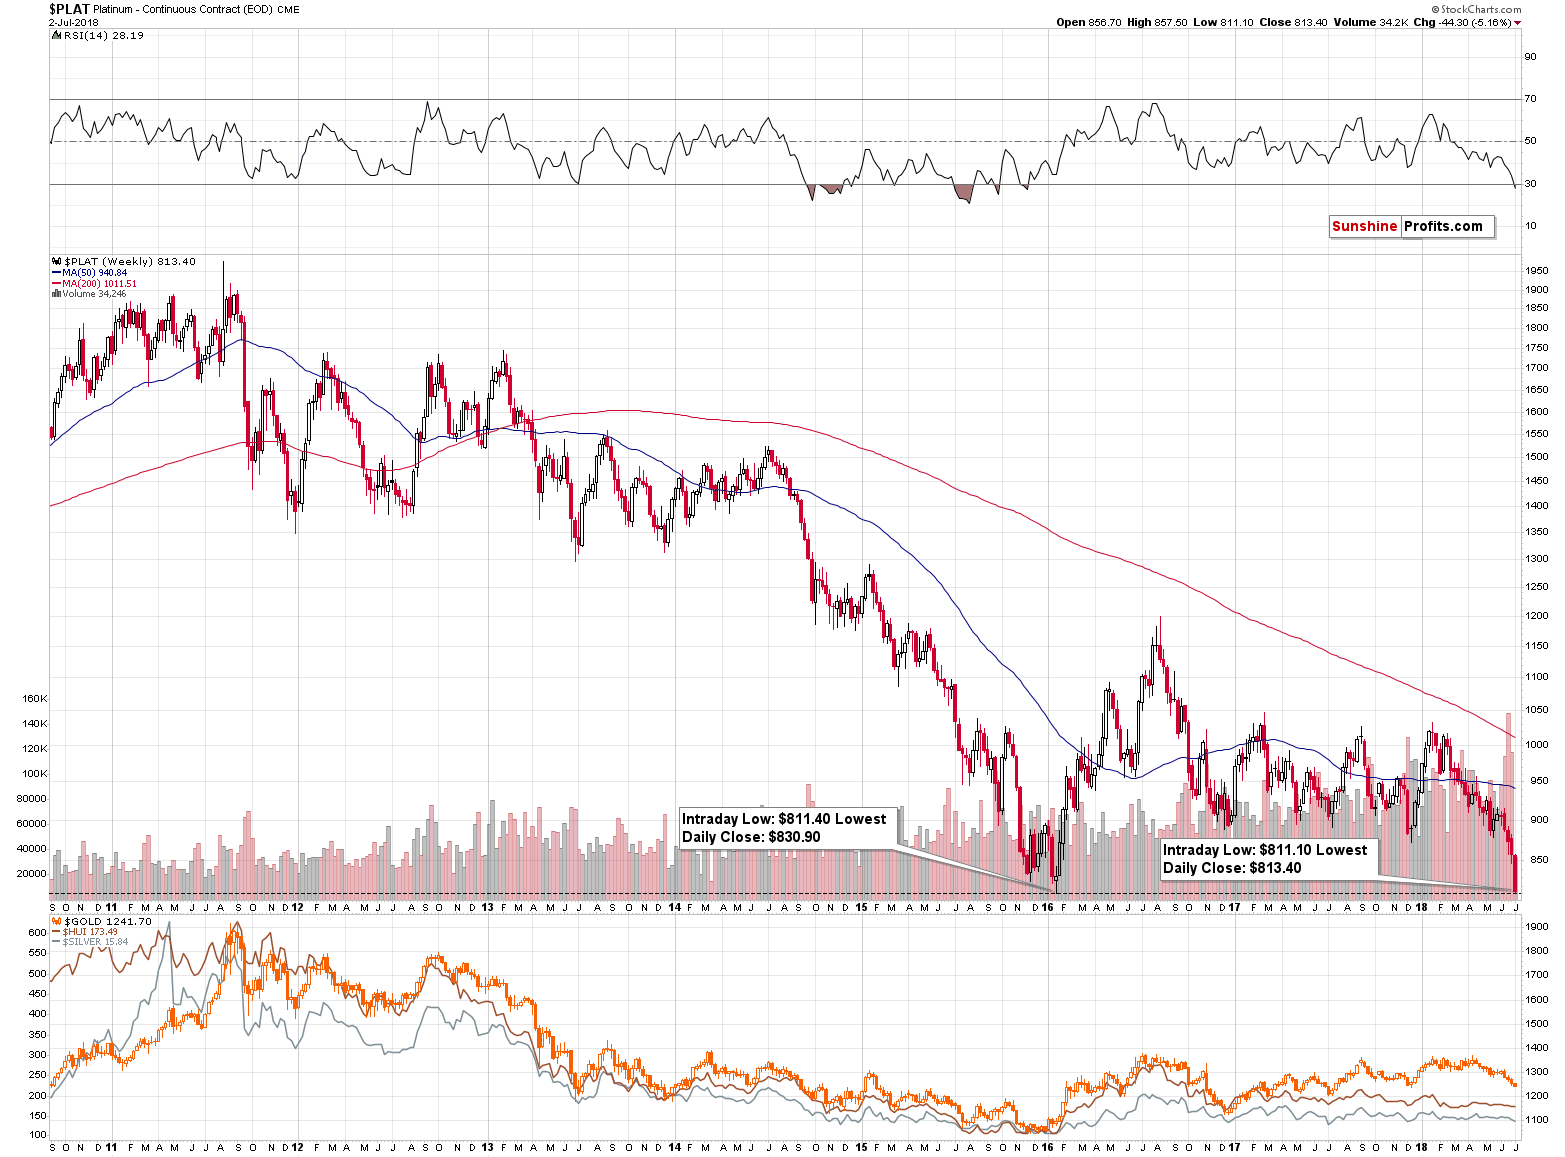
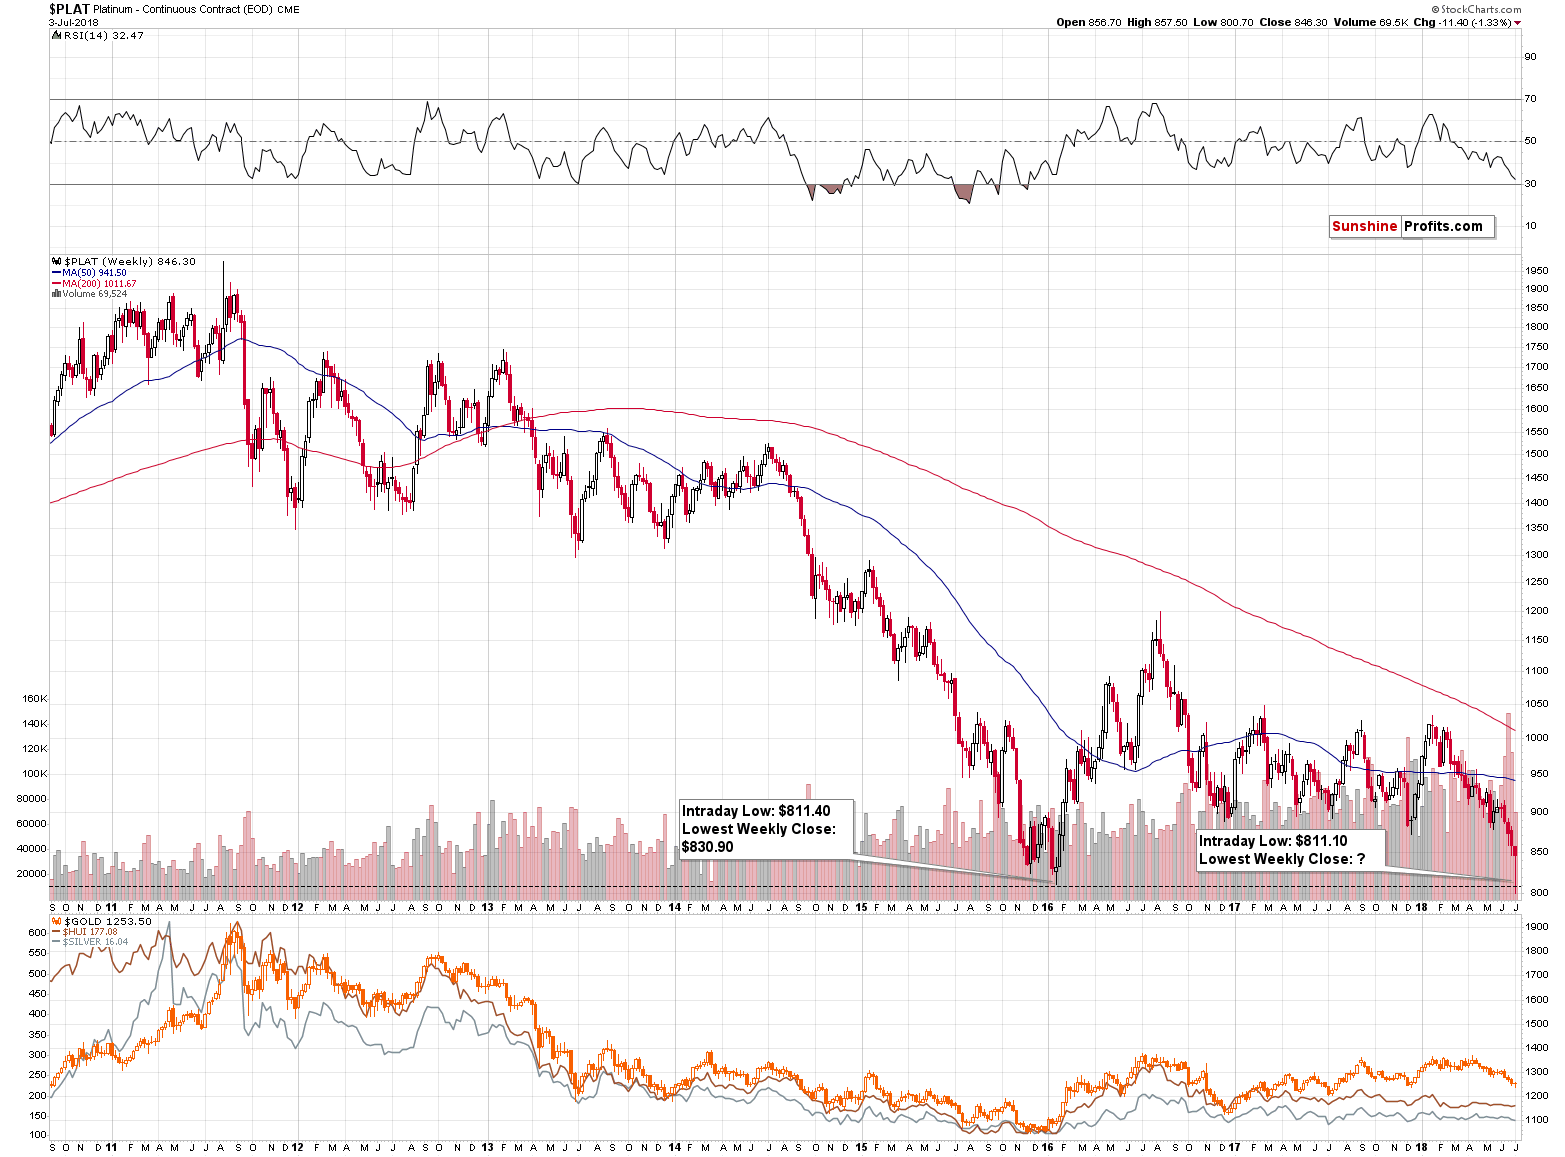
The above is the weekly chart that we had available on Tuesday and the chart below is what we see today.
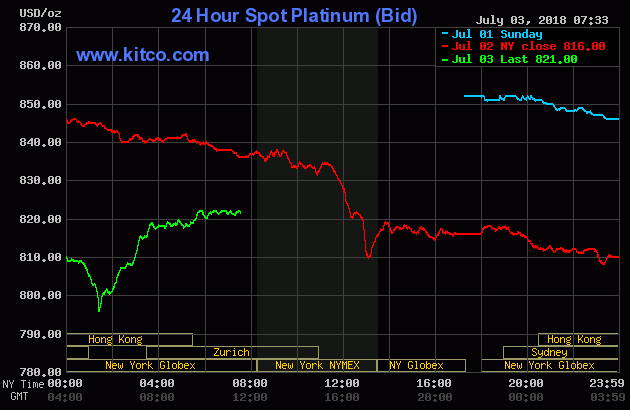
As far as intraday performances are concerned, here’s what we saw on Tuesday:
And that’s what we have right now:
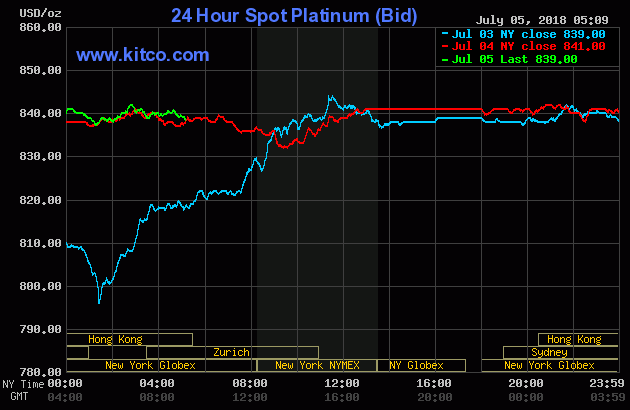
From both: the long-term and very short-term perspectives, the decline and the breakdowns below the previous low of $811.40 (intraday), $830.90 (lowest weekly closing price), and the round $800 level were clearly invalidated.
In Tuesday’s Alert, we wrote the following:
Platinum moved even a bit below $800 in the overnight trading and it rallied back up – above $800 and above the 2016 intraday low. If it closes today’s session above $830.90, the breakdown will be fully invalidated in from both perspectives: intraday and in terms of closing prices.
Platinum is already after about a $25 overnight rally and only $10 below the above-mentioned level and it seems that the above-mentioned invalidation is likely.
It happened; and the implications are bullish.
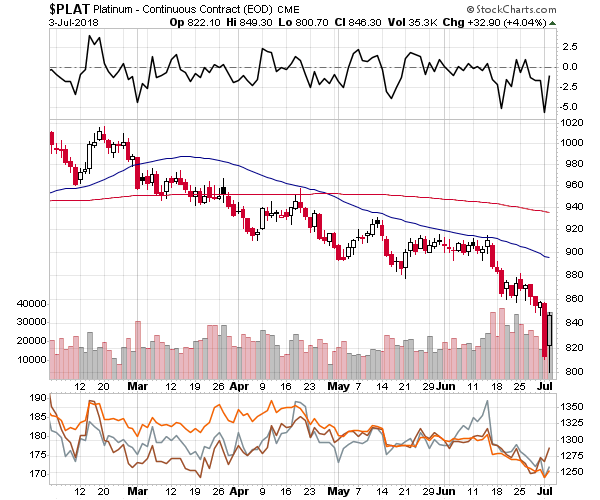
Moreover, it took place on huge volume, which adds a lot of credibility to the bullish implications of the reversal.
Unless one had read our analysis, the previous implications seemed rather bearish for the rest of the precious metals market, but now they are clearly bullish.
We previously explained why situation in platinum is likely to impact the rest of the sector and it seems that quoting this explanation will be useful also today:
The answer is: contagion effect and representativeness bias. The above links provide complex definitions, but to make a long story short, when people see that a part of a given market is failing, they start viewing the entire market as failing and they start selling, thus making this market really fail.
For instance, there are no major economic links between Argentina and Poland, but both economies are somewhat similar and they are both viewed as emerging markets. Crisis in Argentina shouldn’t have any impact on the exchange rate between the USD and the PLN (Polish Złoty – “Złoty” means “Golden” by the way). But it would. Crisis in Argentina would make investors view “emerging markets” as risky in general without them paying attention to details. They would just exit the emerging markets regardless of whether it really made economic sense with regard to countries other than Argentina. In this case, the investors who had previously used dollars to buy Polish equities or other assets, would likely sell them and then want to get back into the USD.
In our case, platinum declined profoundly and it likely took gold and silver with it, through the above-mentioned effects.
If platinum kept on declining, the negative impact on the rest of the precious metals sector could persist, or slowly fade away. But, it’s likely that this effect will be reversed due to two reasons:
- Platinum’s decline was most likely a news-based effect and such effects are usually only temporary
- Platinum already invalidated the breakdown in intraday terms and it seems likely that it will invalidate the one in terms of closing prices as well.
The likely direct reason behind platinum’s slide is the Car-tariff threat. You can read the full story here and the long story short version is that there is a threat of a trade war between the US and the EU with regard to cars. The EU exported $43.6 billion worth of cars to the US in 2017, while $7.2 billion worth of cars were exported to the EU from the US. Consequently, the trade war with regard to cars would likely result in less demand for European cars but bigger demand for US cars (US domestic demand would likely increase if cars from the EU became more expensive to the end users).
Gasoline cars dominate the US market, while diesel cars dominate the EU market. Consequently, the above implies significantly less demand for the diesel cars and since platinum is used in catalysts for diesel engines, the above means smaller demand for platinum. Therefore, the price dropped.
The markets are forward looking and thus they already discounted the above in the price to some extent, but let’s keep in mind that the risk of a trade war is not the same as an actual trade war. This is especially the case, since President Trump is known to change his mind relatively quickly. Consequently, in our view, market overreacted to what really changed.
The situation is similar to what happened in the USD Index in January. Back then Treasury Secretary Steven Mnuchin signaled that a weak greenback is good for trade, which shocked the markets as that was exactly the opposite of what a Treasury Secretary is supposed to say. The USD Index declined profoundly because of this and it even briefly moved below the key long-term support levels.
But, this breakdown was quickly invalidated (and so was the “megaphone pattern”) and it turned out that it was actually a beginning of a rally, not a decline.
We have something similar in platinum – big, news-driven decline after a decline and an invalidation of the breakdown below the key long-term support level. The implications are bullish, not bearish.
What does it imply to gold, silver and mining stocks? That yesterday’s decline was somewhat artificial and it should not be taken at face value. Consequently, even though the silver’s short-term chart doesn’t look favorable, it doesn’t mean that it changed the outlook. The same goes for other factors that might appear bearish based solely on yesterday’s session.
In fact, knowing what was likely behind yesterday’s price declines and seeing how this bearish factor is likely to become a bullish one serves as yet another bullish sign that further confirms our long position.
So, just as the above effects might have contributed to lower prices of gold, silver and gold and silver mining stocks, they are now likely to be bullish factors.
We can already see the results.
Gold’s Bottoming Pattern
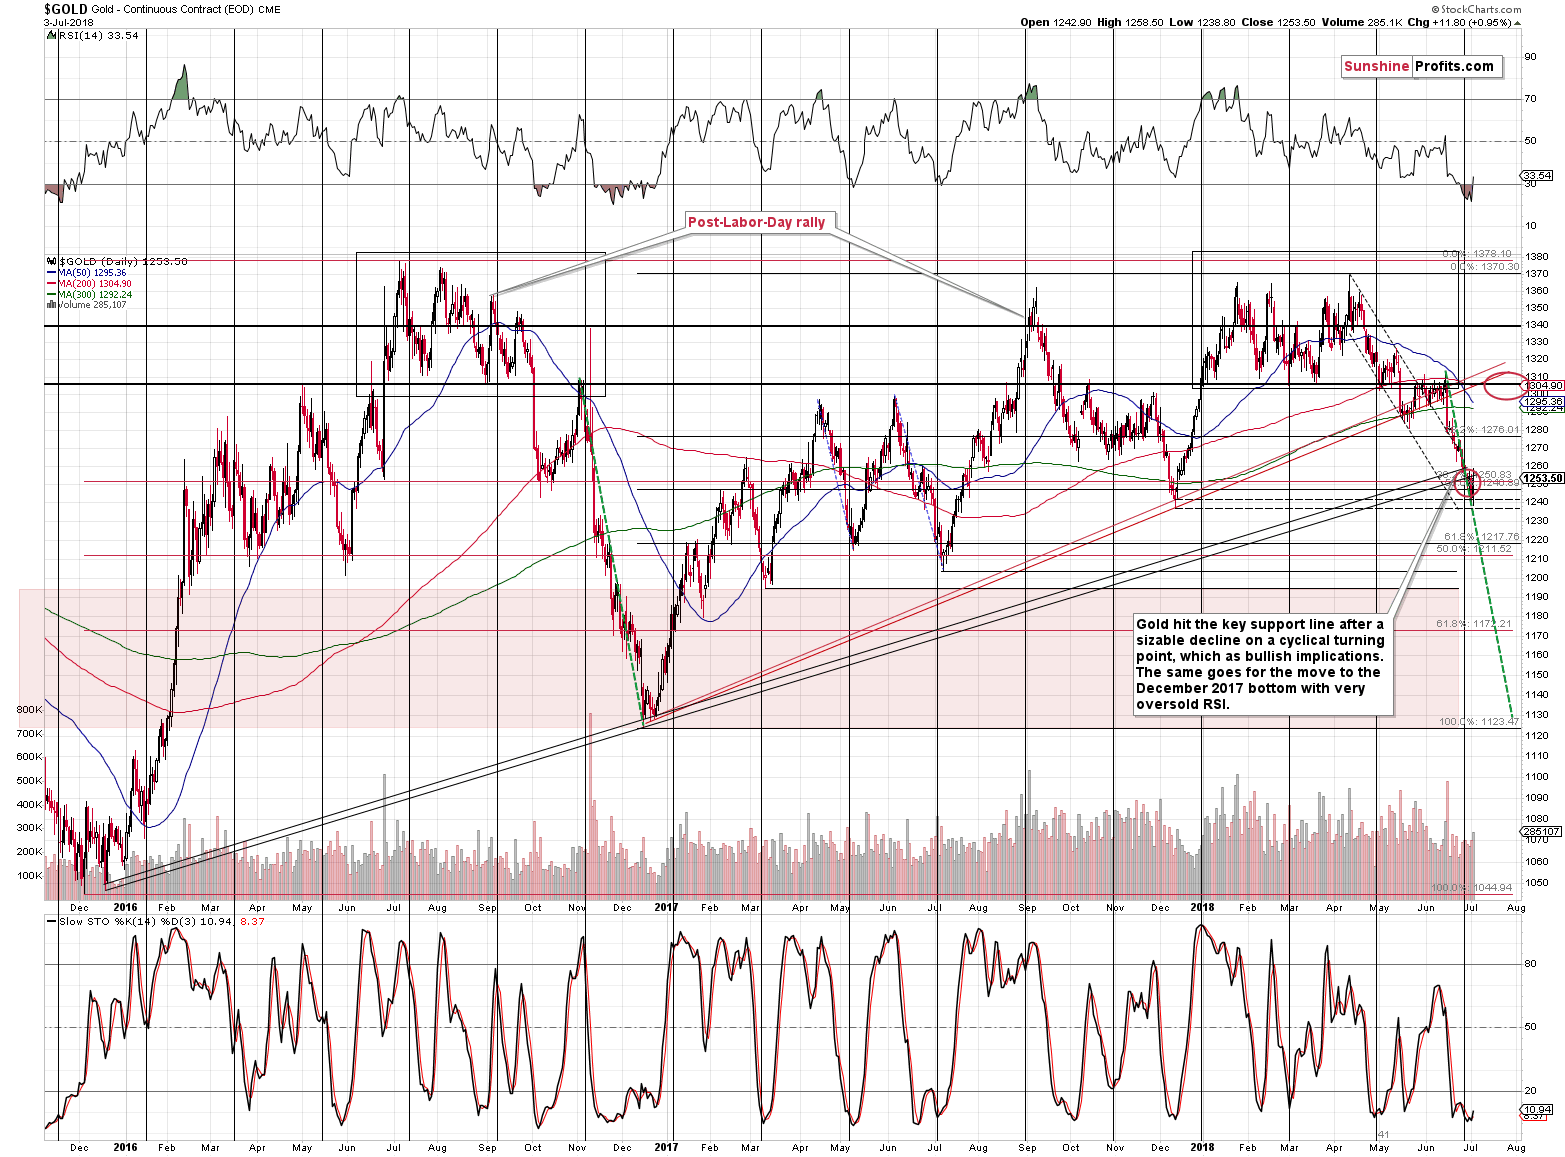
Gold moved only a bit below our target area before it rallied back up. Overall, technical levels are critical when determining how high or low can the price go, but if something unexpected happens (like the car-tariff news that just affected platinum) these levels can be breached temporarily. Unless the breach is major, it’s unlikely that the technically-driven (a.k.a. sentiment-driven) moves are going to be invalidated. The above chart serves as a great example. The outlook remains bullish and almost perfectly in tune with the technical patterns – the news-based decline was only able to trigger a small anomaly.
Silver’s Small Comeback
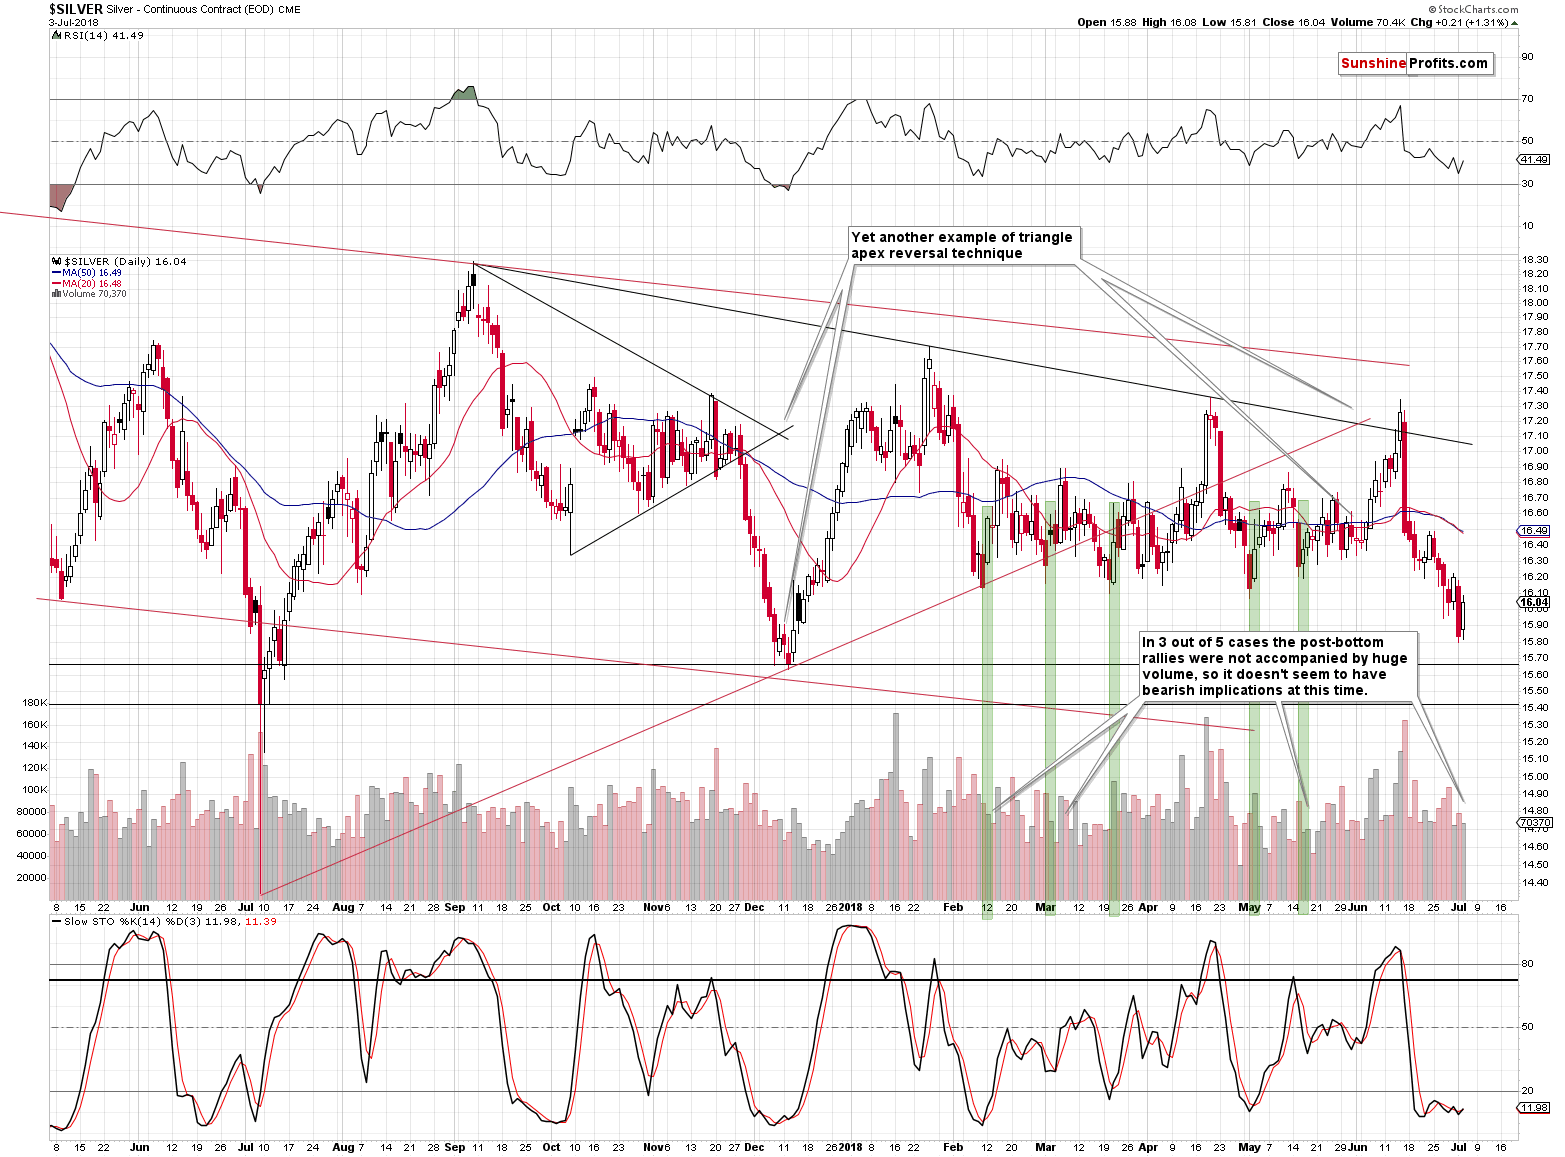
In our previous alert, we commented on the above chart in the following way:
Silver decline on volume that was slightly higher than what we had seen on Friday, which is bearish. The fact that silver broke below the previous lows and closed visibly below them is also bearish. In yesterday’s alert, we wrote that at times silver started its post-bottom rally with low volume, so it was not something to be concerned with. Yet, in all these cases (mid-February, early March, mid-May) the following downswing didn’t take silver to new lows and it didn’t take place on higher volume. Consequently, the analogy to the cases marked with green rectangles on the above chart is no longer up-to-date.
All in all, the implications of the above chart have deteriorated significantly based on yesterday’s session.
The move higher that we saw was in tune with our overall expectations, but we admit that silver was not as strong as gold or mining stocks were. Does it change the bullish implications for the short term?
Not at all. When miners are getting ahead of gold and silver is lagging, it suggests that the move is beginning – not ending. This means that the rally has further to go and thus, the overall outlook is bullish.
Mining Stocks’ Strong Performance
Speaking of miners, let’s see how well they did during the rebound.
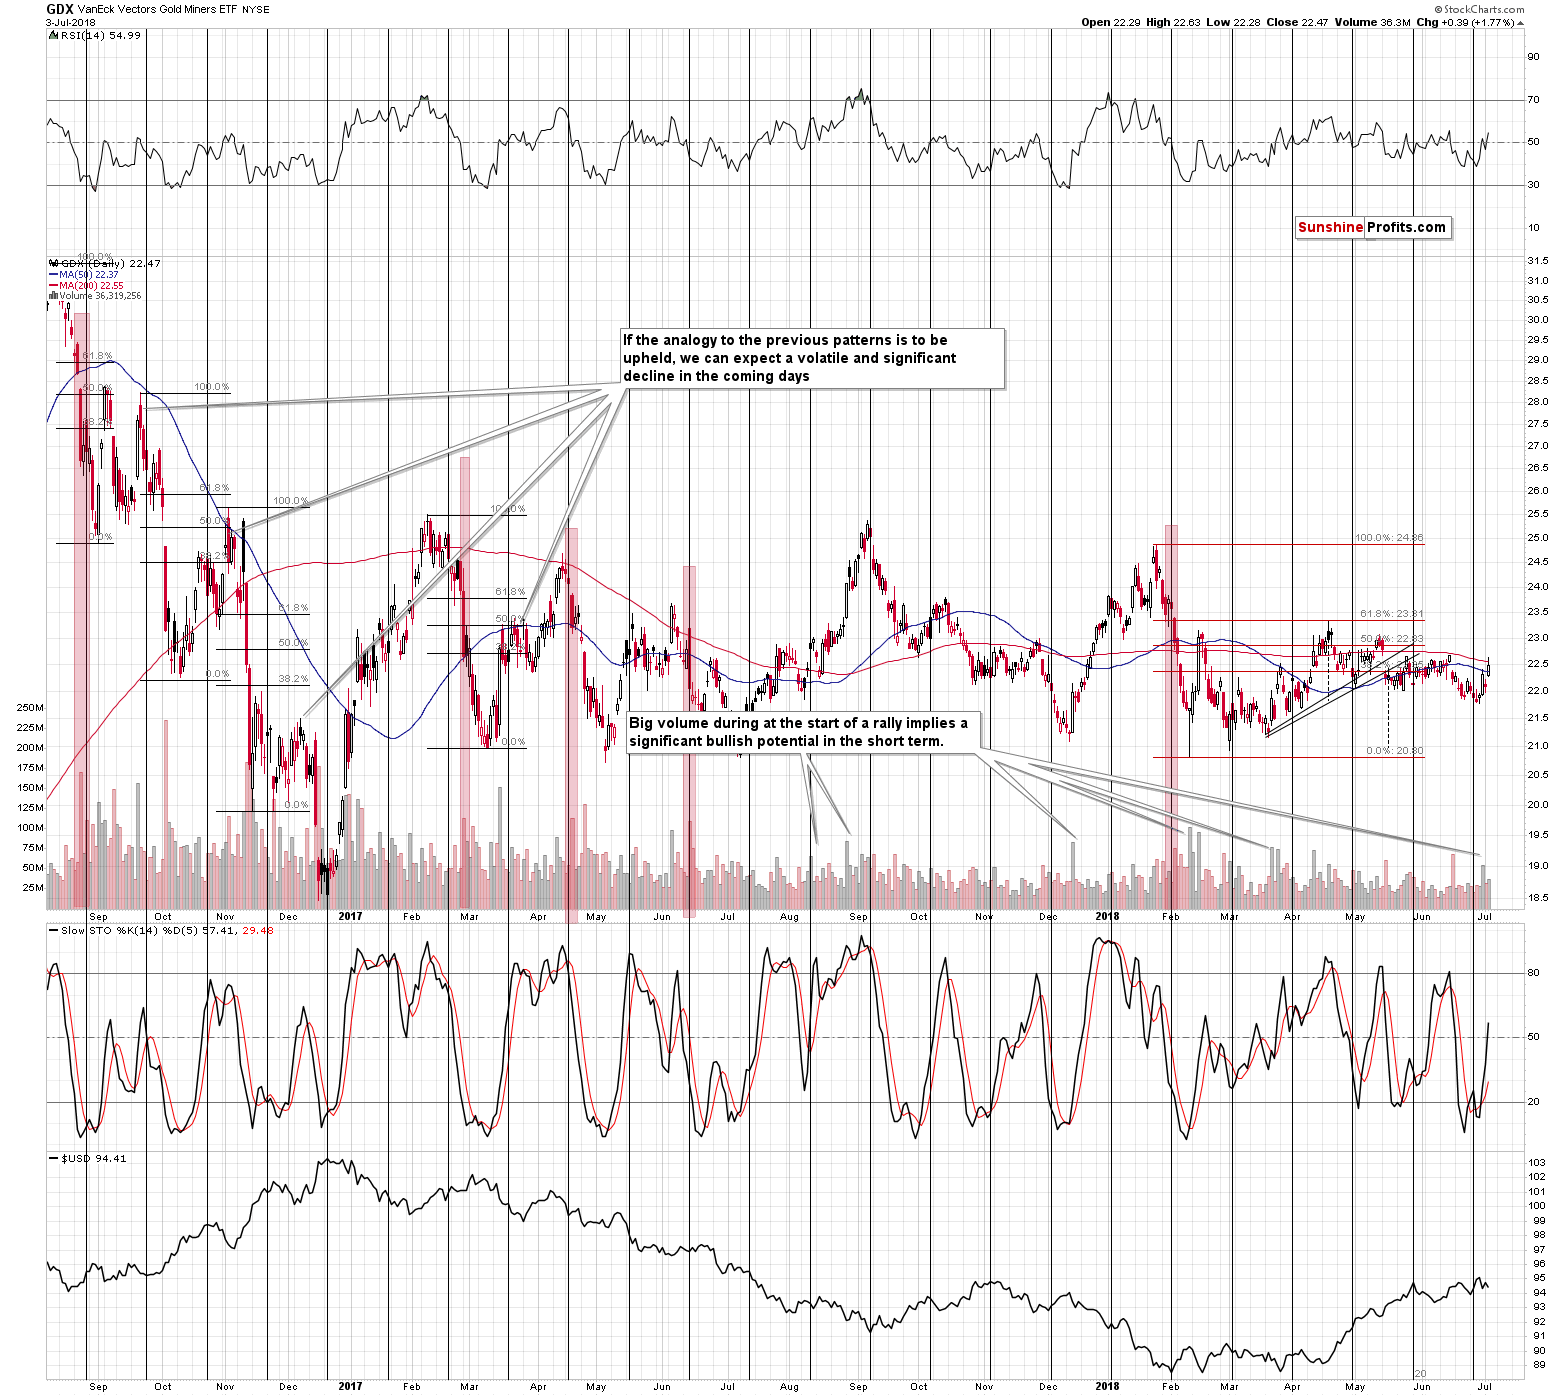
In short, they just moved to new monthly highs and almost above June highs. This may be shocking as gold’s June high is above $1,300, but that’s exactly what happened.
After bottoming almost right at their and gold’s cyclical turning point, miners rallied and they keep on showing strength, while silver was rather weak. Again, that is a bullish combination and it makes us expect even higher prices for mining stocks in the near future. At this time we are not ruling out a re-test of the April highs, which would be another move to the 61.8% Fibonacci retracement based on the January – February decline.
The volume that accompanied Tuesday’s rally was sizable enough to confirm the overall bullish implications. At the same time, it doesn’t seem exceptional enough to indicate a turnaround (Tuesday’s session looks somewhat like a daily reversal), so the long positions seem more than justified at this time.
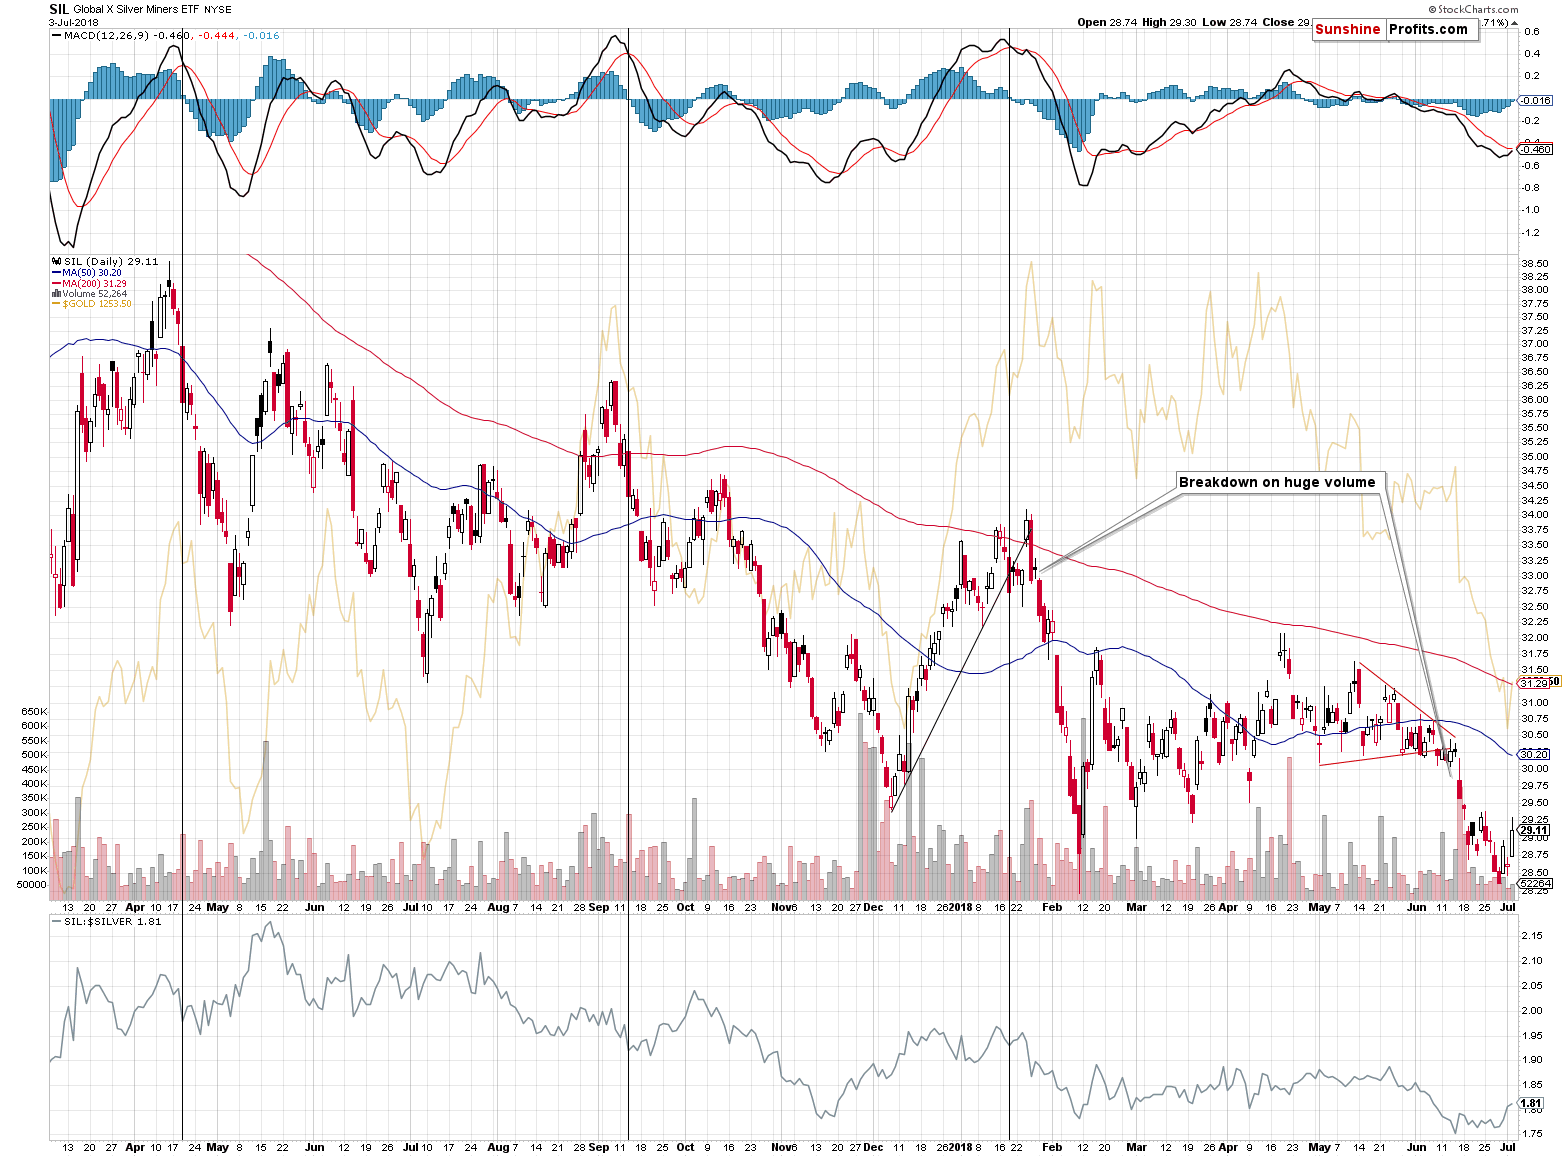
We can see strong performance in the case of silver stocks as well. The silver miners’ weak performance was one of the very visible signals that confirmed the bearish outlook several weeks ago. Now, it’s the opposite. The SIL ETF just invalidated the breakdown below its February lows (in terms of daily closing prices) and rallied back to its late-June highs. This strength has bullish implications for the entire precious metals sector.
Having said the above, let’s examine the most interesting chart that we have for you today.
Long-term Signal from Gold Stocks to Gold Ratio
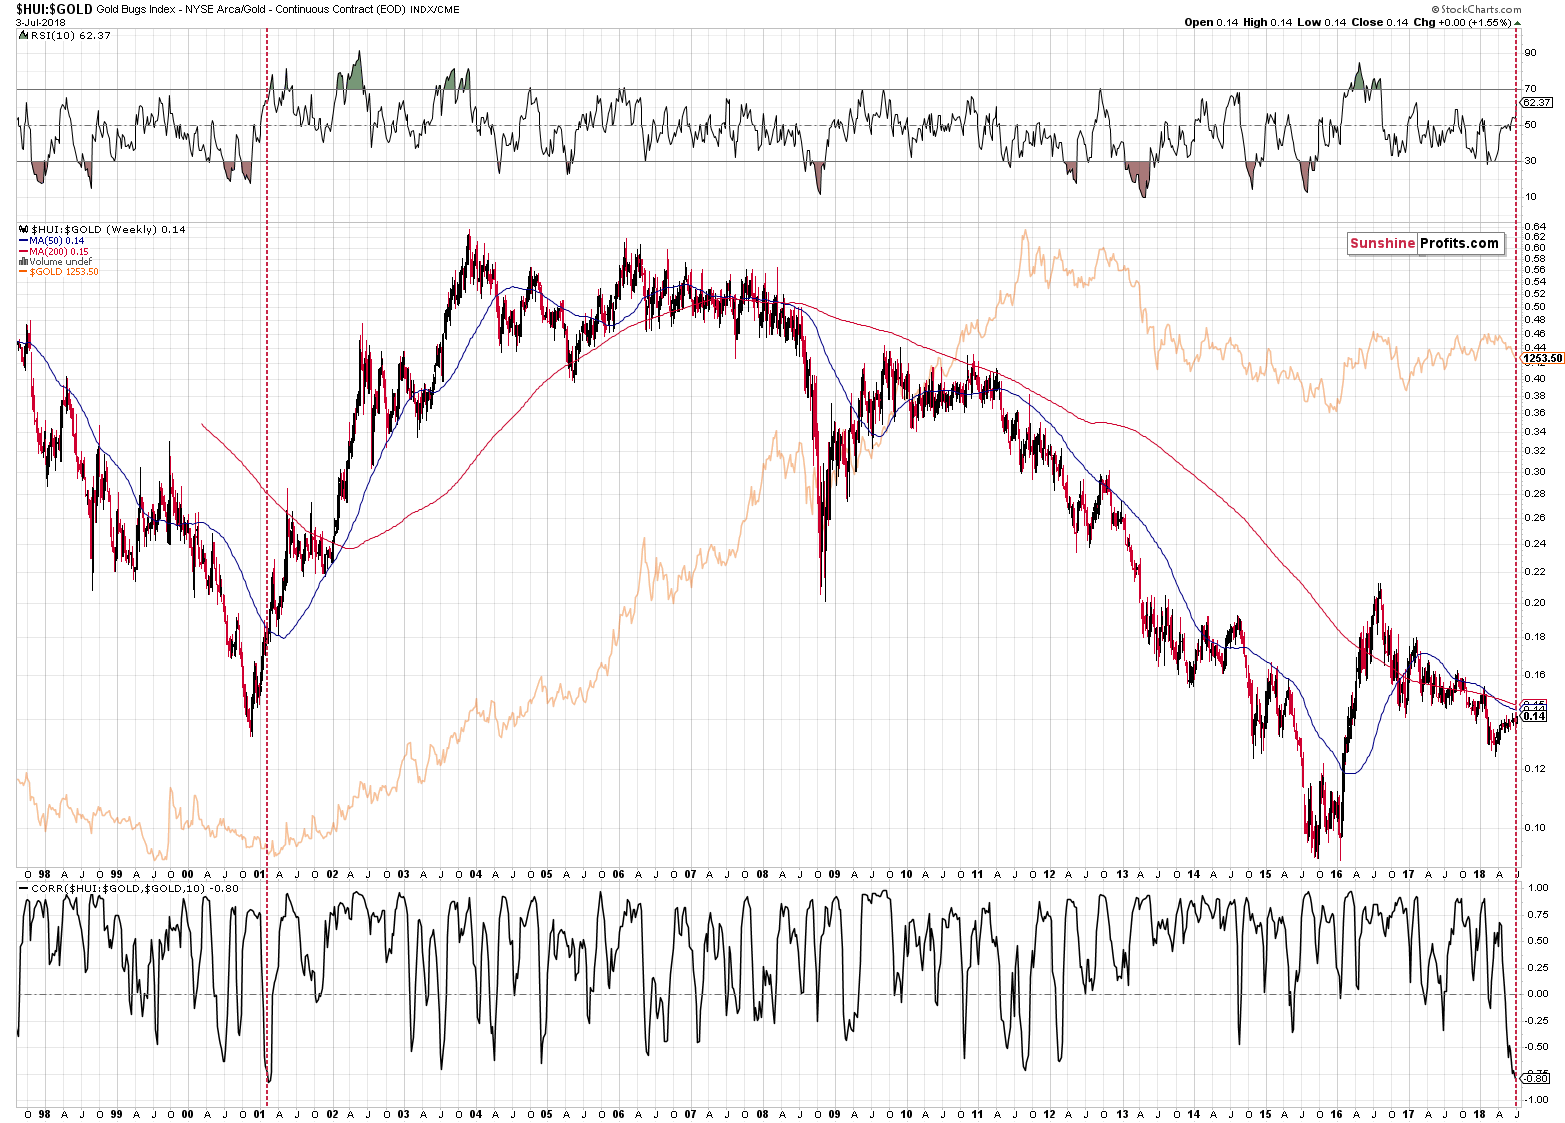
Gold stocks tend to outperform gold during rallies and quite often underperform gold during gold’s declines and this phenomenon is more visible in the short term than it is in the medium or long term.
But what if gold stocks outperformed gold during gold’s decline? Can that happen? It definitely can, because that’s what we’ve been seeing in the past several weeks. So, the question becomes, if that happened regularly in the past and if so, if similar developments followed. If that was indeed the case, then we might be expecting a similar outcome also this time.
The above long-term chart shows the gold stocks to gold ratio and in the background we have the price of gold. There were very few cases when the ratio moved higher along with gold’s decline. To emphasize them, we used two indicators: the RSI and the linear correlation coefficient. The former shows the excess of the move in the ratio and the latter shows if – in the past 10 weeks – the ratio and gold moved on average in the same or in the opposite direction (values close to -1 mean the opposite direction and values close to 1 mean the same direction, while values close to 0 mean no clear link).
The latter indicator (correlation) is more important, because the RSI will show all cases when the ratio moved substantially higher and as we wrote previously, that’s what we usually see during rallies. What makes the current case so special is that we see it during a decline. Therefore, one needs to begin with the lower part of the chart.
The correlation coefficient is currently -0.8, which means that the correlation is negative. The shocking thing is that it was this negative only one time in the past – in early 2001, right after the multi-year bottom. The ratio, gold, and gold stocks all rallied after we saw this reading. At that time gold was well below $300 and the HUI Index was trading close to 50. A bit more than a year later the HUI formed a short-term top above 150.
Given this kind of performance, what action should one take right away?
None.
What?! Didn’t you just say that gold stocks are going to soar?
We didn’t. Being on a constant lookout for signals that might invalidate our bearish outlook for the medium term, we made an observation, we emphasized the similarity to the previous situation and we wrote what followed that single situation from the past. But (unlike what gold promoters would have you believe without analyzing the situation thoroughly) this is not enough to draw implications and we haven’t done so.
The long story short version of the explanation is that one swallow does not make a summer. The more detailed explanation is that the above similarity alone is not powerful enough to change the medium-term outlook due to three reasons.
First, just because the correlation coefficient dropped to -0.8 doesn’t mean that the situation is much different from the situations in which it dropped to -0.75, -0.7 or so. The key thing is that it dropped visibly below 0, while the ratio and the RSI rallied. If we take this broader set of circumstances into account, we get two additional similarities: the mid-2003 drop in the correlation coefficient and the mid-2014 drop. The former was followed by a 6-month rally (approximately) and the latter was followed by a continuation of the decline in gold and – especially – in the gold stocks and the ratio, which ultimately lead to the final bottom.
So, overall, we have 3 similarities to the current situation, not just one. In one case it was an epic bottom, in one case it was a medium-term bottom and in one case it was a good shorting opportunity and a moment at which one would not want to be invested in the precious metals market.
2 out of 3 cases that were followed by higher prices may seem bullish, but it’s actually close to 50/50 performance, so overall, this signal doesn’t seem really to tell us much. Let’s quote what we wrote above:
So, the question becomes, if that happened regularly in the past and if so, if similar developments followed. If that was indeed the case, then we might be expecting a similar outcome also this time.
There were only three cases, which is not really regular and they were not followed by the same outcome. Therefore, we shouldn’t infer much from this analogy.
Second, even if we take the approach in which we should compare just one (2001) similar case, we will end up with mixed or bullish implications if we look closely enough. The reason is that the early 2001 similarity – as marked with the vertical red dashed line – was what preceded a short-term rally in gold and then a move to new lows in a few months. The size of the projected downswing is currently different, but overall, that’s more or less what we’re expecting to see right now. So, are the implications really bullish for the medium term? Not necessarily – we might say that we are close to the bottom in terms of time (months), but not at it just yet and that we are about to see a short-term rally.
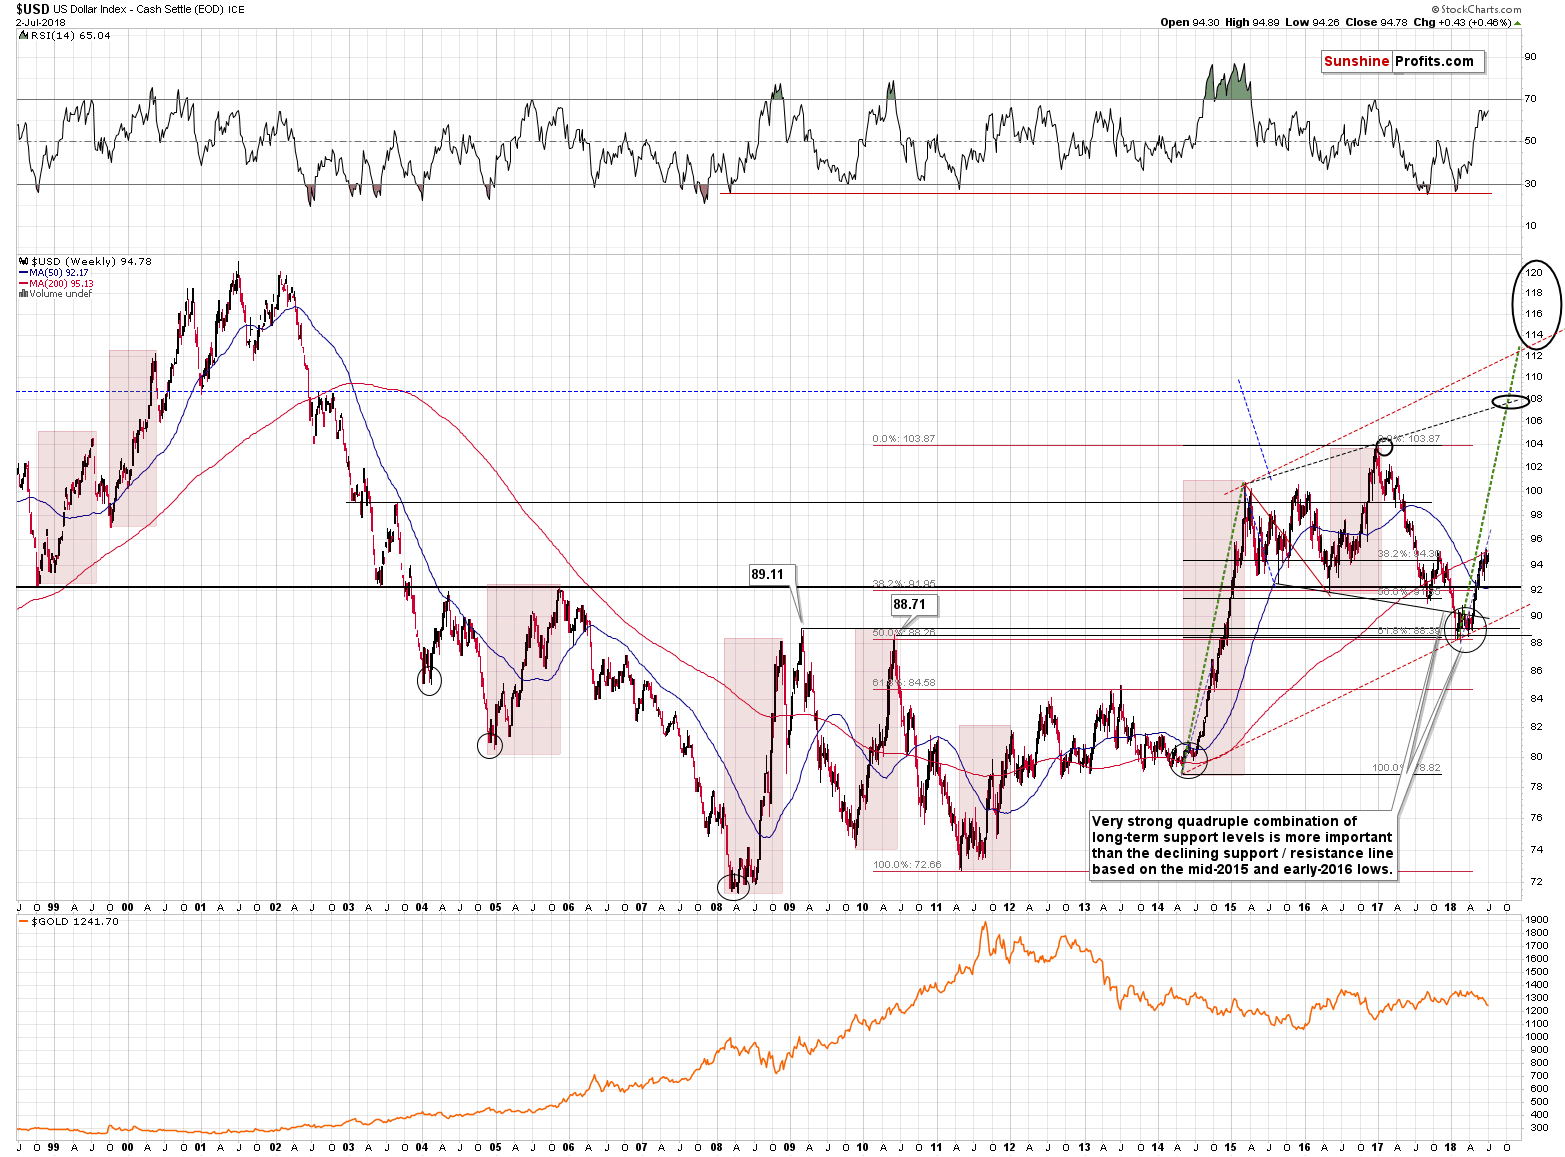
Third, this analogy is just one factor and there are many more that one needs to consider at the same time before making the final judgement on whether PMs are about to rally or not. The USD Index is likely to soar in the medium term, the very low volatility in gold and silver suggests that much lower prices are on the horizon, gold’s analogy to the previous bear market and USDX’s key breakout and the analogy to the 2012-2013 decline all point to much lower PM prices in the following months, not to mention less prominent signals.
Overall, even though it may seem that the gold stocks to gold ratio is indicating an epic buying opportunity, it seems much more likely that it’s indicating only a short-term bottom.
Summary
Summing up, the seemingly bearish sign from platinum is now a clearly bullish factor and the bullish outlook for the short term seems even more justified than it was before this week. The multiple bullish signs that we have right now continue to confirm that the next short-term direction in which the precious metals market is likely to move is up.
At the same time, we want to emphasize that even though we have a single bullish sign for the long term, it doesn’t mean that the entire big picture has changed. The other long-term signals that point to lower prices all continue to have very bearish implications for the following months. This includes the multiple analogies to the 2012-2013 decline, the similarity to the situation before the final decline almost 20 years ago, and the very bullish outlook for the USD Index in the medium term (we might see a downswing in the next several days, though).
As always, we’ll keep you – our subscribers – informed.
To summarize:
Trading capital (supplementary part of the portfolio; our opinion): Full long positions (200% of the full position) in gold, silver and mining stocks are justified from the risk/reward perspective with the following stop-loss orders and initial target price levels:
- Gold: initial target price: $1,298; stop-loss: $1,228; initial target price for the UGLD ETN: $10.37; stop-loss for the UGLD ETN $8.67
- Silver: initial target price: $16.72; stop-loss: $15.57; initial target price for the USLV ETN: $10.47; stop-loss for the USLV ETN $8.47
- Mining stocks (price levels for the GDX ETF): initial target price: $22.97; stop-loss: $21.47; initial target price for the NUGT ETF: $26.17; stop-loss for the NUGT ETF $21.84
In case one wants to bet on junior mining stocks' prices (we do not suggest doing so – we think senior mining stocks are more predictable in the case of short-term trades – but if one wants to do it anyway, we provide the details), here are the stop-loss details and initial target prices:
- GDXJ ETF: initial target price: $33.57; stop-loss: $31.58
- JNUG ETF: initial target price: $14.58 stop-loss: $12.38
Long-term capital (core part of the portfolio; our opinion): No positions (in other words: cash)
Insurance capital (core part of the portfolio; our opinion): Full position
Important Details for New Subscribers
Whether you already subscribed or not, we encourage you to find out how to make the most of our alerts and read our replies to the most common alert-and-gold-trading-related-questions.
Please note that the in the trading section we describe the situation for the day that the alert is posted. In other words, it we are writing about a speculative position, it means that it is up-to-date on the day it was posted. We are also featuring the initial target prices, so that you can decide whether keeping a position on a given day is something that is in tune with your approach (some moves are too small for medium-term traders and some might appear too big for day-traders).
Plus, you might want to read why our stop-loss orders are usually relatively far from the current price.
Please note that a full position doesn’t mean using all of the capital for a given trade. You will find details on our thoughts on gold portfolio structuring in the Key Insights section on our website.
As a reminder – “initial target price” means exactly that – an “initial” one, it’s not a price level at which we suggest closing positions. If this becomes the case (like it did in the previous trade) we will refer to these levels as levels of exit orders (exactly as we’ve done previously). Stop-loss levels, however, are naturally not “initial”, but something that, in our opinion, might be entered as an order.
Since it is impossible to synchronize target prices and stop-loss levels for all the ETFs and ETNs with the main markets that we provide these levels for (gold, silver and mining stocks – the GDX ETF), the stop-loss levels and target prices for other ETNs and ETF (among other: UGLD, DGLD, USLV, DSLV, NUGT, DUST, JNUG, JDST) are provided as supplementary, and not as “final”. This means that if a stop-loss or a target level is reached for any of the “additional instruments” (DGLD for instance), but not for the “main instrument” (gold in this case), we will view positions in both gold and DGLD as still open and the stop-loss for DGLD would have to be moved lower. On the other hand, if gold moves to a stop-loss level but DGLD doesn’t, then we will view both positions (in gold and DGLD) as closed. In other words, since it’s not possible to be 100% certain that each related instrument moves to a given level when the underlying instrument does, we can’t provide levels that would be binding. The levels that we do provide are our best estimate of the levels that will correspond to the levels in the underlying assets, but it will be the underlying assets that one will need to focus on regarding the signs pointing to closing a given position or keeping it open. We might adjust the levels in the “additional instruments” without adjusting the levels in the “main instruments”, which will simply mean that we have improved our estimation of these levels, not that we changed our outlook on the markets. We are already working on a tool that would update these levels on a daily basis for the most popular ETFs, ETNs and individual mining stocks.
Our preferred ways to invest in and to trade gold along with the reasoning can be found in the how to buy gold section. Additionally, our preferred ETFs and ETNs can be found in our Gold & Silver ETF Ranking.
As a reminder, Gold & Silver Trading Alerts are posted before or on each trading day (we usually post them before the opening bell, but we don't promise doing that each day). If there's anything urgent, we will send you an additional small alert before posting the main one.
=====
Latest Free Trading Alerts:
Finally! The core PCE Index hit the Fed’s 2-percent target for the first time in six years. Does this mean a revolution in American monetary policy? And what about the yellow metal?
Fed Completed Its Task. And Gold?
There were some positive expectations ahead of the opening of Tuesday's trading session, but then stocks reversed their intraday advance and closed lower. The broad stock market continues to trade within a short-term consolidation. Which direction is next? There are still two possible medium-term scenarios.
Still No Clear Direction, but S&P 500 Remains Above 2,700
=====
Hand-picked precious-metals-related links:
PRECIOUS-Gold slips ahead of Fed minutes despite softer dollar
Freeport operating permit for Grasberg extended until end of July
=====
In other news:
Want to Win the Trade War? Long the Dollar
Europe Stocks Climb With U.S. Futures; Euro Rises: Markets Wrap
Asian equities extend losses on eve of U.S. tariff deadline
May Fights for Brexit Plan as Austria Raises Idea of Extension
=====
Thank you.
Sincerely,
Przemyslaw Radomski, CFA
Founder, Editor-in-chief, Gold & Silver Fund Manager
Gold & Silver Trading Alerts
Forex Trading Alerts
Oil Investment Updates
Oil Trading Alerts

