

Briefly: In our opinion, full (200% of the regular size of the position) speculative short positions in gold, silver and mining stocks are justified from the risk/reward perspective at the moment of publishing this alert. We may close or adjust these positions shortly.
The USD Index reversed in a quite clear way on Friday and gold rallied. It looked like a great bullish combination for the precious metals sector, but was it really one? Gold moved higher on volume that was lowest since the beginning of the year and this means that Friday’s rally shouldn’t be taken at its face value, but instead it should be closely inspected. Moreover, silver just did what was previously followed by big and volatile price moves in all recent cases. What can we really infer from it?
Let’s take a closer look (chart courtesy of http://stockcharts.com).
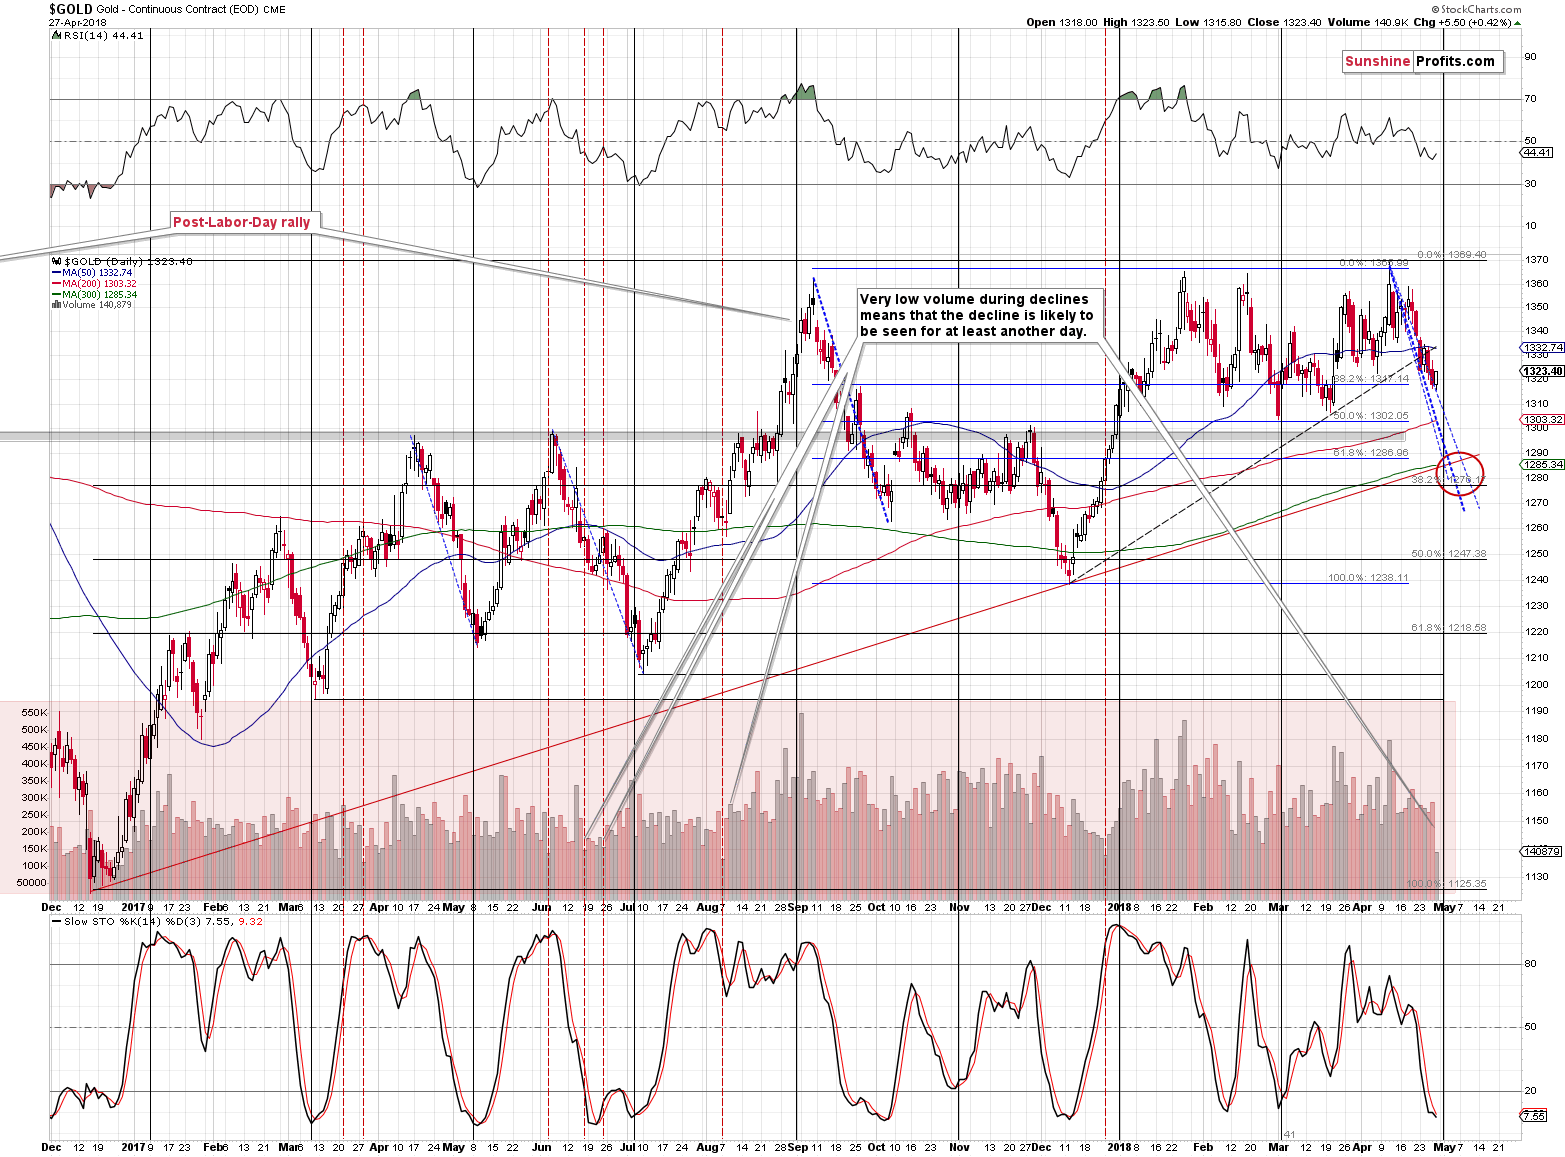
The implications of the low volume are entirely different depending on the price action that preceded it and the above chart shows it. In general, very low volume during an upswing is a bearish signal, but before accepting what’s usually the case, let’s check if this is indeed the case for the gold market. After all, recklessly applying the general rules like assuming that a rally in silver is bullish (as most analysts do) can be very misleading.
We marked all very-low-volume cases on the above chart with red dashed vertical lines. Some of them were seen after a rally and some of them were seen after a decline. On average, nothing specific happened after the low-volume sessions but if you focus on the days when we saw very low volume after a decline, we see a specific pattern. In all cases, gold declined on the following day.
Therefore, the price-volume action that we saw on Friday supports the bearish outlook, at least for today. That’s important, because the cyclical turning point is just around the corner and thus one could expect some kind of rebound this week.
The session was even more specific in the case of the silver market.
The Silver Similarity
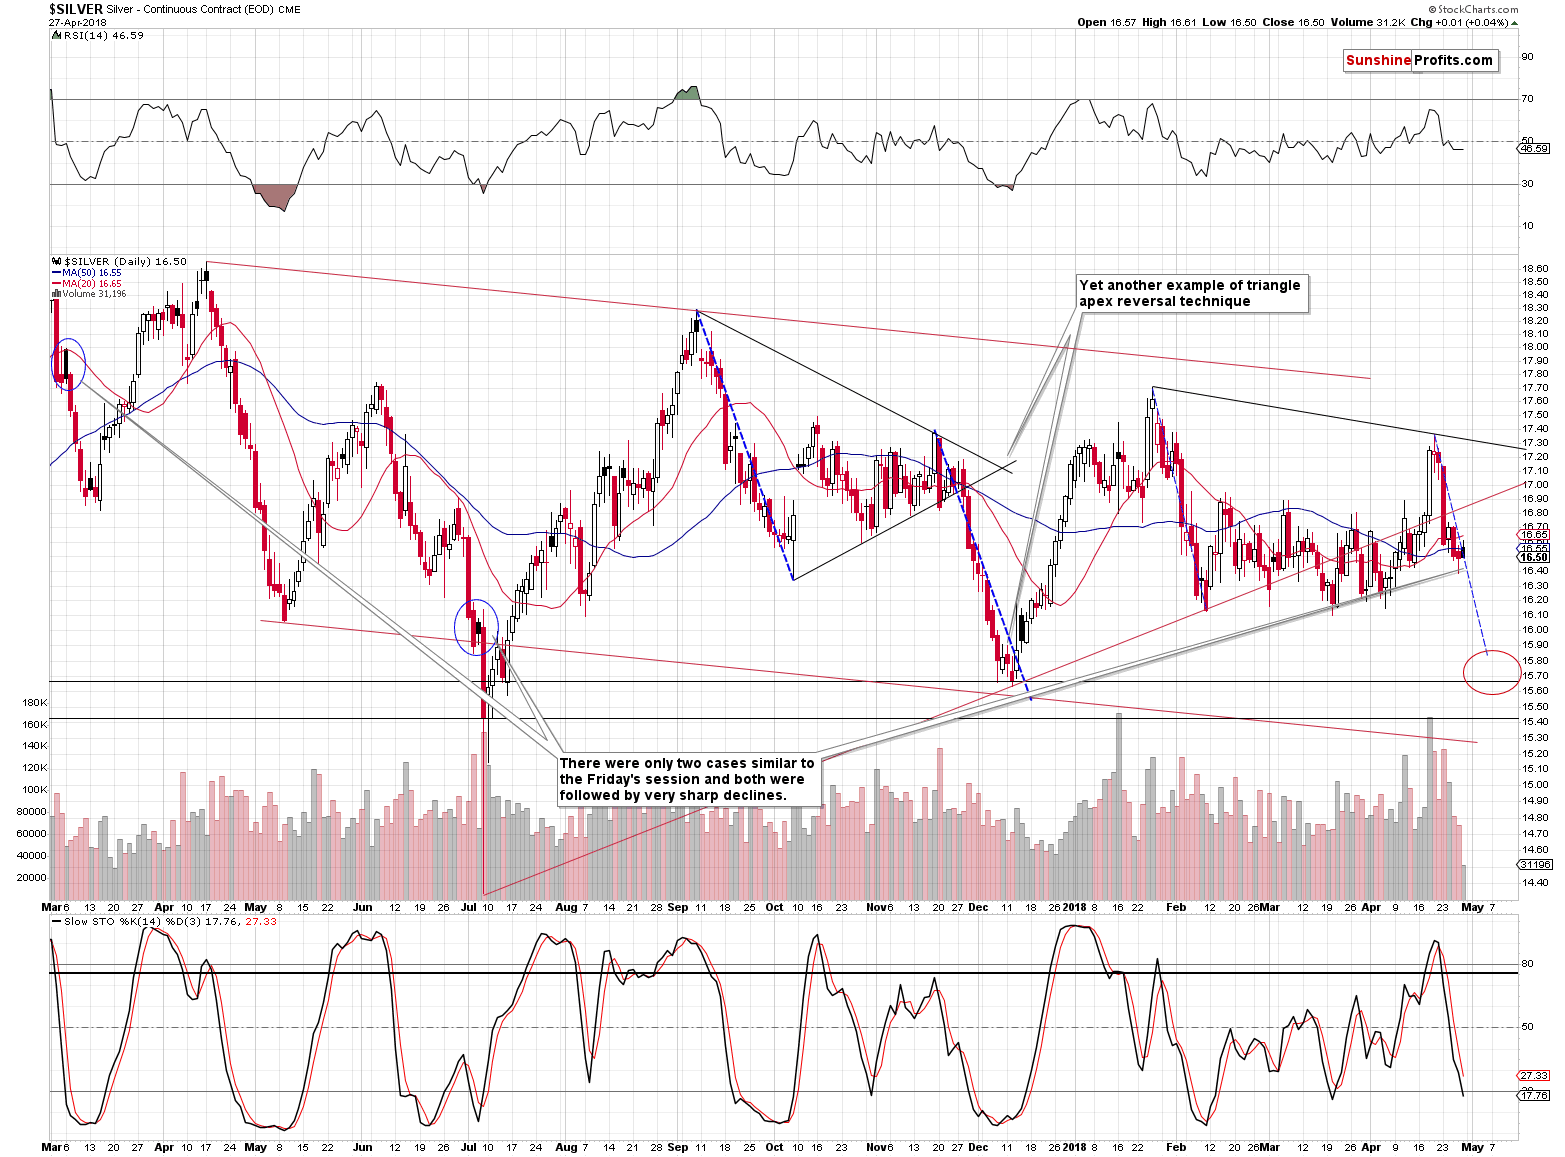
The white metal ended the session a bit higher than on Thursday (thus rallying one cent), but it also closed below Friday’s opening price (thus declining on an intraday basis). The Stockcharts website marks such sessions in black. There were only two situations in the recent past when the white metal formed similar candlesticks immediately after a volatile decline: in early March 2017 and in early July 2017.
In both cases, silver declined very significantly in the following days. In particular, in July, silver plunged several dollars in just one day.
The implications are definitely very bearish for the very short term. In fact, this is the main reason why we are not closing or limiting our short positions at this time despite the cyclical turning points and the apex-based reversal possibility in the euro index. The other reason is that neither gold, nor silver reached important support levels and thus they should fall further before bouncing temporarily.
Mining Stocks’ Strength
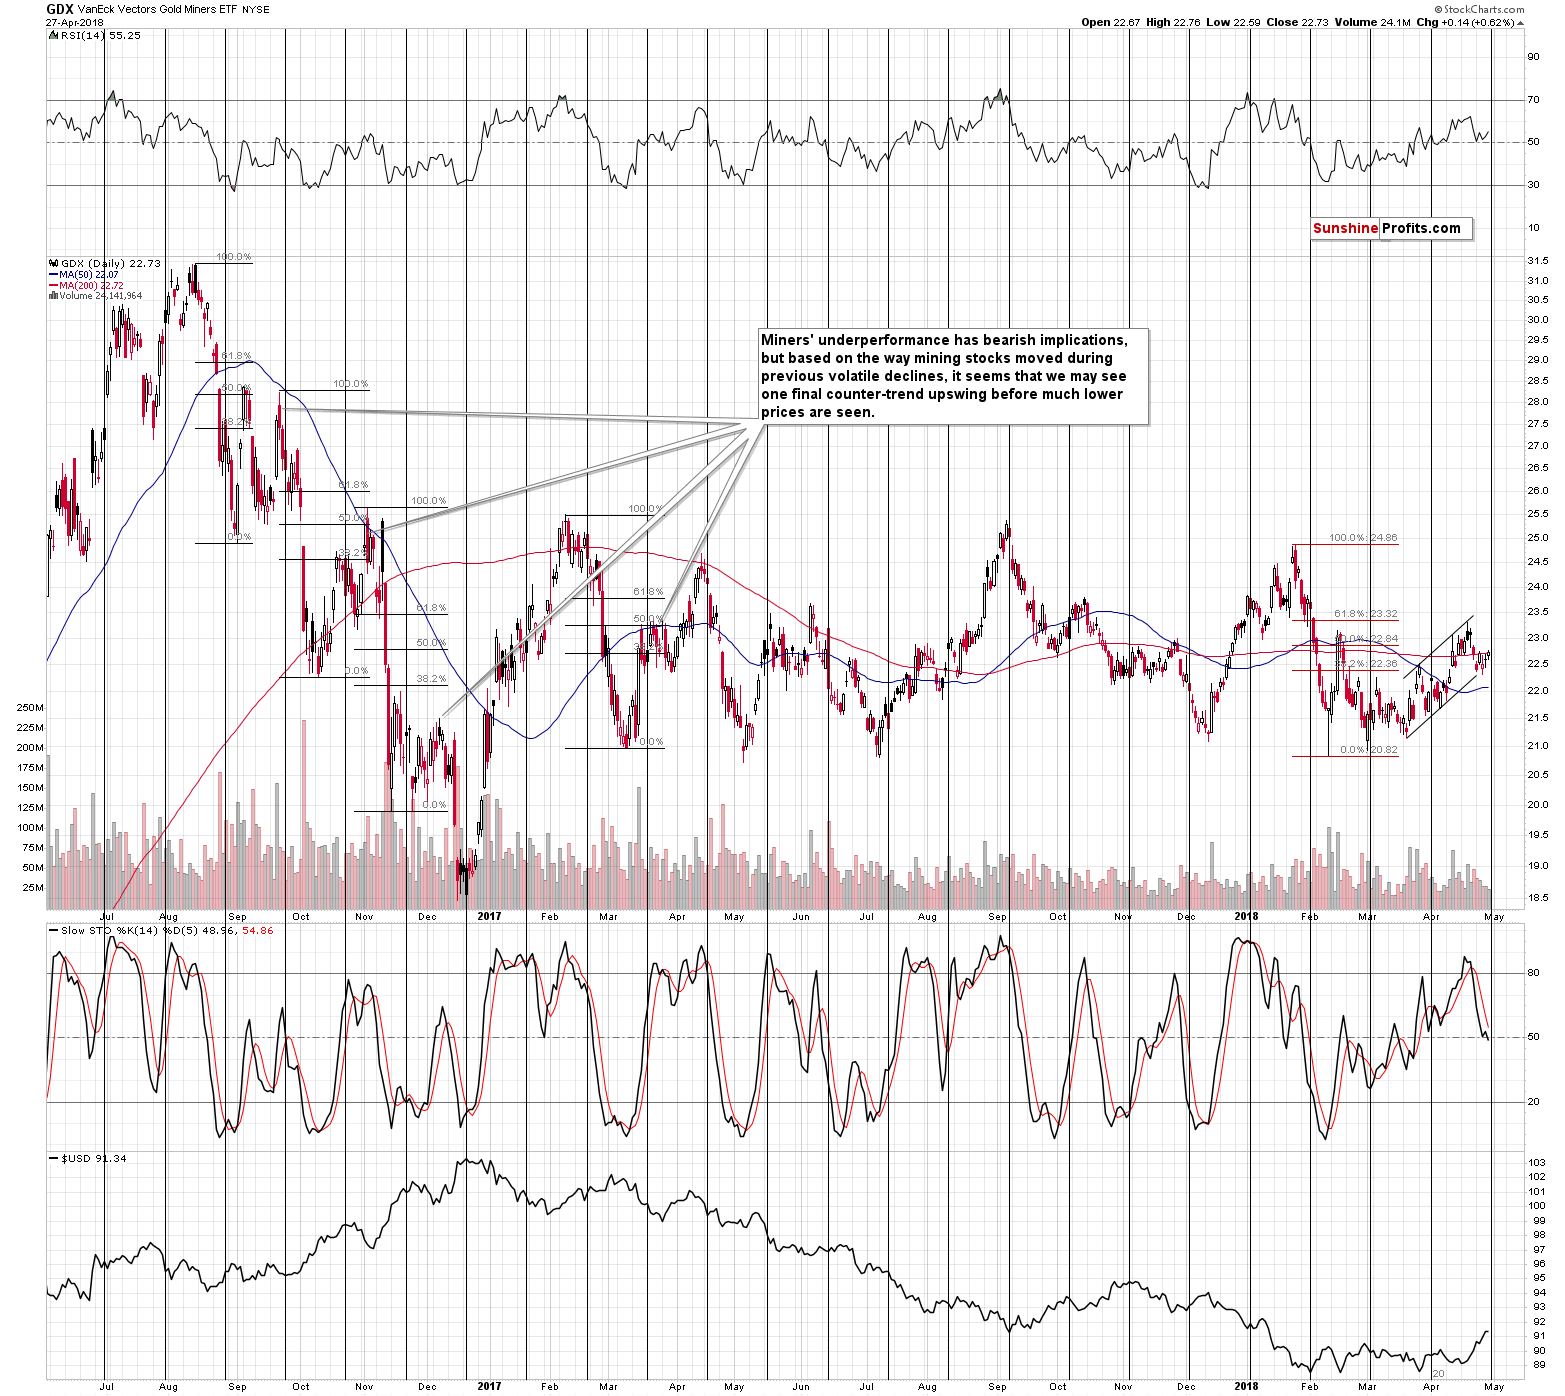
Gold and silver miners have been quite strong recently, but this might actually have bearish implications here. The reason that you see on the above chart is the cyclical turning point. Mining stocks formed a very short-term bottom last Monday and thus the most recent move was up. This means that the turnaround that one might expect based on the turning point could be to the downside.
The other reason is the action in the miners to gold ratio.
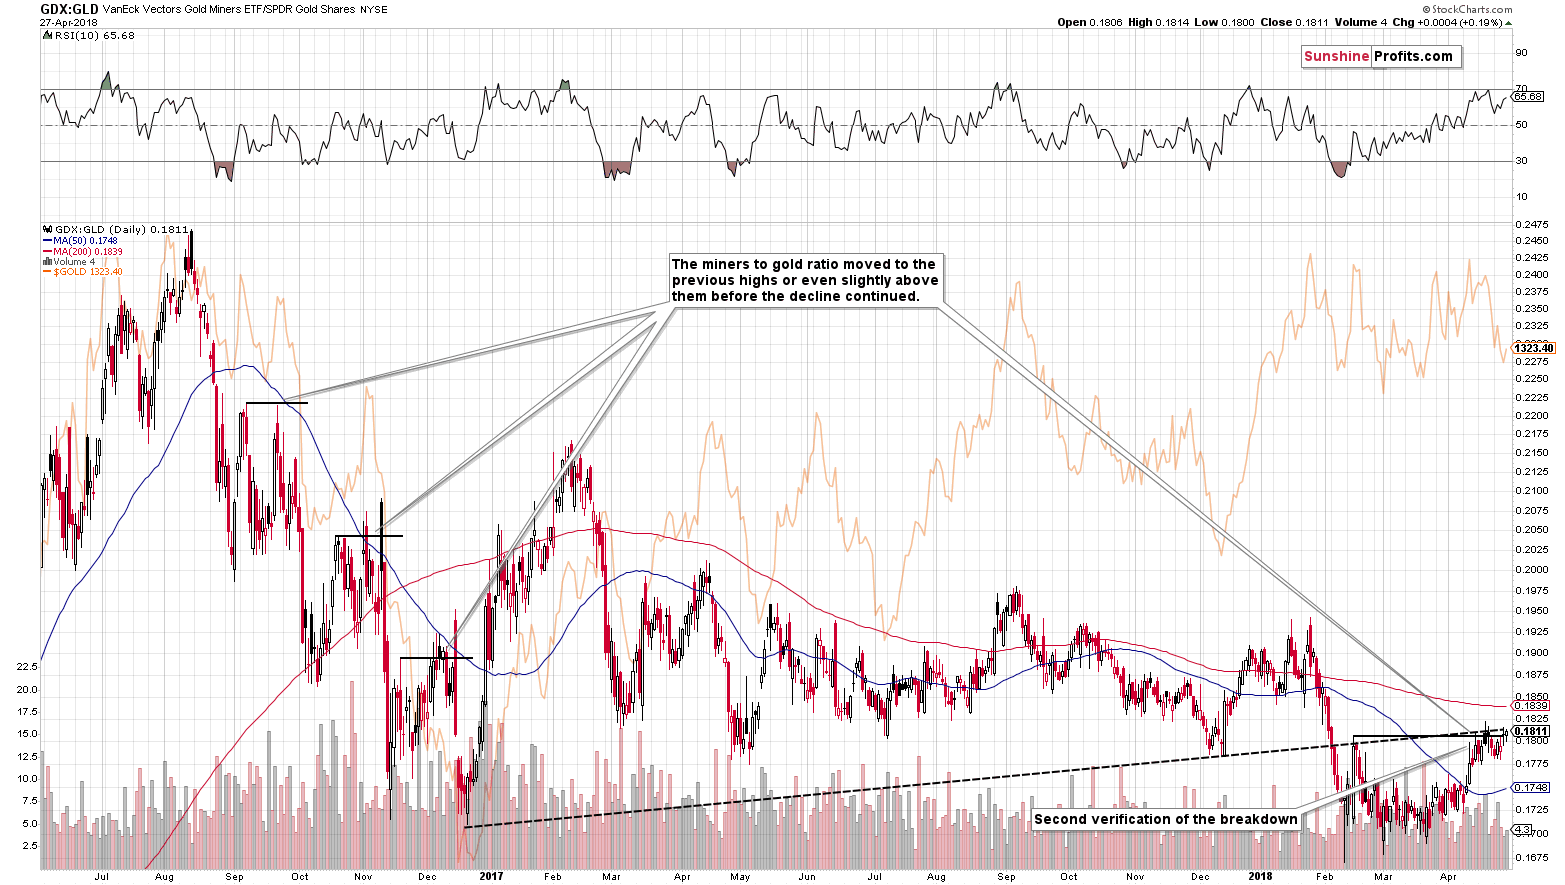
The GDX to GLD ratio once again moved to the rising resistance line and the mid-February high. There was no breakout, so the likely action from here – because of the resistance – is a decline.
Forex Action
The situation in the currency sector suggests that we’ll likely see a corrective short-term downswing in the USD Index. This is theoretically bullish for the precious metals sector, but the situation may not be as simple here.
Let’s start with the short-term charts.
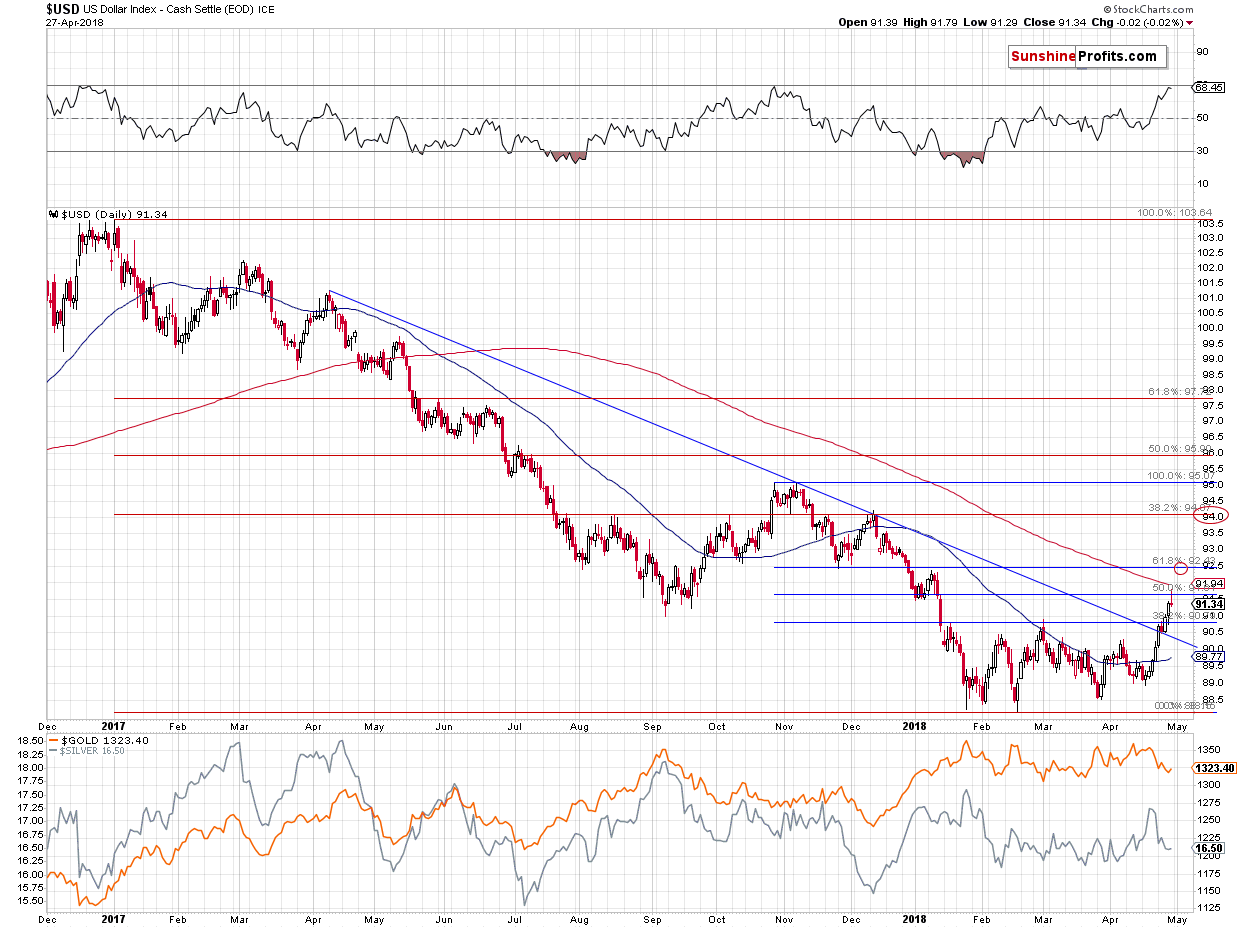
The USD Index rallied significantly in the second half of April and it broke through several important resistance levels. The key resistance that you can see on the above chart is the declining blue line. It’s noteworthy that the USDX initially moved lower immediately after breaking above it and it successfully tested this line as support. The rally then continued and we saw several closes above it, including the weekly one. The medium-term outlook improved greatly, but we wouldn’t rule out another verification of the mentioned blue line in the following weeks.
There are three things that make a short-term move lower likely – the RSI very close to the 70 level, the fact that USDX tried to break above the 2017 low, the January 2018 low and the 50% Fibonacci retracement, and failed, and the shape of the Friday’s session. Namely, we saw a clear reversal.

The EUR/USD moved higher right at its triangle-apex-based reversal, which also suggests that we’ll see a break in the current decline.
But, does it have to start right away? Not necessarily. The USD Index could form another reversal as that’s what it used to do quite a few times in the past. For instance, the early December 2016 reversal was not the final one – the USDX topped two days later. The early April 2016 reversal was also followed by 2 (in terms of daily closing prices) or 3 (in intraday terms) days of higher prices. In such case, we could even see a quick move to the 61.8% Fibonacci retracement, which is approximately at the 2018 high and November and October 2017 lows.
Plus, there were several reversals in December 2016 and October/November 2017 before the USD finally declined.
Even if we don’t see anything specific in the USD today or tomorrow, precious metals (especially silver) could still plunge based on the similarity to the previous black candlesticks that we outlined earlier today. The similar sessions in silver took place in early March 2017 and in early July 2017. The first case was right after the initial USDX top and the second one was after a daily reversal in the USDX. Consequently, as odd as it may appear, the possibility of a very short-term decline in the USD Index doesn’t invalidate the very bearish sign for silver at all.
Finally, let’s take a look at the big USD picture.
USD Megaphone Is Over
About two months ago, on February 28th, 2018, we wrote about the megaphone pattern in the USD Index. Namely, we wrote that it was being invalidated, but that the move higher that we saw at that time was not yet to be trusted:
The implications are already bullish, but they will be much more bullish when we also see a breakout above the previous February high and at least two weekly closes above it. Since the previous move above this line was followed by new lows in the USD (in the following week), we are still a bit skeptical toward yesterday’s move. Still, overall, it was a bullish development and based on the short-term breakouts that we discussed earlier, this invalidation has a much bigger chance of being a true one.
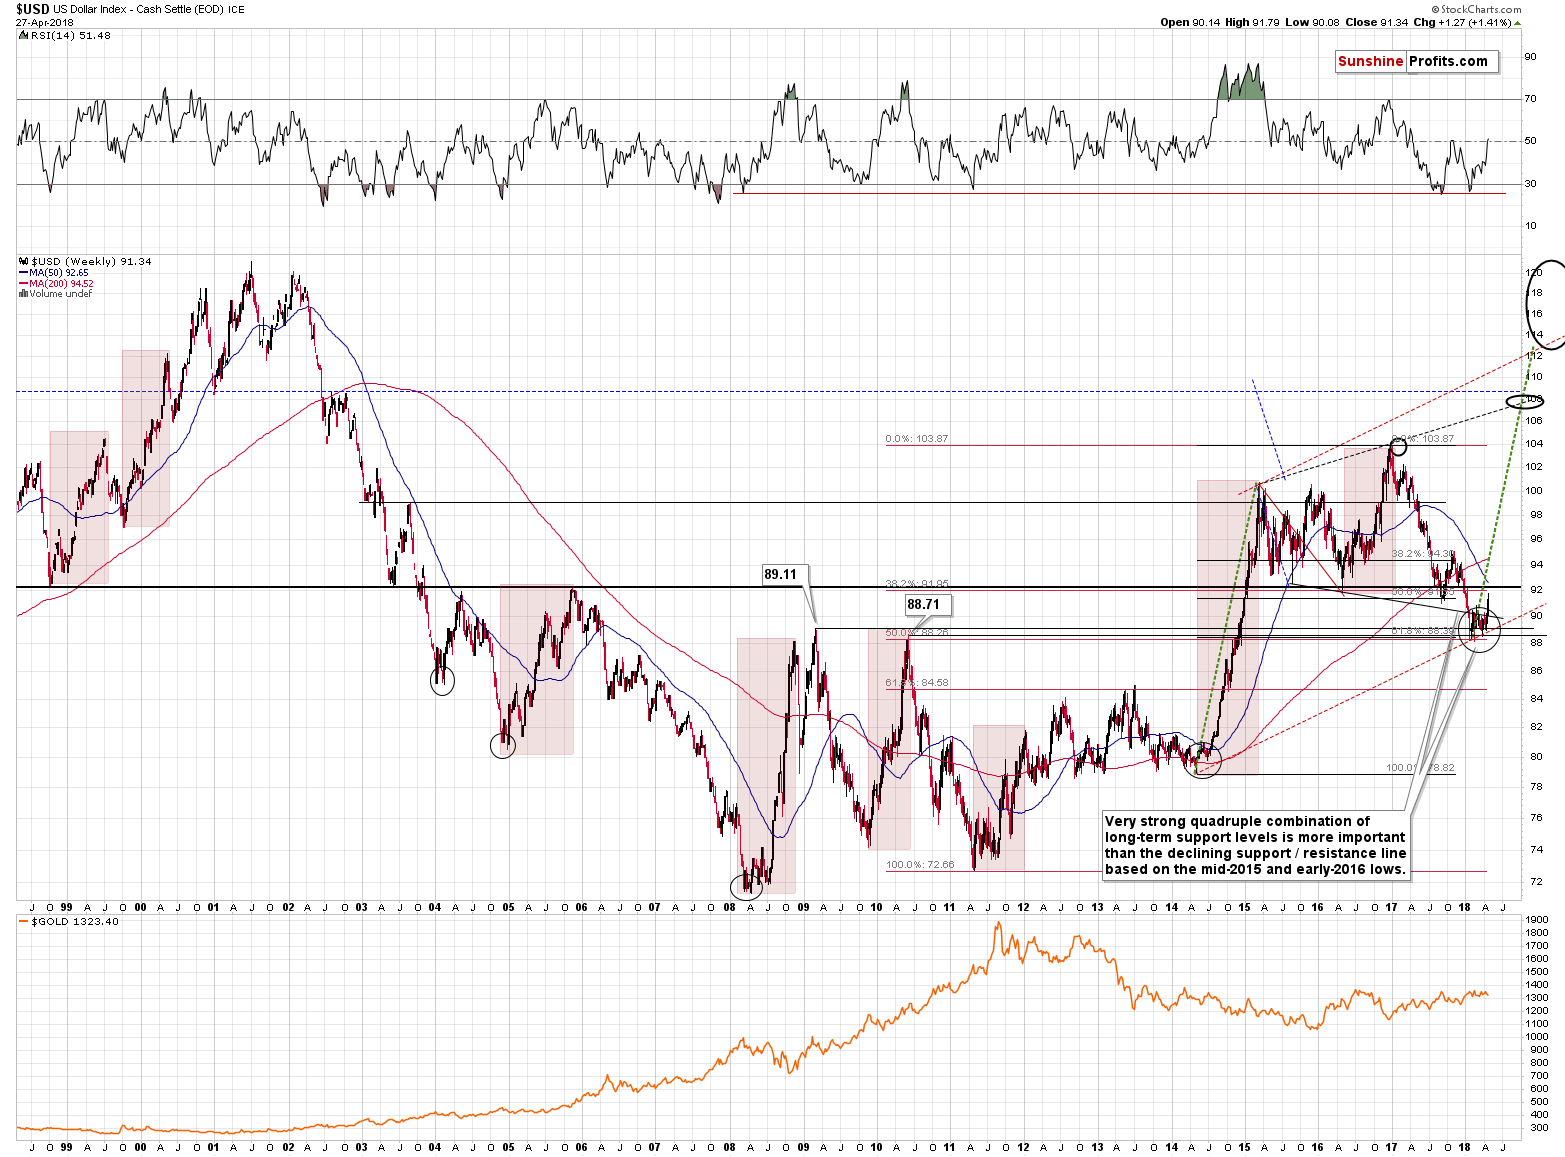
On the long-term chart you can see why we were very skeptical toward the possible long-term bearish implications of the previous breakdown below the mentioned declining support line. It’s because a much more important support was reached, and it held. Precisely, there was only a tiny breakdown below the combination of support levels and it was invalidated immediately.
The key mentioned support levels that held are the 2009 and 2010 tops along with 2 major retracements based on major extremes (marked with red and black on the above chart). The above combination is much stronger than the previously discussed declining line. The reason is that the mid-2015 and 2016 lows are less prominent than the 2009 and 2010 tops and the line based on the former is not strengthened by key Fibonacci retracements, while the latter is.
Consequently, the invalidation of breakdowns below the key, long-term support levels is far more important than the declining shorter-term line.
The above has been the reason for one to expect the move back above the declining resistance line. Yesterday’s session proved that the above expectation was correct. Moreover, thanks to the simultaneous breakout above the declining short-term resistance lines, the odds are that rallies will follow.
Also, the above chart explains the title of this section. The mentioned declining resistance line based on the 2015 and 2016 lows, along with the rising dashed line based on the 2015 and 2017 tops create an expanding triangle pattern that is sometimes referred to as a megaphone pattern.
This time, we can say with confidence that the megaphone pattern is no longer a threat to the bullish case for the USD in the medium term. The lower border of the pattern is currently at 90, while we just saw a weekly close over 1.3 index point higher. The invalidation of the breakdown below the declining support line is clearly visible from the long-term perspective. It doesn’t seem that there is a need for an additional confirmation before saying that the megaphone formation is no longer in place.
The implications for the USD Index are bullish for the medium term, but we could see some short-term weakness before the rally continues. Based on the specific signs that we saw, especially in the silver market, this doesn’t have to translate into higher precious metals values in the near term.
Summary
Summing up, the situation in the USD Index and the Euro Index suggests that we’ll see a correction, but due to the specific signals from gold and – especially – silver, it doesn’t seem that this will automatically translate into higher precious metals values. It’s likely that we’ll see a corrective upswing in the PM sector shortly based on the cyclical turning points and the apex-based-reversal in the euro, but since no major support levels were reached in gold and silver, it seems that the precious metals market will drop further before forming a bottom sometime this week.
As always, we will keep you – our subscribers – informed.
To summarize:
Trading capital (supplementary part of the portfolio; our opinion): Full short positions (200% of the full position) in gold, silver and mining stocks are justified from the risk/reward perspective with the following stop-loss orders and initial target price levels:
- Gold: initial target price: $1,218; stop-loss: $1,382; initial target price for the DGLD ETN: $53.98; stop-loss for the DGLD ETN $37.68
- Silver: initial target price: $14.63; stop-loss: $18.06; initial target price for the DSLV ETN: $33.88; stop-loss for the DSLV ETN $19.27
- Mining stocks (price levels for the GDX ETF): initial target price: $19.22; stop-loss: $23.54; initial target price for the DUST ETF: $39.88; stop-loss for the DUST ETF $21.46
In case one wants to bet on junior mining stocks' prices (we do not suggest doing so – we think senior mining stocks are more predictable in the case of short-term trades – if one wants to do it anyway, we provide the details), here are the stop-loss details and initial target prices:
- GDXJ ETF: initial target price: $27.82; stop-loss: $36.14
- JDST ETF: initial target price: $94.88 stop-loss: $41.86
Long-term capital (core part of the portfolio; our opinion): No positions (in other words: cash)
Insurance capital (core part of the portfolio; our opinion): Full position
Important Details for New Subscribers
Whether you already subscribed or not, we encourage you to find out how to make the most of our alerts and read our replies to the most common alert-and-gold-trading-related-questions.
Please note that the in the trading section we describe the situation for the day that the alert is posted. In other words, it we are writing about a speculative position, it means that it is up-to-date on the day it was posted. We are also featuring the initial target prices, so that you can decide whether keeping a position on a given day is something that is in tune with your approach (some moves are too small for medium-term traders and some might appear too big for day-traders).
Plus, you might want to read why our stop-loss orders are usually relatively far from the current price.
Please note that a full position doesn’t mean using all of the capital for a given trade. You will find details on our thoughts on gold portfolio structuring in the Key Insights section on our website.
As a reminder – “initial target price” means exactly that – an “initial” one, it’s not a price level at which we suggest closing positions. If this becomes the case (like it did in the previous trade) we will refer to these levels as levels of exit orders (exactly as we’ve done previously). Stop-loss levels, however, are naturally not “initial”, but something that, in our opinion, might be entered as an order.
Since it is impossible to synchronize target prices and stop-loss levels for all the ETFs and ETNs with the main markets that we provide these levels for (gold, silver and mining stocks – the GDX ETF), the stop-loss levels and target prices for other ETNs and ETF (among other: UGLD, DGLD, USLV, DSLV, NUGT, DUST, JNUG, JDST) are provided as supplementary, and not as “final”. This means that if a stop-loss or a target level is reached for any of the “additional instruments” (DGLD for instance), but not for the “main instrument” (gold in this case), we will view positions in both gold and DGLD as still open and the stop-loss for DGLD would have to be moved lower. On the other hand, if gold moves to a stop-loss level but DGLD doesn’t, then we will view both positions (in gold and DGLD) as closed. In other words, since it’s not possible to be 100% certain that each related instrument moves to a given level when the underlying instrument does, we can’t provide levels that would be binding. The levels that we do provide are our best estimate of the levels that will correspond to the levels in the underlying assets, but it will be the underlying assets that one will need to focus on regarding the signs pointing to closing a given position or keeping it open. We might adjust the levels in the “additional instruments” without adjusting the levels in the “main instruments”, which will simply mean that we have improved our estimation of these levels, not that we changed our outlook on the markets. We are already working on a tool that would update these levels on a daily basis for the most popular ETFs, ETNs and individual mining stocks.
Our preferred ways to invest in and to trade gold along with the reasoning can be found in the how to buy gold section. Additionally, our preferred ETFs and ETNs can be found in our Gold & Silver ETF Ranking.
As a reminder, Gold & Silver Trading Alerts are posted before or on each trading day (we usually post them before the opening bell, but we don't promise doing that each day). If there's anything urgent, we will send you an additional small alert before posting the main one.
=====
Latest Free Trading Alerts:
Another week, another outrageous prediction for the price of Bitcoin. We just saw a forecast at more than 75 times the current value of the currency. The figure is $700,000. Is Bitcoin really about to take off to the Moon or has it been shot down?
=====
Hand-picked precious-metals-related links:
PRECIOUS-Gold prices ease as dollar steadies, Korean tensions ebb
Gold is still in a 'bear super-cycle,' and it's got five more years of pain to go: Wells Fargo
One of the Rarest Precious Metals Hits a Record High
BlackRock's Platinum ETF Assets Hit Record Even as Metal Tumbles
=====
In other news:
JPMorgan’s Guide to the End of ‘Easy Money’
Asian shares climb as Korea tensions ease, U.S. data eyed
Apple, the Fed and Jobs will dominate the markets this week
Two-Year U.S. Yields at 2008 Highs Are Scarier Than a 3% 10-Year
Treasury Yield Above 3% Dents Demand for Risk Assets
Euro zone lending picks up, money supply growth slows in March
Trump threatens government shutdown in September if no funding for wall
Sell in May, go away, don’t come back until … global tensions force you to
=====
Thank you.
Sincerely,
Przemyslaw Radomski, CFA
Founder, Editor-in-chief, Gold & Silver Fund Manager
Gold & Silver Trading Alerts
Forex Trading Alerts
Oil Investment Updates
Oil Trading Alerts

