

Briefly: in our opinion, full (200% of the regular size of the position) speculative short positions in gold, silver and mining stocks are justified from the risk/reward perspective at the moment of publishing this alert.
Gold moved lower in May and it’s also down in June, but the price action is far from being spectacular. The overall volatility is still very low and the situation in the precious metals sector is simply extremely boring. But with May now being over and with a new month, new factors are likely to come into play and the odds are that this month will be anything but boring. Especially, if we see the continuation in the analogy that practically nobody seems to realize.
There are several reasons for it, but before we discuss the medium-term picture and implications, we would like to provide you with a brief update on the short-term developments. Let’s start with the USD Index and with a quote from last Friday’s Alert:
The USD Index moved a bit lower yesterday, and the precious metals sector reacted by… moving lower as well. That’s exactly what we wrote in the last few alerts. Even though gold moves in the opposite direction to the USD Index on a very short-term basis, gold’s declines are relatively bigger, and gold’s rallies are relatively smaller. Overall, gold is not really reacting to USD’s decline, which is a consequence of the reason behind the previous simultaneous rally in gold and USD. The reason was increased risk in the Eurozone and as the geopolitical event’s impact fades away, so does gold’s gleam.
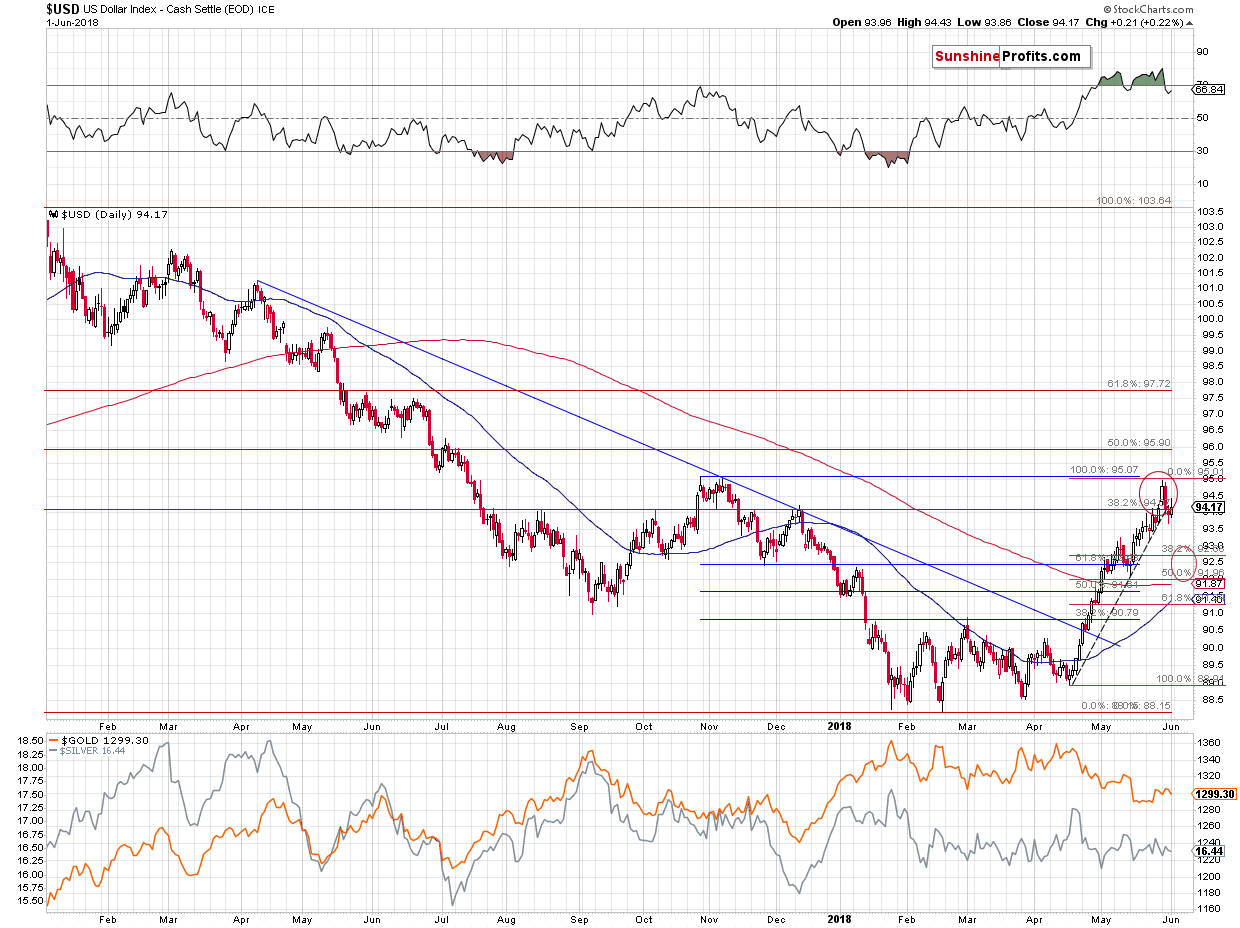
Thursday’s downswing was not big, but it was enough to result in USDX’s breakdown below the short-term, rising support line. The implications were not particularly bearish until the USD Index closed below the above-mentioned line one more time, almost confirming the breakdown. That’s what we saw on Friday. That’s a bearish development and it should theoretically be bullish for precious metals, but it wasn’t. This means that the way in which the gold-USD link currently behaves is still in place. Therefore, even if the USD declines shortly (and we don’t expect the USDX to go below the 92.5 - 92 area), then PMs may not react in a profound manner. The move higher in gold and silver may be small or even nonexistent.
PMs’ and Miners’ Reaction
Gold has not only not rallied – it actually declined, which is one more confirmation of what we wrote about the geopolitical events in general – if they are not in tune with the sentiment-based trend and they are not of critical importance (like WW3 breakout), they are unlikely to trigger anything more than a brief reaction.
The above provides important context for the mining stocks – gold link. One might think that just because gold declined visibly and mining stocks didn’t, it means that miners outperformed and it has bullish implications going forward. In this case, it’s important to keep in mind that gold had previously rallied based on the geopolitical tensions and as they subside (or at least the uncertainty diminishes), it’s only natural to expect gold to give back its previous risk-driven gains. Since there were much smaller risk-driven gains in case of silver and mining stocks, it’s not surprising that they both have less to give back. Consequently, there are no bullish implications of Friday’s “relative strength” of the mining stocks.
Gold’s Short-term Breakout and Its Invalidation
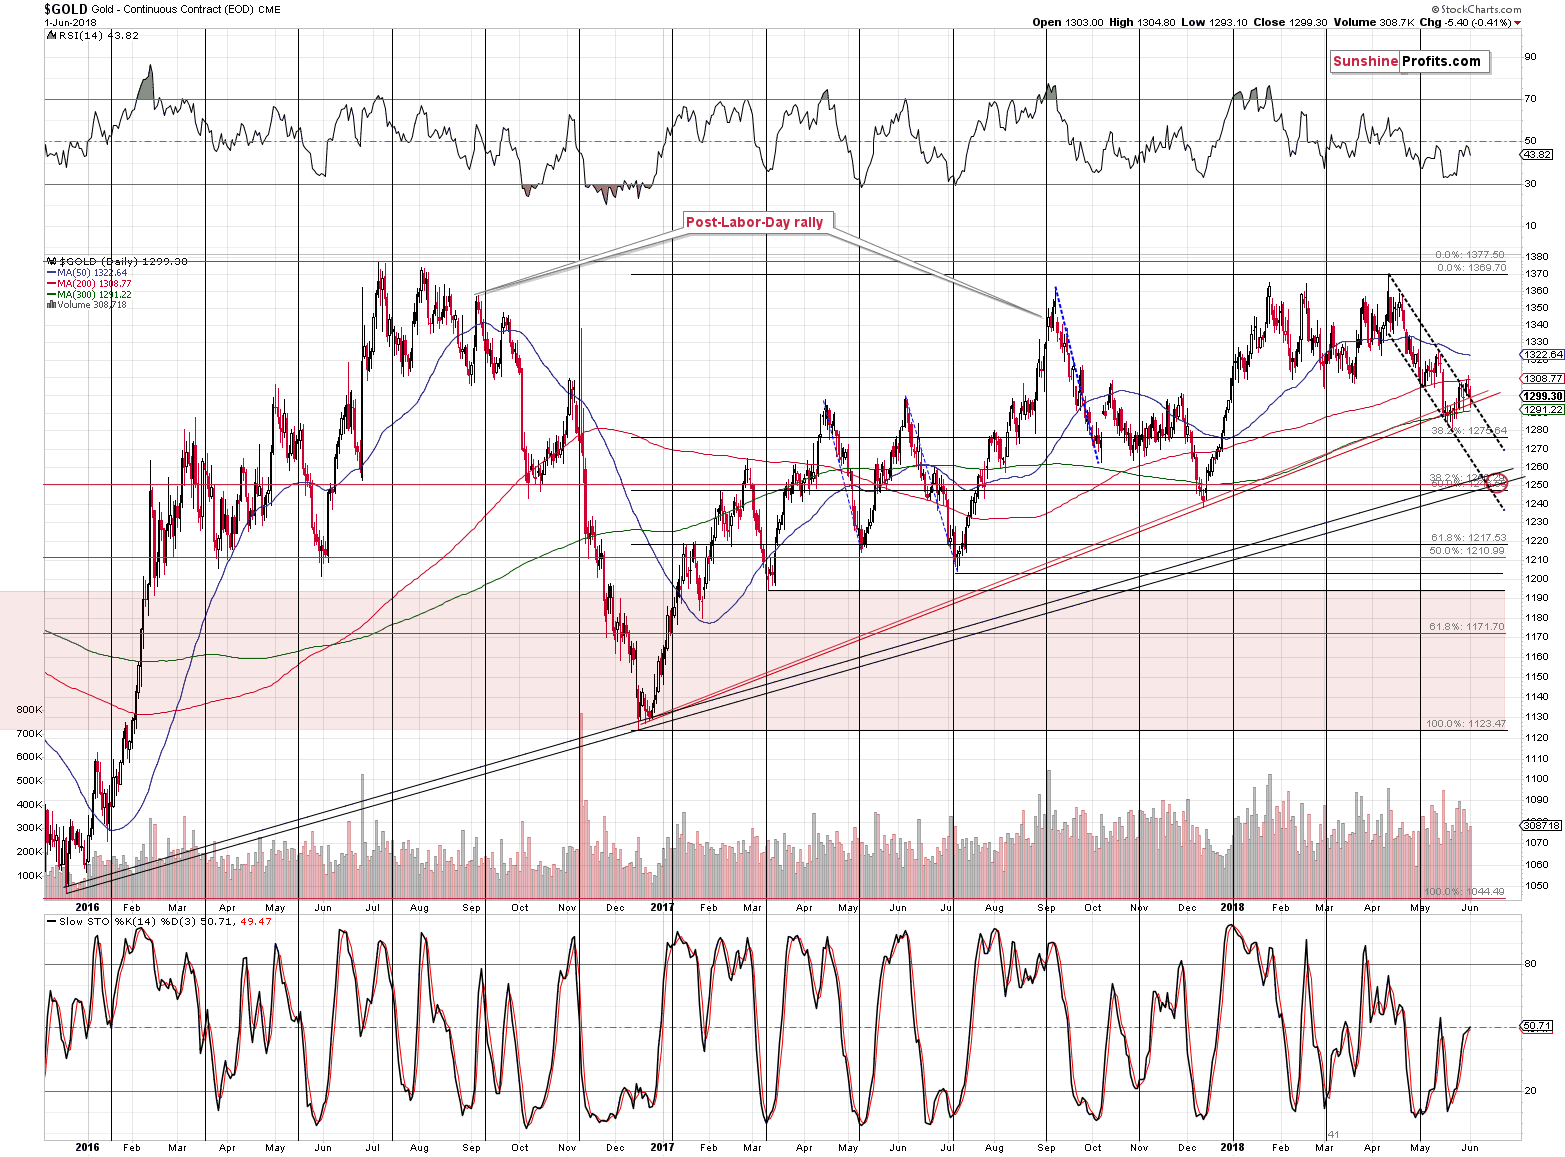
Gold recently moved above the upper border of the declining trend channel, but before the breakout was confirmed, it was already invalidated. Well, it may not be clear based on the above chart, but it is when we consider the data from kitco.com.
On the Stockcharts’ chart it seems that gold ended the session right at the support/resistance line ($1,299), while it really closed the week about $6 lower, which is back within the trend channel. This means that the breakout was invalidated, and the implications are actually not bullish, but bearish.
The next downside target is at about $1,250 as that’s where we have combination of two important support lines – the lower border of the declining trend channel and the rising medium-term support line based on the December 2015 and December 2016 lows. That’s also the 50% Fibonacci retracement level based on the December 2016 – April 2018 rally and the 38.2% Fibonacci retracement level based on the December 2015 – April 2018 rally. Quadruple support makes the $1,250 (approximately) a very likely target for the next rebound.
Silver’s Apex-based Reversal
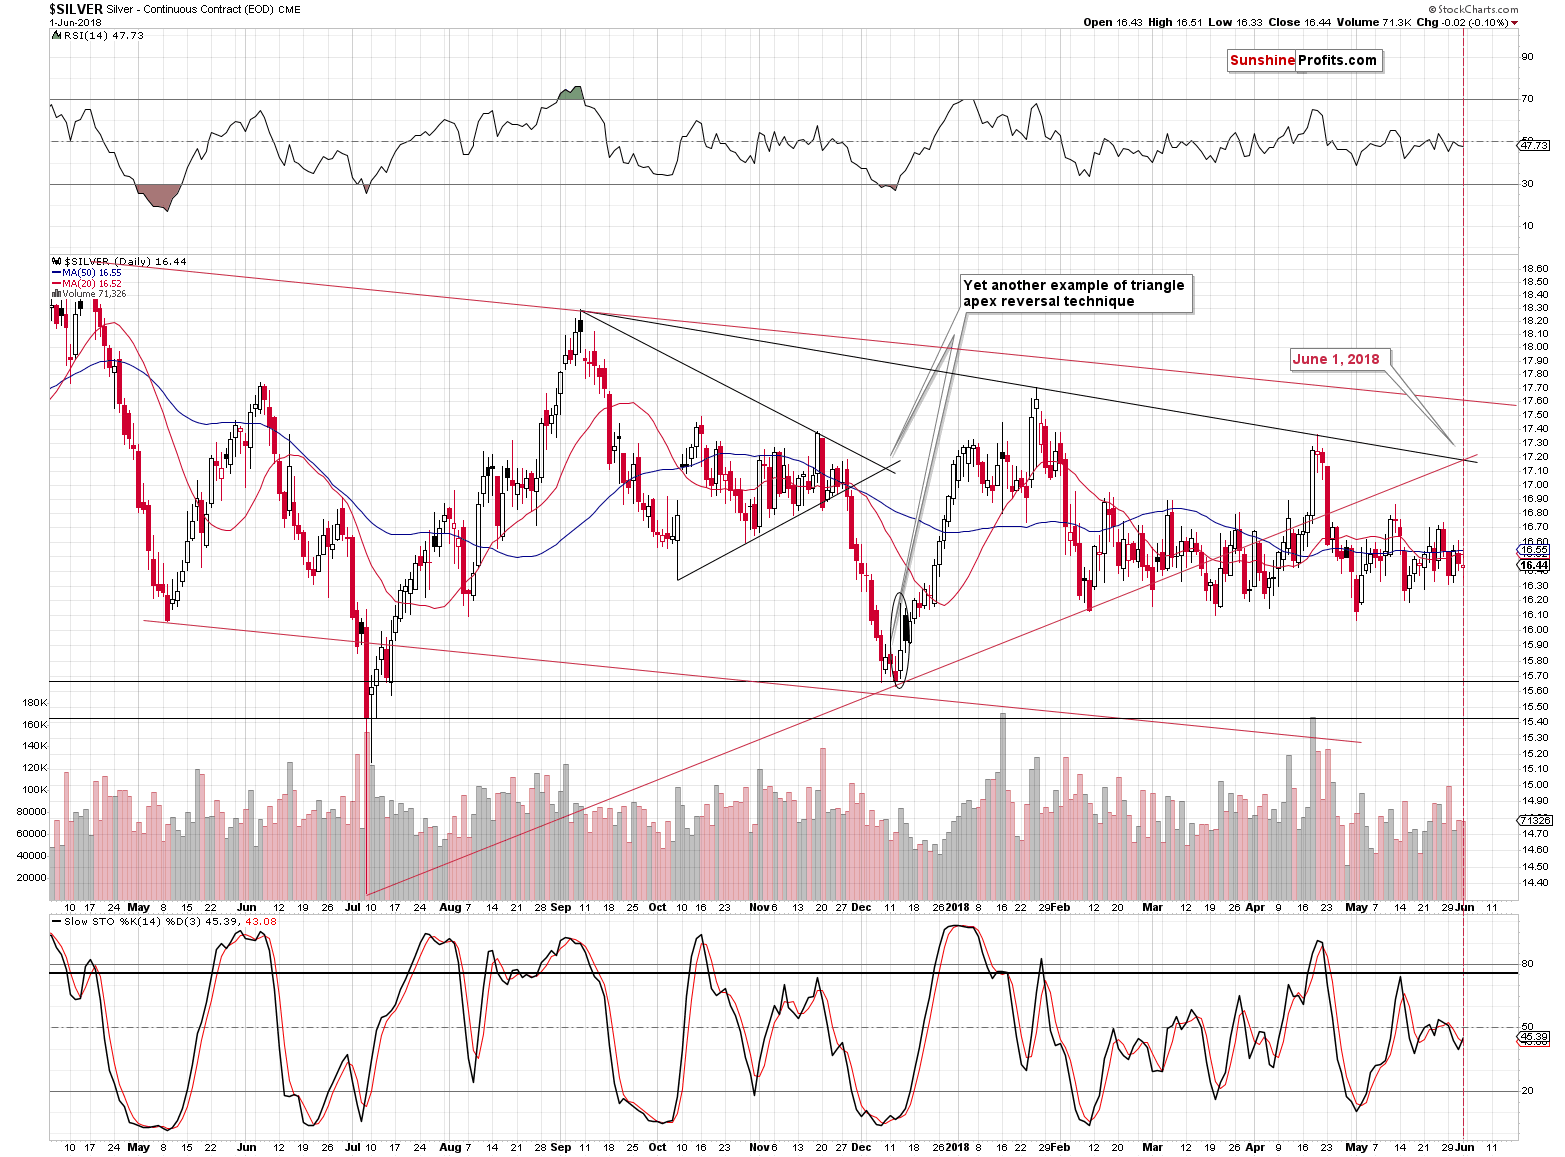
Silver triangle-apex-based turning point is here, and more precisely, we already saw it on Friday. So far there was no spectacular action, but it let’s keep in mind that the tops and bottoms indicated by the reversals don’t have to be particularly volatile. In fact, we may not even recognize them as extremes when they are visible, and it is only clear in hindsight that it was indeed the real geopolitical event’s. This may have been the case this time, but we won’t know for certain until after a few more days.
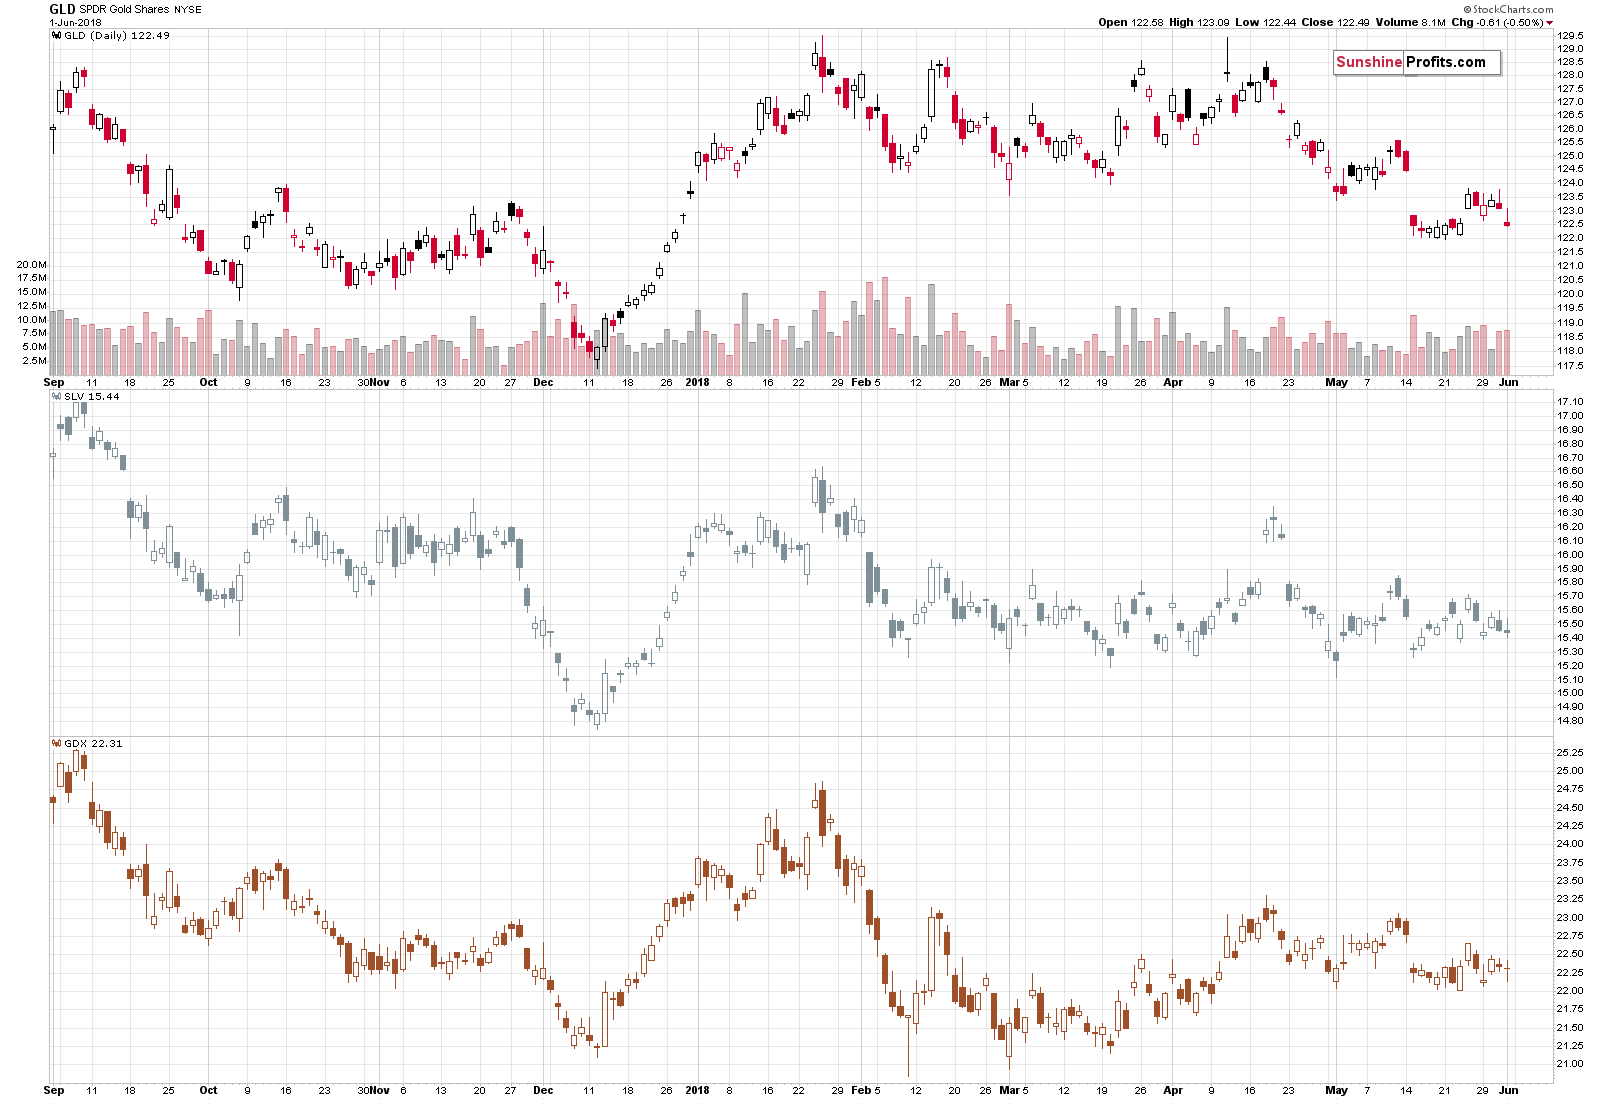
Mining Stocks’ Forgotten Analogy
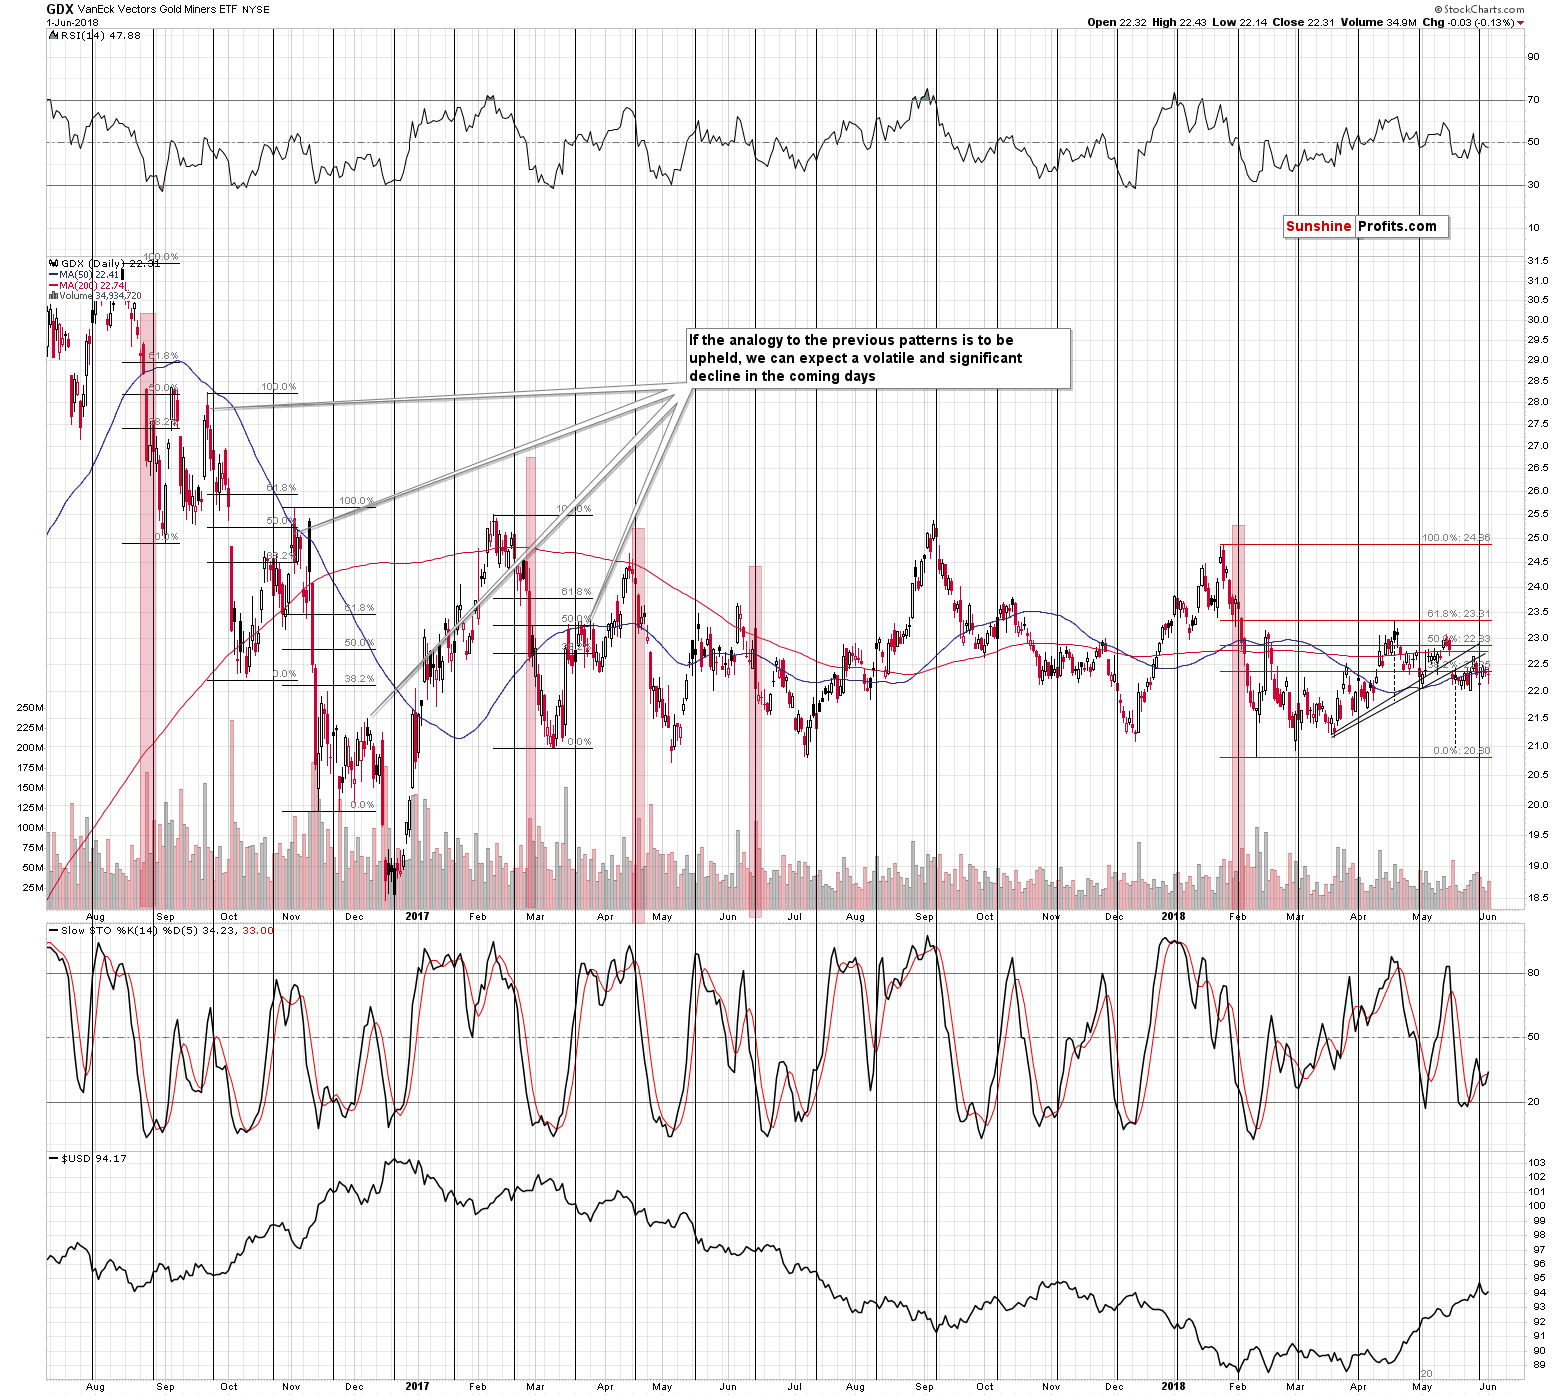
Miners didn’t do much in the last couple of weeks and overall we can describe their movement as series of attempts to move above the mid-February high. All attempts failed either shortly after a small breakout (mid-April attempt), or immediately (other attempts). It may seem like a random set of events, but it’s in tune with what we saw previously several times in the second half of 2016.
After each short-term downswing that was particularly volatile, GDX moved back up a few times before the decline continued. The early 2018 decline was definitely very volatile, so we shouldn’t be surprised to see this kind of consolidation. It’s longer than the previous ones, but in terms of the prices that were reached, the 2016 price moves and the 2018 ones seem quite similar. The implication here is that once mining stocks break below their previous 2018 low, the following slide is likely to be volatile, just like the declines in 2016 were. In the light of the above, one might expect GDX to reach its late 2016 lows after such breakdown.
On a more short-term note, please note that mining stocks were also trying to break above the rising resistance line based on the March and early May lows, which is also the neck level of the bearish head-and-shoulders formation. Since there was no invalidation, the implications of this formation remain in place. Namely, GDX is likely to move at least to the mid-February 2018 lows rather sooner than later.
All in all, the short-term outlook for the precious metals mining stocks is bearish and it seems that it may become even more bearish later this month, after GDX breaks to the new 2018 lows.
Extreme Boredom
The situation in gold and silver is not just boring. It’s extremely boring. And – as odd as it may sound – it gives us something to analyze.
Let’s take a look at gold from the long-term point of view.
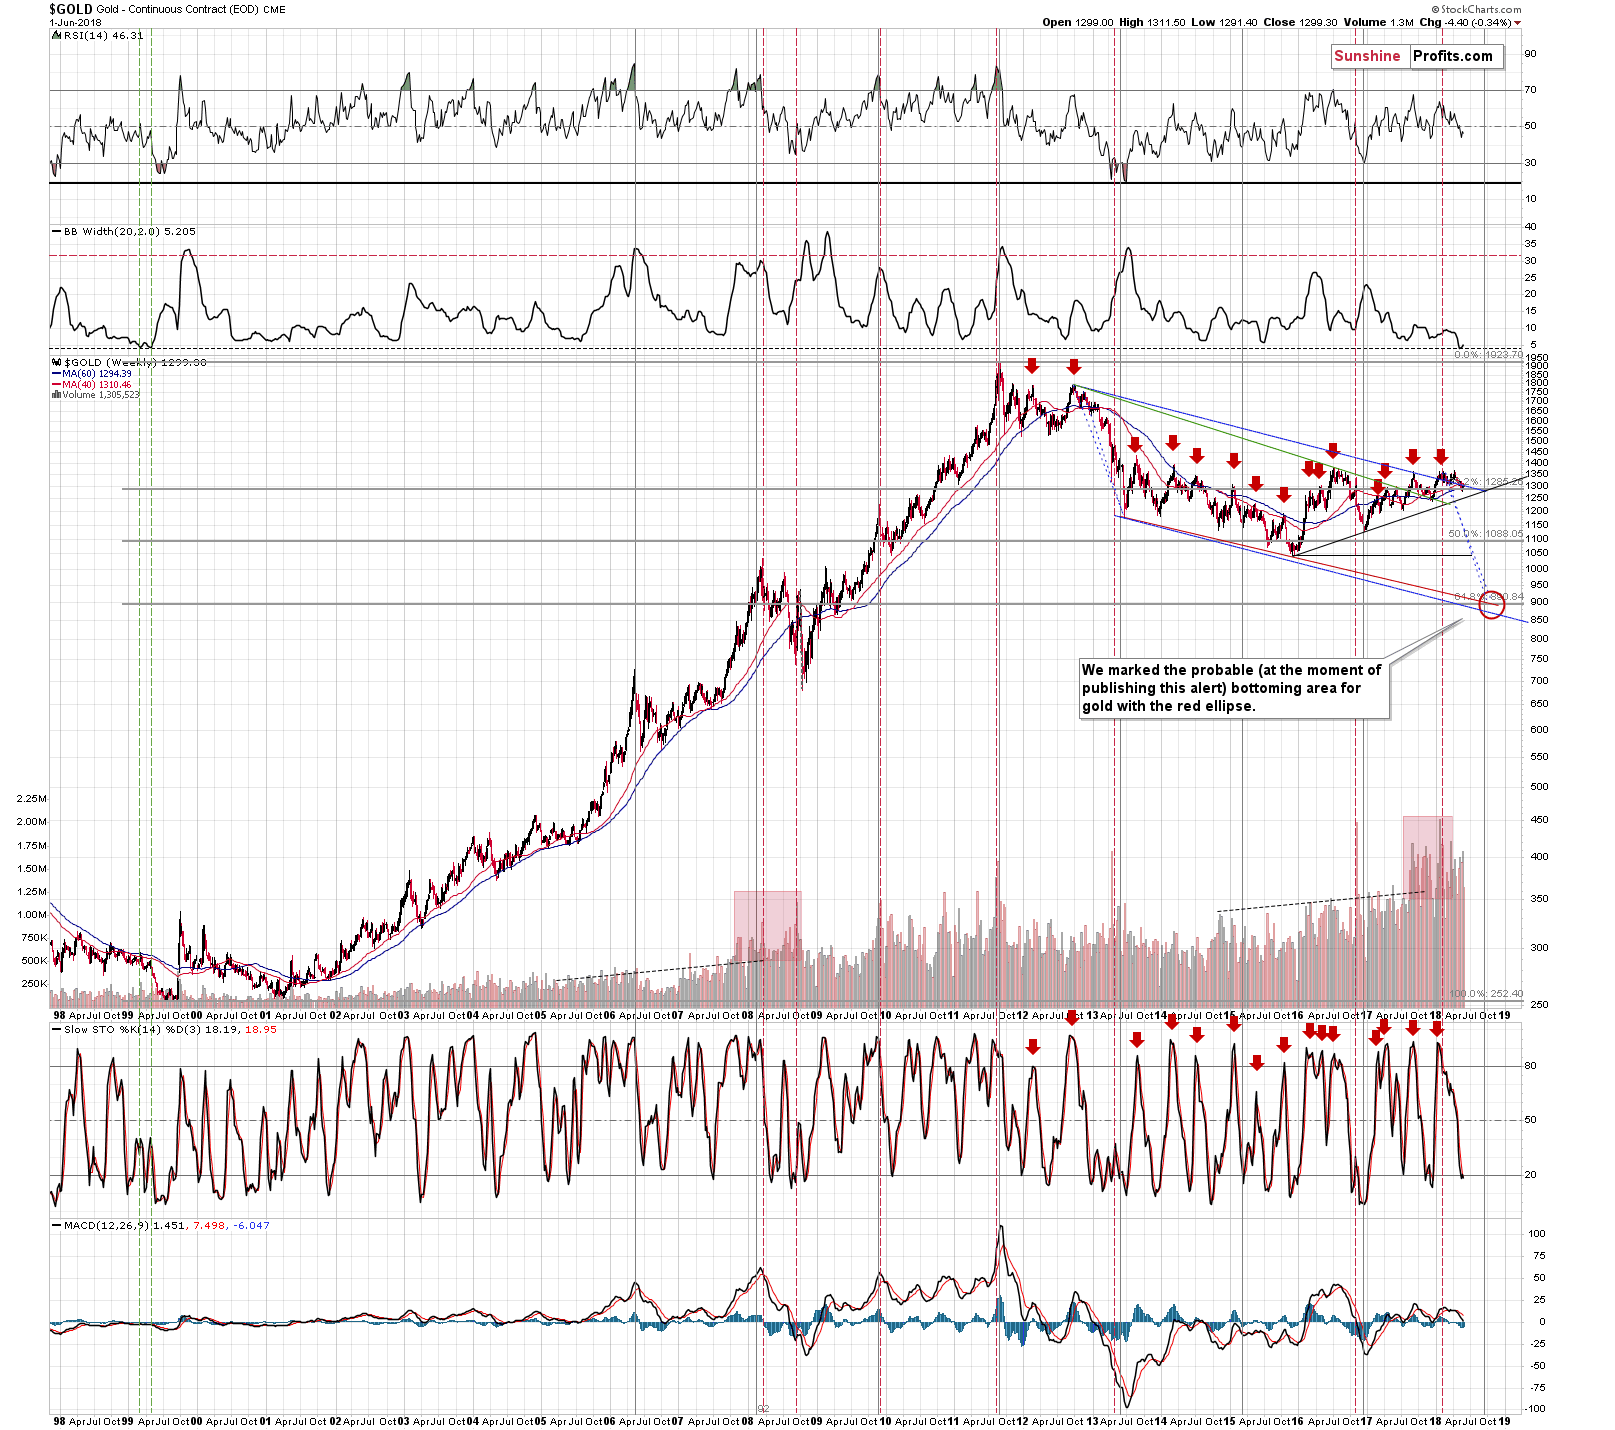
The second indicator from the top is the width of the Bollinger Band – a technical tool that can be used in a few ways and one of them checking when the bands are narrowing and viewing this as a sign of an upcoming huge move. Everyone heard the “calm before the storm” phrase and it is a perfect description of what the above technique tries to detect. It is designed to show if the market is currently too calm and it should make one suspicious as very calm and very volatile periods tend to be quite close to each other.
The Bollinger Band’s width is currently very small, which implies that a big move is just around the corner.
The above is just a general technique, so some may say that there’s no specific reason why it should work in gold at this particular time. The truth, however, is that there is not one but two specific reasons (or more depending on how one counts) why this technique should be taken into account and viewed as reliable.
The first confirmation is visible on the above chart and it’s the simple fact that this signal has already worked in case of the yellow metal – in 1999. We’ve seen the Bollband’s width as low as it was recently only one time in the past and it was followed by a big decline.
Even more importantly, it worked right before the final decline that ended a prolonged bear market and started a new bull market. Based on multiple other factors we had been expecting gold to slide one final time (below the 2015 lows) and then to move higher in the medium term. It is remarkable that the confirmation from the above technique suggests exactly that.
There may be some short-term implications as well. If you look closely, there were actually two times in 1999 when the Bollinger Band’s width was as low as it was recently. The first time triggered a decline and a smaller corrective upswing, which was then followed by another decline in the indicator and then the final slide.
We have recently seen a move lower in the width of the Bollinger Band along with a decline in gold and now we’re seeing a small corrective upswing in both of them. If the analogy to 1999 is to be upheld, this is the last stop before the final part of the bear market that started in 2011. In other words, the implications for the following weeks and months are very bearish.
On a side note, please keep in mind that the above chart includes our medium-term downside target for gold. The final bottom is likely to be seen in the final part of the year, likely in late September or early October and gold could move to about $900 (more precisely, $890) before the new bull market really starts.
All right, but that’s still just one confirmation…
What if we told you that the price of gold is not the only part of the precious metals sector that provides the above signal?
Enter silver.
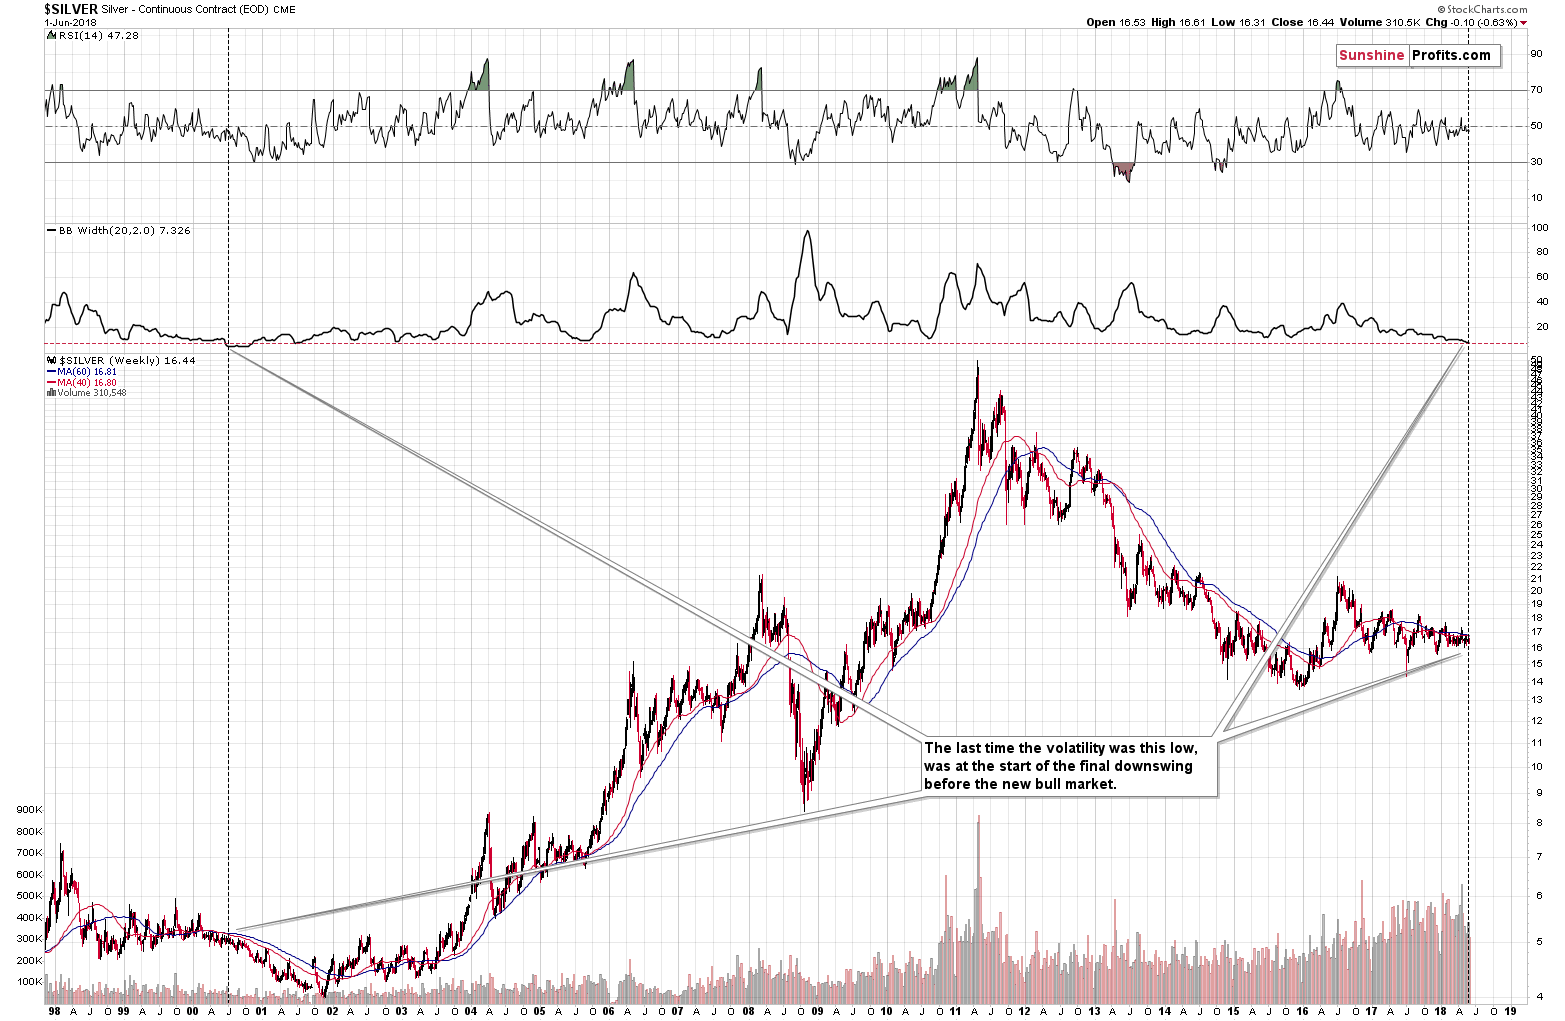
The situation in gold’s sister metal is analogous and serves as a perfect confirmation. There was only one situation which was similar to what we’ve seen in the past months and it’s what had happened before the final part of the previous bear market.
The situation is similar not only in the level of the Bollinger Band’s width, but also in case of the shape of the moves in both: indicator and silver price. As far as the latter is concerned, the 1998 top is very similar to the 2016 top (note the characteristic head-and-shoulders shape and silver’s position relative to both moving averages). In both cases the declines ended at the end of the year (1998 and 2016) and then silver started to move back and forth for about 1.5 years with several sharp rallies that didn’t last long. That’s exactly what happened in both cases and based on this analogy it seems that the back-and-forth movement is coming to an end.
What’s next? Back in 2000 and 2001, silver decline in a rather stable manner, but it may not be the case this time. The decline that we saw almost 20 years ago was preceded by about 10 years of back and forth movement around the $5 level, from which the decline started. Investors were not interested in the silver market and traders were unimpressed as well and the volume reflected it. Consequently, there was much less short-term capital that could have been added on the short side of the market, exacerbating the downswing.
The situation is very different today despite the similarity in the recent price moves. Silver has not been trading around the $16.50 for a decade, but for about 3 years and what we saw less than 10 years ago was a 2.5-year rally that took silver from below $9 to about $50. That was extremely exciting, and many people keep thinking that silver is about to take off immediately. The volume readings show that the interest in the silver market is many times bigger than it was about 20 years ago.
Besides, even during the last 1.5 years of back and forth trading, the very short-term moves in silver were much more volatile than the ones in 1999 and 2000. In particular, the early July 2017 overnight decline served as a proof that volatility in the white metal is to be expected.
What does it all mean? It means that the signal coming from the analysis of Bollinger Bands’ width is well confirmed and we should be preparing for lower gold and silver prices in the coming weeks.
But how do I know that the decline will really start this time? It’s been delayed for so long, so why shouldn’t it be delayed even longer?
That is a very good question to ask, and there is indeed no certainty (there is none in any market in general, though), but we have another indication that suggests that it’s high time for the decline to start.
Precious Metals and their True Seasonality
In short, it’s this time of the year during which one can expect gold and silver to slide, precisely because declines on average are often seen in early June. Even if we additionally take into account the effect of the expiration of derivatives (which is what True Seasonals do in addition to providing regular seasonality insights), we still get bearish implications for the near term.
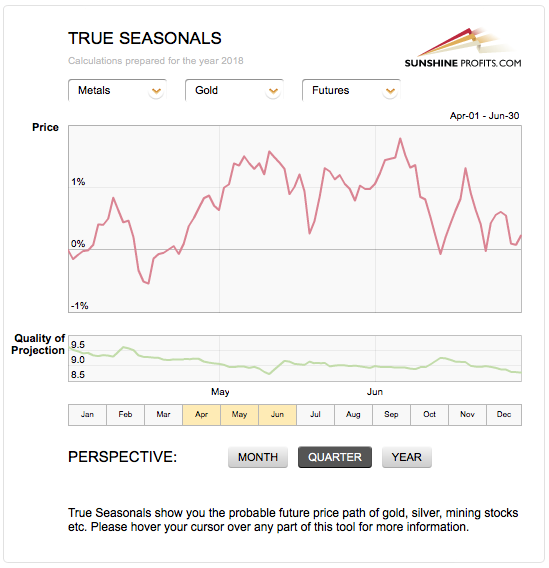
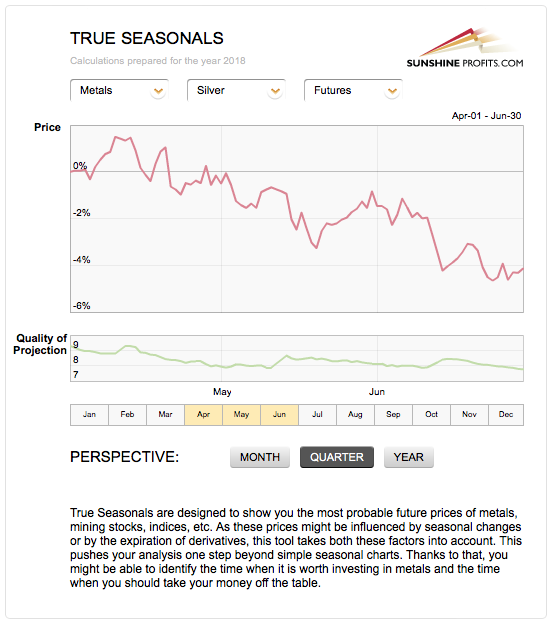
If this June is going to be business as usual, then we can expect some back and forth trading in the first several days or even a small move higher, but then declines for the remaining part of the month. Given tat we are publishing this analysis on June the 4th, most of this month’s regular bullish implications are already behind us and thus one shouldn’t count on more than a few days of strength – if we see them at all.
Let’s keep in mind that seasonality is not a crystal ball, but a “default” mode in which the market is likely to move if there are no other strong drivers present and in light of the long-term signals that we have in play right now along with silver’s apex-based reversal, it seems that the above seasonal tendencies can be overridden and a more bearish outlook can prevail.
Summary
Summing up, it seems that the next huge downswing in the precious metals market is just around the corner and there are some short-term signs suggesting that it may even begin this week. The True Seasonality for gold and silver suggests that one should expect lower gold and silver prices this month, while silver’s apex-based turning point indicates that the decline may have already begun. The analogies to what happened in gold and silver when the market was as boring as it’s been recently suggest that if we get another very short-term and small move higher, it may be the final one before the move to the final bottom begins.
As always, we’ll keep you – our subscribers – informed.
To summarize:
Trading capital (supplementary part of the portfolio; our opinion): Full short positions (200% of the full position) in gold, silver and mining stocks are justified from the risk/reward perspective with the following stop-loss orders and initial target price levels:
- Gold: initial target price: $1,251; stop-loss: $1,382; initial target price for the DGLD ETN: $48.88; stop-loss for the DGLD ETN $37.48
- Silver: initial target price: $15.73; stop-loss: $18.06; initial target price for the DSLV ETN: $27.58; stop-loss for the DSLV ETN $19.17
- Mining stocks (price levels for the GDX ETF): initial target price: $21.03; stop-loss: $23.54; initial target price for the DUST ETF: $28.88; stop-loss for the DUST ETF $21.16
In case one wants to bet on junior mining stocks' prices (we do not suggest doing so – we think senior mining stocks are more predictable in the case of short-term trades – but if one wants to do it anyway, we provide the details), here are the stop-loss details and initial target prices:
- GDXJ ETF: initial target price: $30.62; stop-loss: $36.14
- JDST ETF: initial target price: $59.68 stop-loss: $40.86
Long-term capital (core part of the portfolio; our opinion): No positions (in other words: cash)
Insurance capital (core part of the portfolio; our opinion): Full position
Plus, you might want to read why our stop-loss orders are usually relatively far from the current price.
Important Details for New Subscribers
Whether you already subscribed or not, we encourage you to find out how to make the most of our alerts and read our replies to the most common alert-and-gold-trading-related-questions.
Please note that the in the trading section we describe the situation for the day that the alert is posted. In other words, it we are writing about a speculative position, it means that it is up-to-date on the day it was posted. We are also featuring the initial target prices, so that you can decide whether keeping a position on a given day is something that is in tune with your approach (some moves are too small for medium-term traders and some might appear too big for day-traders).
Plus, you might want to read why our stop-loss orders are usually relatively far from the current price.
Please note that a full position doesn’t mean using all of the capital for a given trade. You will find details on our thoughts on gold portfolio structuring in the Key Insights section on our website.
As a reminder – “initial target price” means exactly that – an “initial” one, it’s not a price level at which we suggest closing positions. If this becomes the case (like it did in the previous trade) we will refer to these levels as levels of exit orders (exactly as we’ve done previously). Stop-loss levels, however, are naturally not “initial”, but something that, in our opinion, might be entered as an order.
Since it is impossible to synchronize target prices and stop-loss levels for all the ETFs and ETNs with the main markets that we provide these levels for (gold, silver and mining stocks – the GDX ETF), the stop-loss levels and target prices for other ETNs and ETF (among other: UGLD, DGLD, USLV, DSLV, NUGT, DUST, JNUG, JDST) are provided as supplementary, and not as “final”. This means that if a stop-loss or a target level is reached for any of the “additional instruments” (DGLD for instance), but not for the “main instrument” (gold in this case), we will view positions in both gold and DGLD as still open and the stop-loss for DGLD would have to be moved lower. On the other hand, if gold moves to a stop-loss level but DGLD doesn’t, then we will view both positions (in gold and DGLD) as closed. In other words, since it’s not possible to be 100% certain that each related instrument moves to a given level when the underlying instrument does, we can’t provide levels that would be binding. The levels that we do provide are our best estimate of the levels that will correspond to the levels in the underlying assets, but it will be the underlying assets that one will need to focus on regarding the signs pointing to closing a given position or keeping it open. We might adjust the levels in the “additional instruments” without adjusting the levels in the “main instruments”, which will simply mean that we have improved our estimation of these levels, not that we changed our outlook on the markets. We are already working on a tool that would update these levels on a daily basis for the most popular ETFs, ETNs and individual mining stocks.
Our preferred ways to invest in and to trade gold along with the reasoning can be found in the how to buy gold section. Additionally, our preferred ETFs and ETNs can be found in our Gold & Silver ETF Ranking.
As a reminder, Gold & Silver Trading Alerts are posted before or on each trading day (we usually post them before the opening bell, but we don't promise doing that each day). If there's anything urgent, we will send you an additional small alert before posting the main one.
=====
Hand-picked precious-metals-related links:
PRECIOUS-Gold steady as trade war concerns offset U.S. rate hike prospects
Gold May Hit $1,400 in '19 on `Powerful Fuel' of Weak Dollar
=====
In other news:
Summer of discontent? Events in June that could shake markets
No early elections in Spain, aide to new PM says
Oil steady as extra U.S. supply balances strong demand
=====
Thank you.
Sincerely,
Przemyslaw Radomski, CFA
Founder, Editor-in-chief, Gold & Silver Fund Manager
Gold & Silver Trading Alerts
Forex Trading Alerts
Oil Investment Updates
Oil Trading Alerts

