

Briefly: in our opinion, full (300% of the regular position size) speculative short positions in mining stocks are justified from the risk/reward point of view at the moment of publishing this Alert.
Gold plunged yesterday, just as it was likely to. The fake reason? U.S. retail sales exceeded expectations. The real reason? A major downtrend.
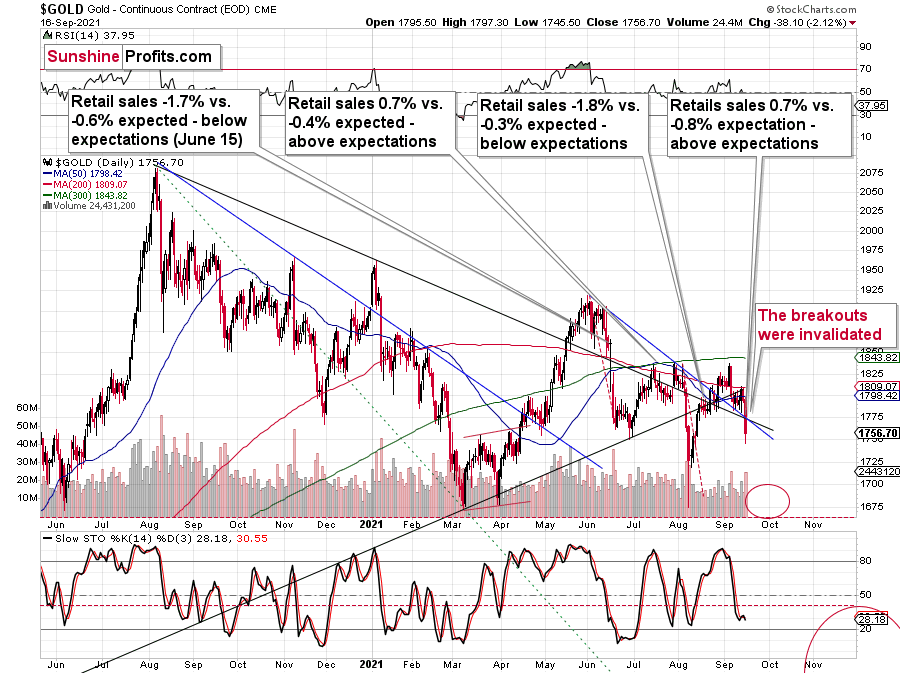
On the above gold chart, I added annotations that show what happened in the previous 3 cases after the retail sales reports. We saw the following:
- gold declined after retail sales disappointed in June
- gold topped after retail sales outperformed in July
- gold paused its rally after retail sales disappointed in August
- gold declined after retail sales outperformed in September
What should one make of that?
Nothing.
There is no clear link (and perhaps no link whatsoever) between U.S. retail sales and the price of gold. If gold had declined based only on great retail sales, then it surely should have soared based on disappointing retails sales in June, right? It plunged then.
For many weeks, months, and years, I’ve been writing that markets don’t need a trigger to move in a certain way. Getting one could speed things up, but the markets might eventually rally or decline on just about any piece of news, provided that they really “want to”. By markets “wanting” to move in a given way, I mean the fact that markets move in trends and cycles, and even if a given market has a very favorable fundamental situation for the long run, it doesn’t mean that it won’t slide in the short or medium term. That’s how markets work, and that’s been the case for decades, regardless of what gold permabulls might tell you.
Let’s face it, the monetary authorities around the world are printing ridiculous amounts of money, stagflation is likely next, and gold is extremely likely to soar based on that in the following years, just like what we saw in the 1970s.
But.
This is already the case – lots of money has been already printed, and the world has been suffering from the pandemic for well over a year. Gold should be soaring in this environment! Silver should be soaring! Gold stocks should be soaring too!
And what’s the reality?
Gold failed to hold its gains above the 2011 highs. Can you imagine that? So much money printed. Excessive debt. Even pandemic! And gold still failed to hold gains above its 2011 highs. If this doesn’t make you question the validity of the bullish narrative in the medium term in the precious metals sector, consider this:
Silver – with an even better fundamental situation than gold – wasn’t even close to its 2011 highs (~50). The closest it got to this level was a brief rally above $30. And now, after even more money was printed, silver is in its low 20s.
And gold stocks? Gold stocks are not above their 2011 highs, they were not even close. They were not above their 2008 highs either. In fact, the HUI Index – the flagship proxy for gold stocks – is trading below its 2003 high! And that’s in nominal prices. In real prices, it’s even lower. Just imagine how weak the precious metals sector is if the part of the sector that is supposed to rally first (that’s what we usually see at the beginning of major rallies) is underperforming in such a ridiculous manner.
And that’s just the beginning of the decline in the mining stocks.
More to Come!
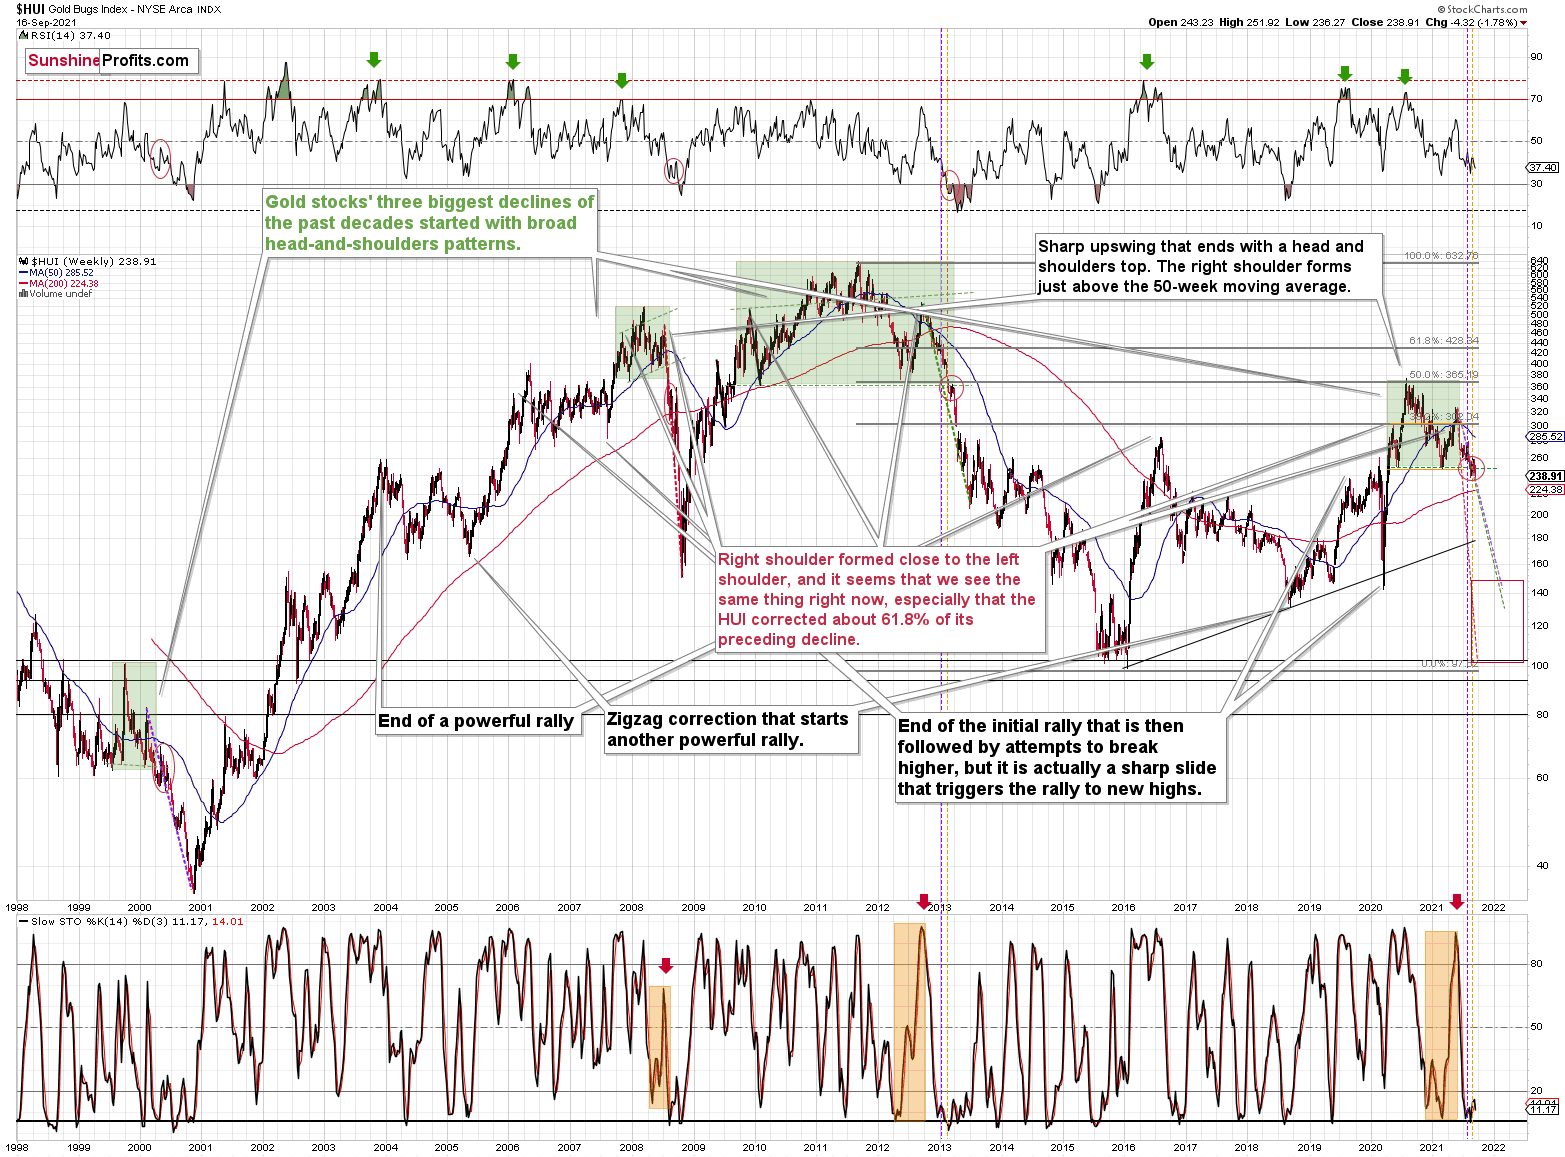
The breakdown below the broad head and shoulders pattern (marked with green) was verified. The previous three similar patterns (also marked with green) were followed by huge declines, and I copied the moves to the current situation (marked with dashed lines). This simple analogy tells us that the HUI Index could slide to the 100 – 150 range, meaning that it could even decline to its early 2016 low.
Can it really happen? With the precious metals market as weak as it is right now (from the medium-term point of view, not the long-term one) — of course.
On a short-term note, please take a look at what silver just did.
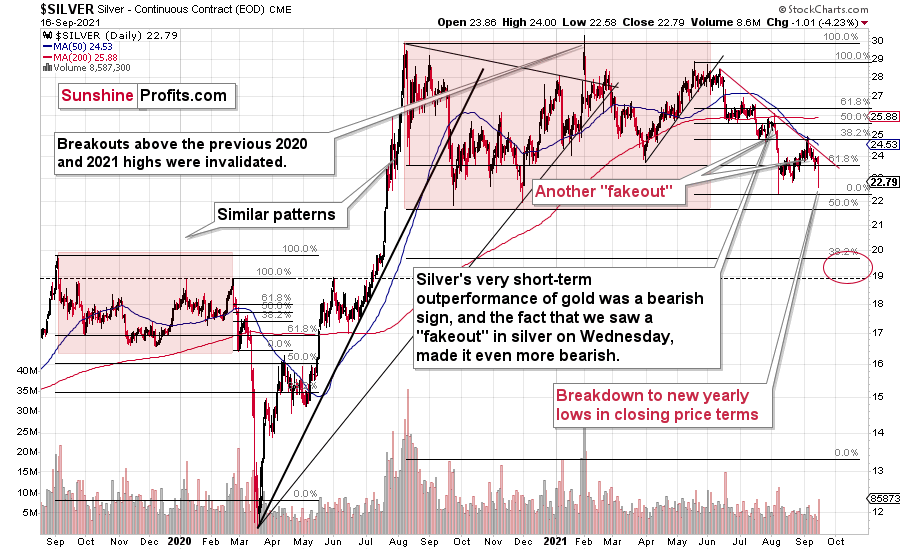
It broke to new 2021 lows in terms of the closing prices. Indeed, back in August, silver’s intraday low was lower, but it didn’t close as low. That’s a major confirmation of the bearish price forecast for silver.
The Gold Miners
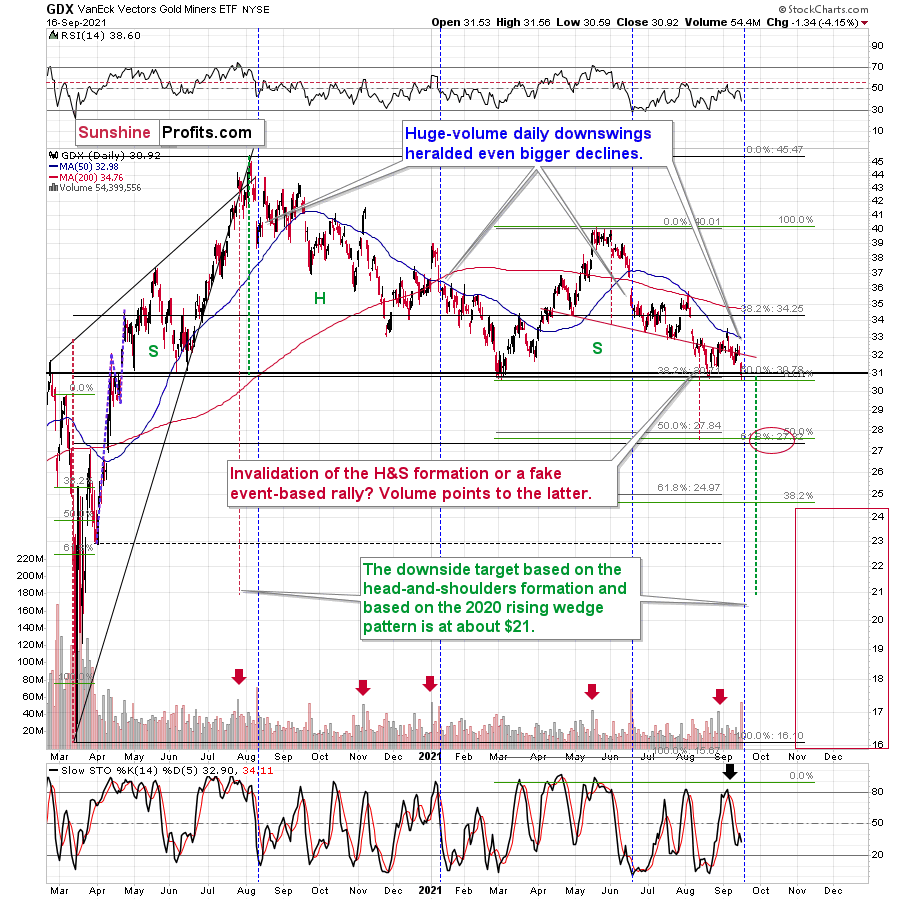
Gold miners almost closed at a new 2021 low, but this “almost” is not a sign of strength, especially when we look at the volume. That was one of the biggest volume levels that we’ve seen so far this year. Let’s examine what happened in the mining stocks after similarly big volume levels accompanied daily declines.
- August 2020 – miners moved higher in the short term, but that was the beginning of a major decline.
- January 2021 – miners moved back and forth in the short term, but that was the beginning of a major decline.
- June 2021 – miners moved back and forth in the short term, but that was the beginning of a major decline (higher mining stock prices have never been seen since that time)
History rhymes, and while the short-term “rhyme” is not crystal clear, it seems that we’re about to see huge declines in the medium term (within the next several months).
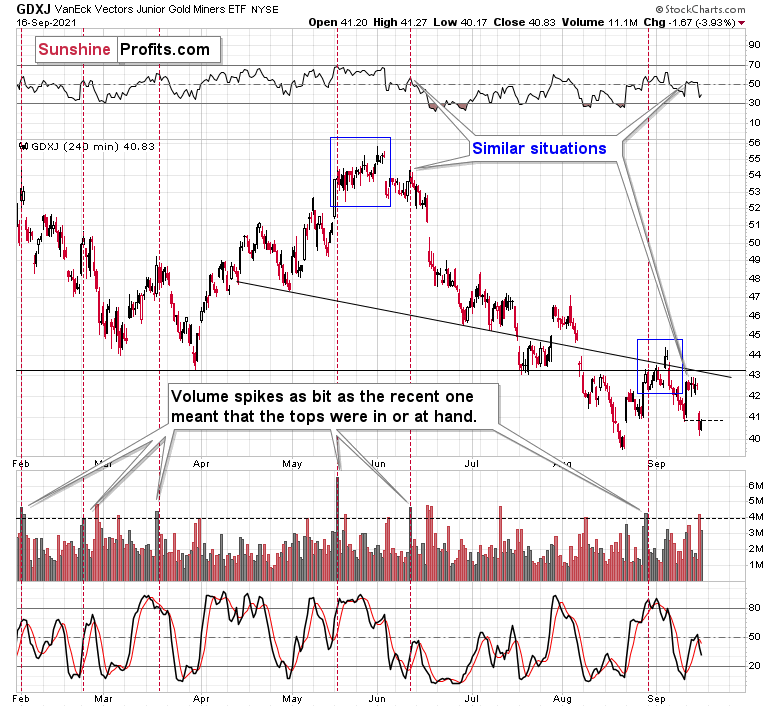
Junior miners retraced some of their gains, but that was just a comeback to the previous September lows, nothing more. When the breakdown is verified (most likely shortly), the decline will likely continue. So, juniors are likely to slide profoundly in the following weeks.
Having said that, let’s take a look at the markets from a more fundamental point of view.
Skating on Thin Ice
After U.S. retail sales outperformed on Sep. 16, the economic surprise re-accelerated the Fed’s taper timeline. And with the USD Index and U.S. Treasury yields loving every minute of it, the double-edged sword cut through the PMs (even though it wasn’t the key reason why PMs declined).
Moreover, while a hawkish Fed, parched liquidity, a stronger U.S. dollar and rising U.S. Treasury yields combine to create the fundamental doomsday scenario for the PMs, another important variable could enter the equation in the coming months. Case in point: with the general stock market sidestepping a material correction for months on end, a profound drawdown could accelerate the pace of the PMs’ slide. For example, with liquidity-fueled assets share of U.S. equities only rivaled by the dot-com bubble, the end of QE could foster immense volatility.
Please see below:
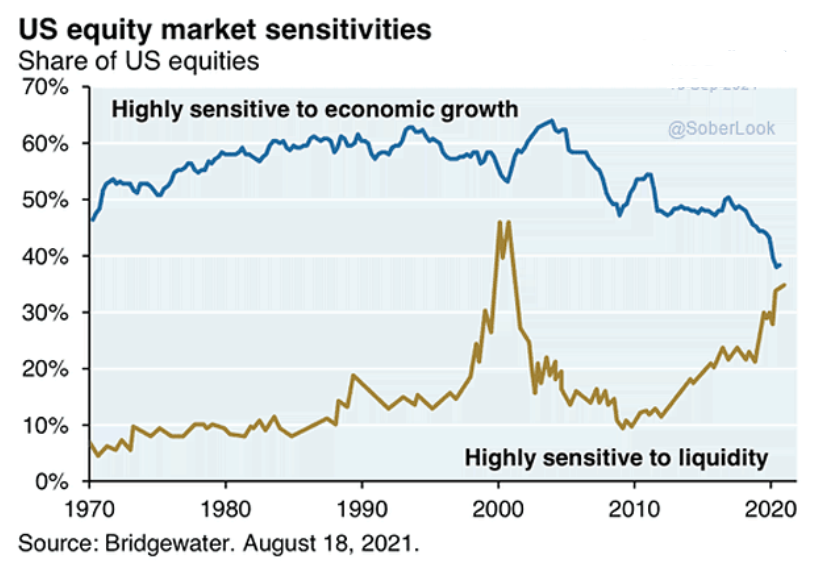
To explain, the blue line above tracks the percentage of U.S. stocks that are highly sensitive to economic growth, while the gold line above tracks the percentage of U.S. stocks that are highly sensitive to liquidity. If you analyze the right side of the chart, you can see that a sharp divergence has occurred since the global financial crisis (GFC). However, if the Fed’s forthcoming taper is followed by a faster-than-expected increase in interest rates (to control inflation), the impact on liquidity-fueled stocks (like Big Tech) could have a profound impact on the overall indices.
To that point, with global central banks already reducing liquidity and a hastening of the pace poised to commence in the coming months, the elephant in the room may end up shaking equities’ foundation.
Please see below:
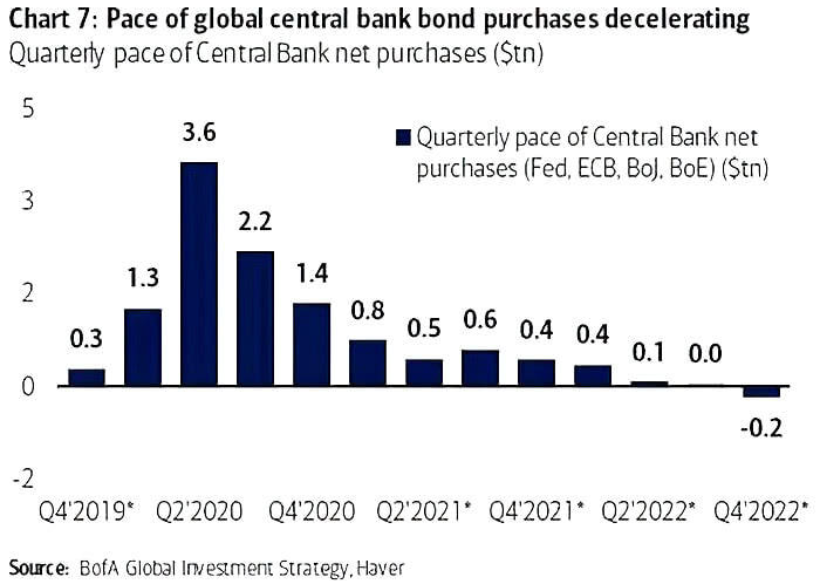
To explain, the blue bars above track the historical and Bank of America’s projected path for net-QE purchases by the Fed, EBC, BoJ and the BoE. If you analyze the right side of the chart, you can see that major central banks’ QE purchases should hit zero by the third quarter of 2022 and turn negative by the fourth quarter of 2022. And with investors’ propensity to front-run market-moving events, shifts in asset allocations should occur much sooner.
Likewise, with the G3 credit impulse (China, U.S., Europe) – which measures the flow of new credit issued from the private sector as a percentage of regions’ GDP – falling off a cliff, not only is the sharp decline bearish for the general stock market, but it’s also bearish for the EUR/USD.
Please see below:
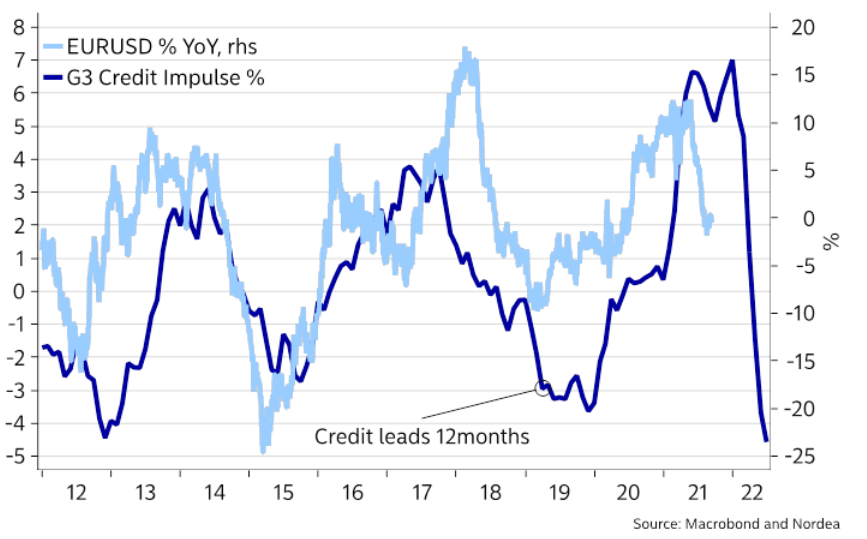
To explain, the dark blue line above tracks the G3 credit impulse, while the light blue line above tracks the year-over-year (YoY) percentage change in the EUR/USD. If you analyze the right side of the chart, you can see that the former signals a sharp decline in the latter. Moreover, even though a falling G3 credit impulse is also bearish for U.S. Treasury yields, it’s common for interest rates to decline when the general stock market suffers stress. As a result, whether economic growth re-accelerates and U.S. Treasury yields rise or growth falters and the general stock market corrects (resulting in a safe-haven bid for the U.S. dollar) both outcomes are fundamentally bearish for the PMs.
Supporting the latter, Bank of America’s latest Global Fund Manager Survey revealed that the “disconnect between asset prices & fundamentals [is] growing.”
Please see below:
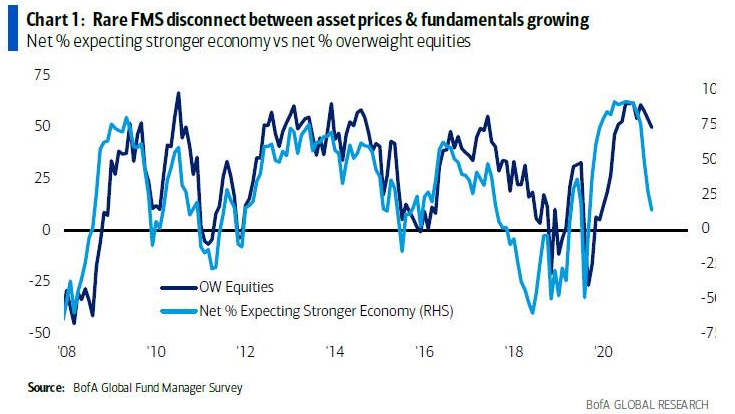
To explain, the dark blue line above tracks the net percentage of respondents that are overweight equities, while the light blue line above tracks the net percentage of respondents that expect stronger economic growth. If you analyze the right side of the chart, you can see that intuitional investors’ equity positioning still far exceeds what’s implied from economic growth prospects. As a result, if the dark blue line moves lower and reconnects with the light blue line, plenty of sell orders will hit the market.
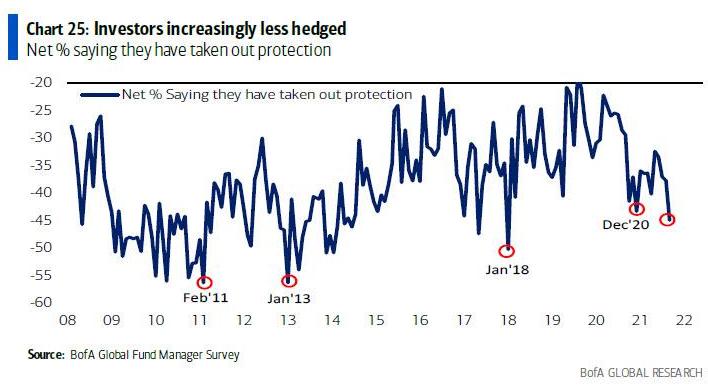
Hedging? What Hedging?
On top of that, even while institutional investors acknowledge the disconnection between asset prices and fundamentals, they’re positioned as if nothing can go wrong. And with hedging activity now at its lowest level since January 2018, the S&P 500 proceeded to fall by 12% the last time investors threw caution to the wind (the red circle labeled Jan ’18).
Please see below:
Even more ominous, stagflation concerns are rising. And when inflation outperformance coincides with economic underperformance, it puts the Fed between a rock and a hard place. And if the central bank has to choose between calming inflation (at the expense of economic growth) or stimulating the economy (which further stokes inflation), a realization is the worst-case scenario for the S&P 500.
Please see below:
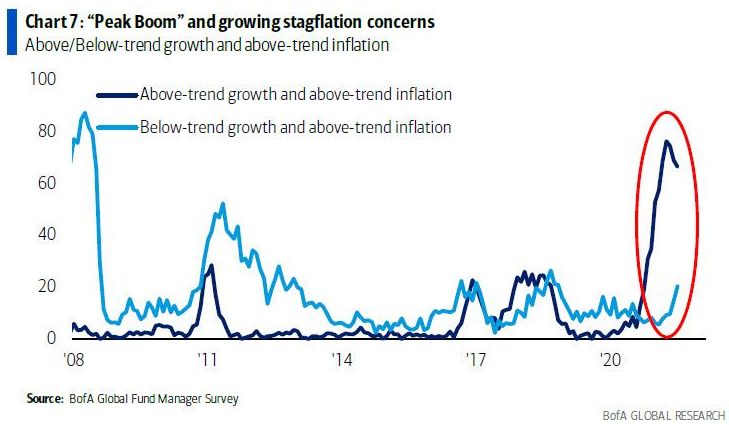
To explain, the dark blue line above tracks the net percentage of respondents that expect above-trend growth and above-trend inflation, while the light blue line above tracks the net percentage of respondents that expect below-trend growth and above-trend inflation. If you analyze the red circle on the right side of the chart, you can see that growth-with-inflation prophecies are losing momentum (the dark blue line), while fears of low growth and persistent inflation are increasing (the light blue line). Thus, if the latter becomes reality, the Fed’s conundrum could bring down equities’ entire house of cards.
In the meantime, though, while the zombified stock market continues to follow the Fed’s lead, volatility has been sucked out of the system. However, with two-way markets commonplace throughout much of history, the S&P 500’s streak of skirting a 5% drawdown will likely end sooner rather than later.
Please see below:
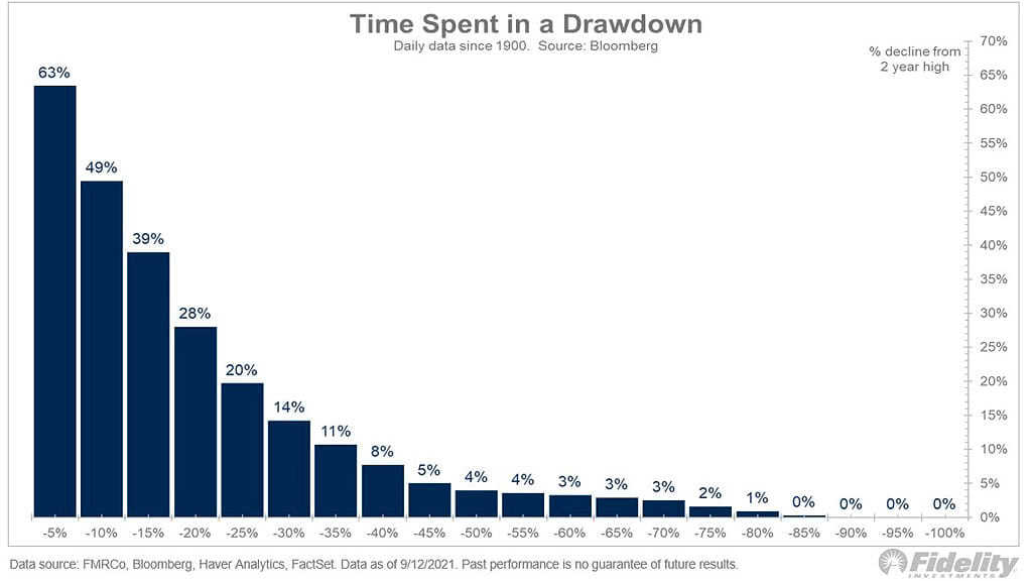
To explain, the blue bars above depict the amount of time that the S&P 500 has spent suffering various drawdowns since 1900. If you analyze the left side of the chart, you can see that the S&P 500 has spent 63% of its life enduring a 5% correction and 49% of its life enduring a 10% correction. Thus, while TINA (there is no alternative) elicits feelings of invincibility, history suggests otherwise.
Delta Reshuffled the Deck… a Bit
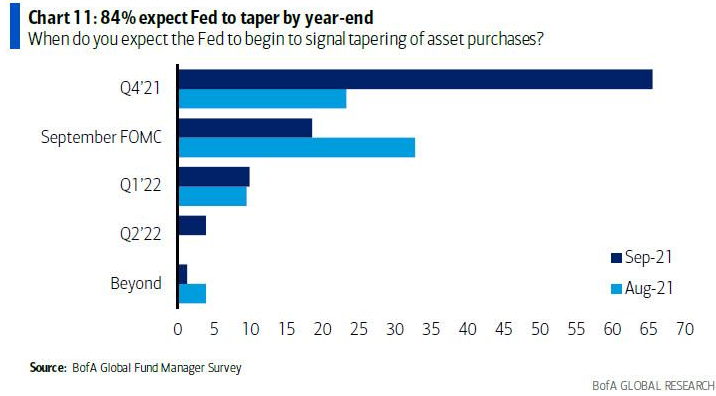
Finally, while the Delta variant has likely taken a September taper announcement off the table, the Fed’s bond-buying program is likely on its last legs. As evidence, 84% of institutional investors expect the Fed to announce its taper timeline before the end of 2021.
Please see below:
Even more revealing, the financial media has grabbed the taper baton and run with it. And with today’s attention rivaling the 2013 taper tantrum, the writing is largely on the wall.
Please see below:
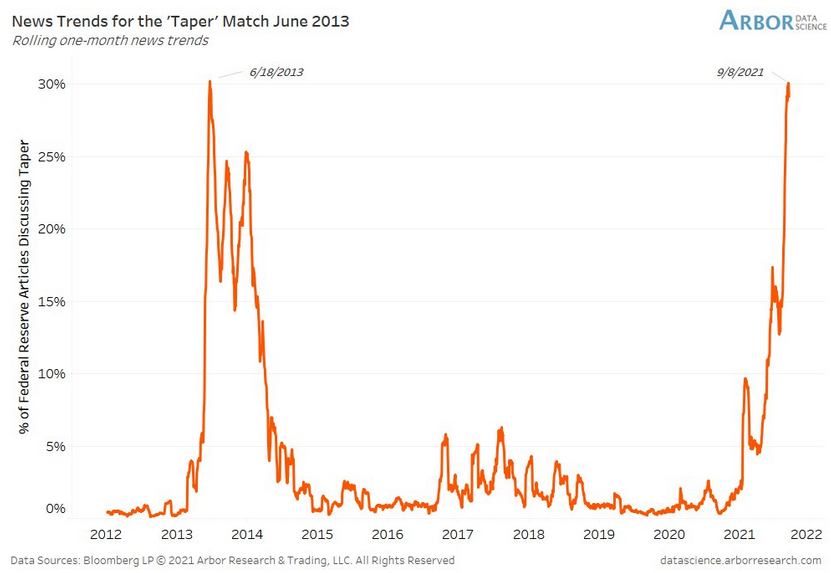
To explain, the orange line above tracks the one-month rolling number of news stories that are “discussing taper.” If you analyze the right side of the chart, you can see that all eyes are glued to the Fed. Moreover, when the central bank was given this much attention in 2013, the taper debate was all but over. As a result, the media pressure should elicit a similar outcome this time around.
In conclusion, the PMs suffered mightily on Sep. 16, with gold, silver and mining stocks all participating in the bloodbath. And with the USD Index basking in the glory and U.S. Treasury yields ripping higher, the PMs’ main adversaries had the upper hand on Sep. 16. Moreover, even though the WTI has had a correlation of -0.81 with the USD Index since 2006, crude barely flinched. And with higher oil prices only exacerbating the inflationary pressures, the Fed’s conundrum could result in similar sell-offs for the PMs in the coming months.
Overview of the Upcoming Part of the Decline
- It seems to me that the corrective upswing in gold is over or close to being over, and the big decline seems to be already underway.
- It seems that the first stop for gold will be close to its previous 2021 lows, slightly below $1,700. Then it will likely correct a bit, but it’s unclear if I want to exit or reverse the current short position based on that – it depends on the number and the nature of the bullish indications that we get at that time.
- After the above-mentioned correction, we’re likely to see a powerful slide, perhaps close to the 2020 low ($1,450 - $1,500).
- If we see a situation where miners slide in a meaningful and volatile way while silver doesn’t (it just declines moderately), I plan to switch from short positions in miners to short positions in silver. At this time, it’s too early to say at what price levels this could take place, and if we get this kind of opportunity at all – perhaps with gold close to $1,600.
- I plan to exit all remaining short positions when gold shows substantial strength relative to the USD Index while the latter is still rallying. This might take place with gold close to $1,350 - $1,400. I expect silver to fall the hardest in the final part of the move. This moment (when gold performs very strongly against the rallying USD and miners are strong relative to gold after its substantial decline) is likely to be the best entry point for long-term investments, in my view. This might also happen with gold close to $1,375, but it’s too early to say with certainty at this time. I expect the final bottom to take place near the end of the year, perhaps in mid-December.
- As a confirmation for the above, I will use the (upcoming or perhaps we have already seen it?) top in the general stock market as the starting point for the three-month countdown. The reason is that after the 1929 top, gold miners declined for about three months after the general stock market started to slide. We also saw some confirmations of this theory based on the analogy to 2008. All in all, the precious metals sector is likely to bottom about three months after the general stock market tops.
- The above is based on the information available today, and it might change in the following days/weeks.
You will find my general overview of the outlook for gold on the chart below:
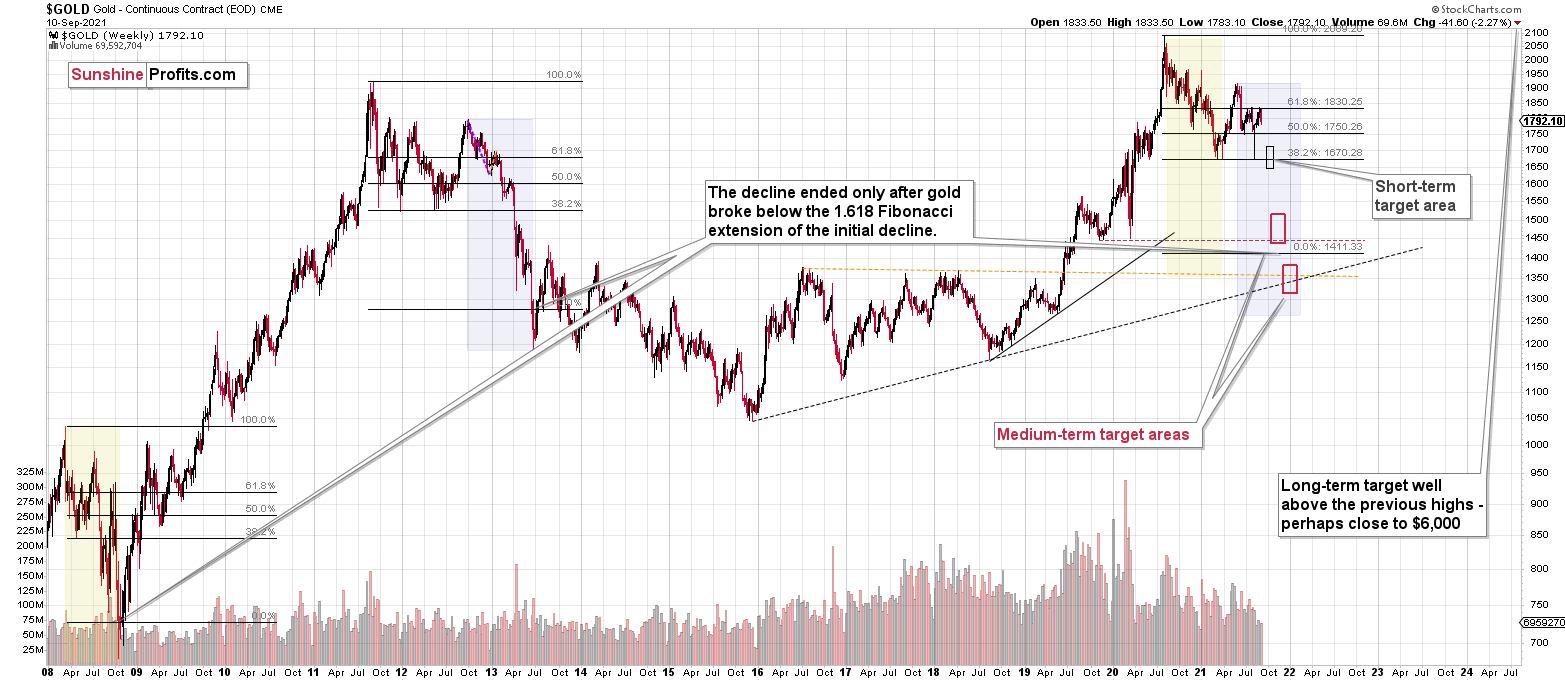
Please note that the above timing details are relatively broad and “for general overview only” – so that you know more or less what I think and how volatile I think the moves are likely to be – on an approximate basis. These time targets are not binding or clear enough for me to think that they should be used for purchasing options, warrants or similar instruments.
Summary
To summarize, the previous strength in the precious metals sector was reversed, just like it was likely to, and the most bearish thing about it is that it happened practically without a good fundamental trigger. This means that the precious metals sector simply can’t wait to decline to much lower levels.
It seems that our profits from the short positions are going to become truly epic in the following weeks.
After the sell-off (that takes gold to about $1,350 - $1,500), I expect the precious metals to rally significantly. The final part of the decline might take as little as 1-5 weeks, so it's important to stay alert to any changes.
Most importantly, please stay healthy and safe. We made a lot of money last March and this March, and it seems that we’re about to make much more on the upcoming decline, but you have to be healthy to enjoy the results.
As always, we'll keep you - our subscribers - informed.
By the way, we’re currently providing you with the possibility to extend your subscription by a year, two years or even three years with a special 20% discount. This discount can be applied right away, without the need to wait for your next renewal – if you choose to secure your premium access and complete the payment upfront. The boring time in the PMs is definitely over, and the time to pay close attention to the market is here. Naturally, it’s your capital, and the choice is up to you, but it seems that it might be a good idea to secure more premium access now while saving 20% at the same time. Our support team will be happy to assist you in the above-described upgrade at preferential terms – if you’d like to proceed, please contact us.
To summarize:
Trading capital (supplementary part of the portfolio; our opinion): Full speculative short positions (300% of the full position) in mining stocks are justified from the risk to reward point of view with the following binding exit profit-take price levels:
Mining stocks (price levels for the GDXJ ETF): binding profit-take exit price: $35.73; stop-loss: none (the volatility is too big to justify a stop-loss order in case of this particular trade)
Alternatively, if one seeks leverage, we’re providing the binding profit-take levels for the JDST (2x leveraged) and GDXD (3x leveraged – which is not suggested for most traders/investors due to the significant leverage). The binding profit-take level for the JDST: $16.96; stop-loss for the JDST: none (the volatility is too big to justify a SL order in case of this particular trade); binding profit-take level for the GDXD: $35.46; stop-loss for the GDXD: none (the volatility is too big to justify a SL order in case of this particular trade).
For-your-information targets (our opinion; we continue to think that mining stocks are the preferred way of taking advantage of the upcoming price move, but if for whatever reason one wants / has to use silver or gold for this trade, we are providing the details anyway.):
Silver futures downside profit-take exit price: unclear at this time - initially, it might be a good idea to exit, when gold moves to $1,683
Gold futures downside profit-take exit price: $1,683
HGD.TO – alternative (Canadian) inverse 2x leveraged gold stocks ETF – the upside profit-take exit price: $11.38
Long-term capital (core part of the portfolio; our opinion): No positions (in other words: cash
Insurance capital (core part of the portfolio; our opinion): Full position
Whether you already subscribed or not, we encourage you to find out how to make the most of our alerts and read our replies to the most common alert-and-gold-trading-related-questions.
Please note that we describe the situation for the day that the alert is posted in the trading section. In other words, if we are writing about a speculative position, it means that it is up-to-date on the day it was posted. We are also featuring the initial target prices to decide whether keeping a position on a given day is in tune with your approach (some moves are too small for medium-term traders, and some might appear too big for day-traders).
Additionally, you might want to read why our stop-loss orders are usually relatively far from the current price.
Please note that a full position doesn't mean using all of the capital for a given trade. You will find details on our thoughts on gold portfolio structuring in the Key Insights section on our website.
As a reminder - "initial target price" means exactly that - an "initial" one. It's not a price level at which we suggest closing positions. If this becomes the case (like it did in the previous trade), we will refer to these levels as levels of exit orders (exactly as we've done previously). Stop-loss levels, however, are naturally not "initial", but something that, in our opinion, might be entered as an order.
Since it is impossible to synchronize target prices and stop-loss levels for all the ETFs and ETNs with the main markets that we provide these levels for (gold, silver and mining stocks - the GDX ETF), the stop-loss levels and target prices for other ETNs and ETF (among other: UGL, GLL, AGQ, ZSL, NUGT, DUST, JNUG, JDST) are provided as supplementary, and not as "final". This means that if a stop-loss or a target level is reached for any of the "additional instruments" (GLL for instance), but not for the "main instrument" (gold in this case), we will view positions in both gold and GLL as still open and the stop-loss for GLL would have to be moved lower. On the other hand, if gold moves to a stop-loss level but GLL doesn't, then we will view both positions (in gold and GLL) as closed. In other words, since it's not possible to be 100% certain that each related instrument moves to a given level when the underlying instrument does, we can't provide levels that would be binding. The levels that we do provide are our best estimate of the levels that will correspond to the levels in the underlying assets, but it will be the underlying assets that one will need to focus on regarding the signs pointing to closing a given position or keeping it open. We might adjust the levels in the "additional instruments" without adjusting the levels in the "main instruments", which will simply mean that we have improved our estimation of these levels, not that we changed our outlook on the markets. We are already working on a tool that would update these levels daily for the most popular ETFs, ETNs and individual mining stocks.
Our preferred ways to invest in and to trade gold along with the reasoning can be found in the how to buy gold section. Furthermore, our preferred ETFs and ETNs can be found in our Gold & Silver ETF Ranking.
As a reminder, Gold & Silver Trading Alerts are posted before or on each trading day (we usually post them before the opening bell, but we don't promise doing that each day). If there's anything urgent, we will send you an additional small alert before posting the main one.
Thank you.
Przemyslaw Radomski, CFA
Founder, Editor-in-chief

