Briefly: in our opinion, full (300% of the regular position size) speculative short positions in junior mining stocks are justified from the risk/reward point of view at the moment of publishing this Alert.
Almost nothing happened in the markets yesterday, and almost nothing is happening in today’s pre-market trading, so today’s technical part of the analysis is going to be brief.
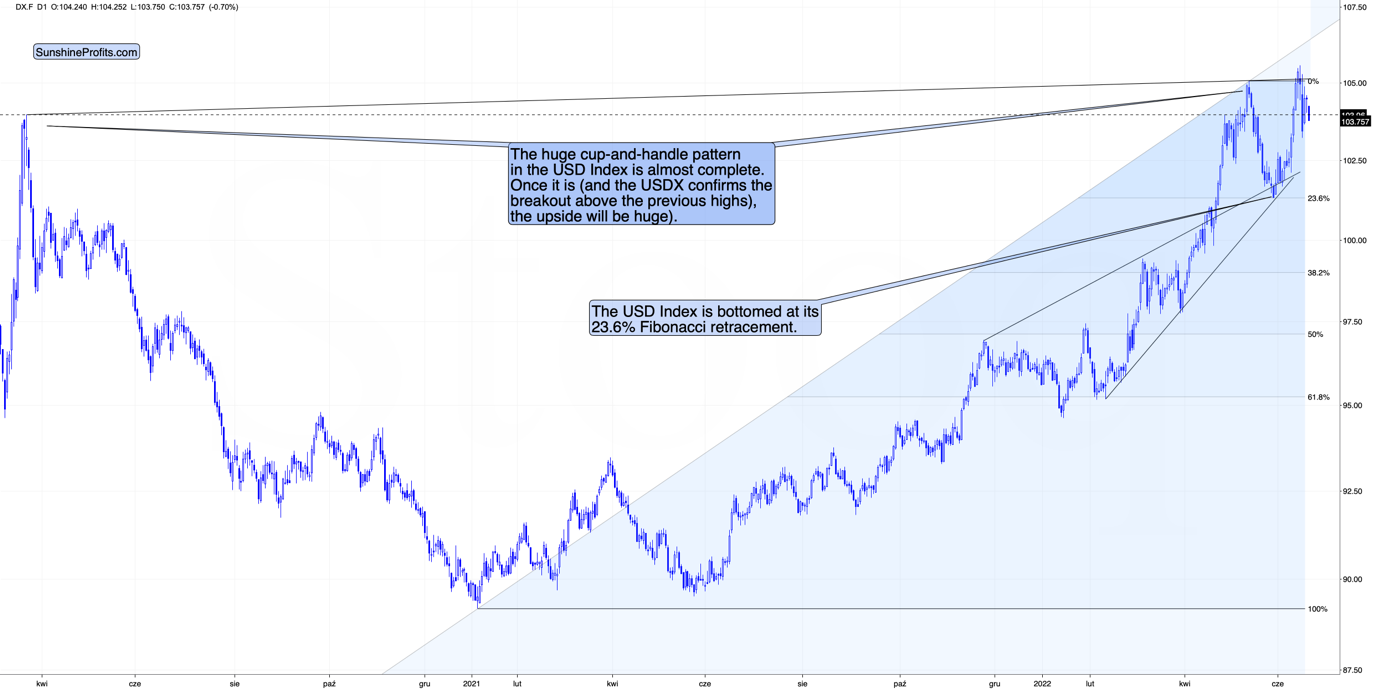
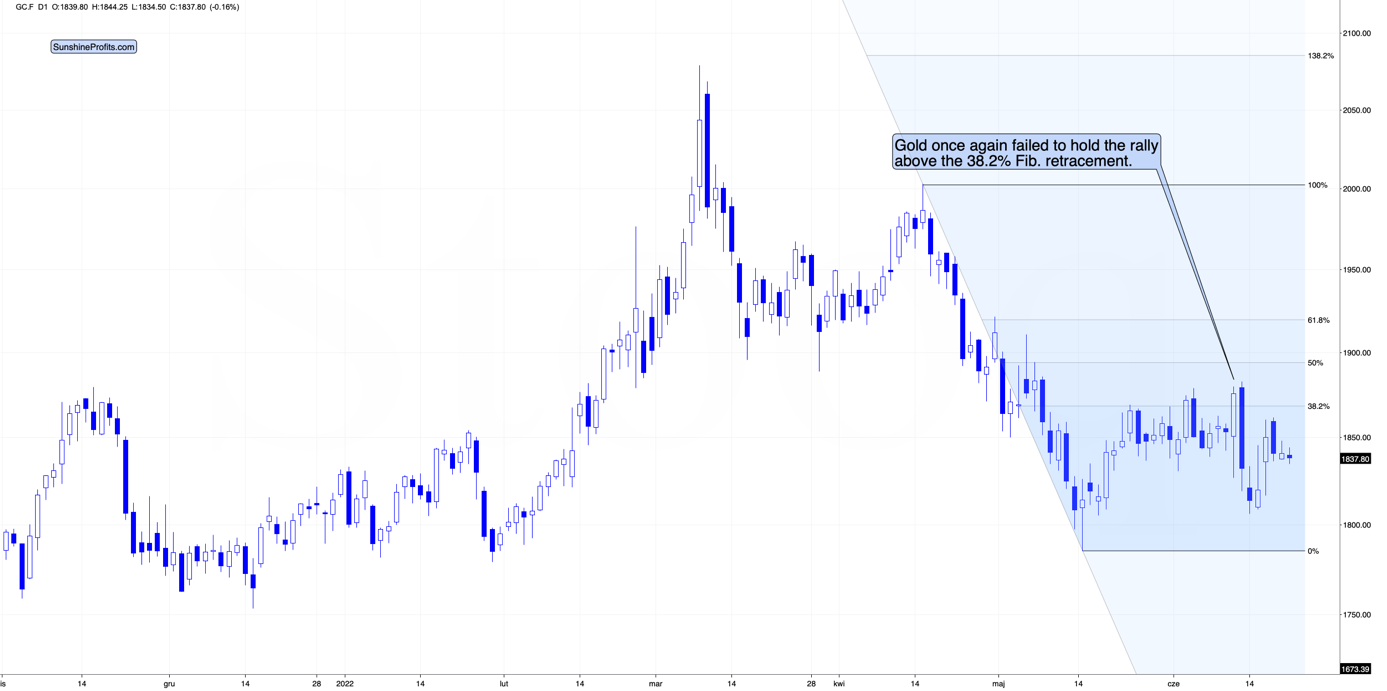
In short, my yesterday’s and Friday’s (extensive) comments remain up-to-date. The only thing that appears worth commenting on is today’s pre-market decline in the USD Index and gold’s reaction to it – the lack thereof.
The USD Index is down by about 0.7% in today’s pre-market trading, and while it’s not bearish on its own, it should theoretically trigger higher gold prices. After all, gold is priced in the U.S. dollar – at least in the charts that I’m covering.
And what happened?
Gold moved slightly lower instead. This is a sign of weakness and an indication that gold is headed lower in the coming days/weeks.
To clarify, it’s not a very strong sign, but I’ve described multiple other strong bearish signs previously, and the above is just a small cherry on the bearish cake.
Other than that, nothing particularly important happened on the markets from a technical point of view.
This means that the very bearish outlook that I’ve been describing for some time now remains up to date, and that the profits on our short positions in junior mining stocks are likely to increase in the coming weeks.
Having said that, let’s take a look at the markets from a more fundamental angle.
Work in Progress
With the Fed’s hawkish hammer pounding the financial markets, the selling pressure coincided with events unseen since 2008. Moreover, with the work in progress to reduce inflation poised to push asset prices even lower, I’ve long warned that we’re likely far from a medium-term bottom. For example, I wrote on May 31:
With recession fears decelerating and optimism returning to Wall Street, the bulls are brimming with confidence.
Please see below:
(…) [However], while U.S. stock indices rallied sharply last week, guess what else participated in the festivities?
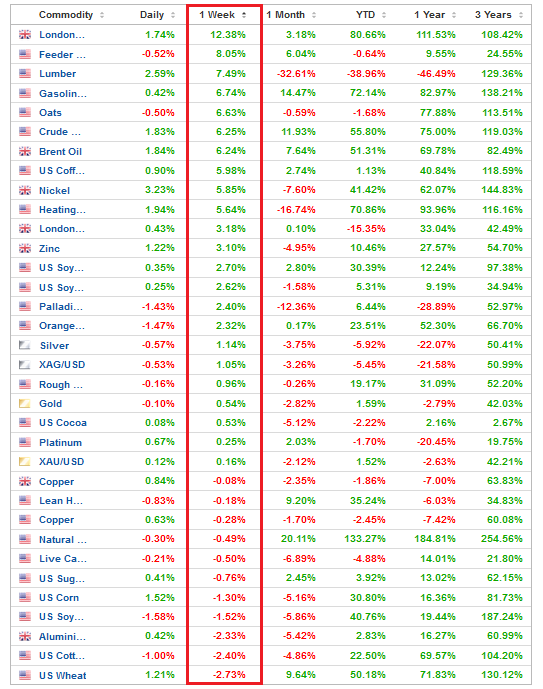
To explain, the table above tallies the performance of commodities over various time periods. If you analyze the vertical red rectangle, notice how most commodities rallied alongside equities. As a result, the thesis was on full display.
When economic optimism elicits rallies on Wall Street, that same optimism uplifts commodities. Therefore, if the Fed tries to appease investors and passively attack inflation, it will only spur more inflation.
As such, the idea of a “positive feedback loop” where ‘stocks rally, inflation cools [and] Fed tightening expectations abate” is extremely unrealistic. In fact, it’s the exact opposite. The only bullish outcome is if economically-sensitive commodities collapse on their own. Then, input inflation would subside and eventually cool output inflation, and the Fed could turn dovish.
However, the central bank has been awaiting this outcome for two years. Thus, my comments from Apr. 6 remain critical. If investors continue to bid up stock prices, the follow-through from commodities will only intensify the pricing pressures in the coming months. Therefore, investors are flying blind once again.
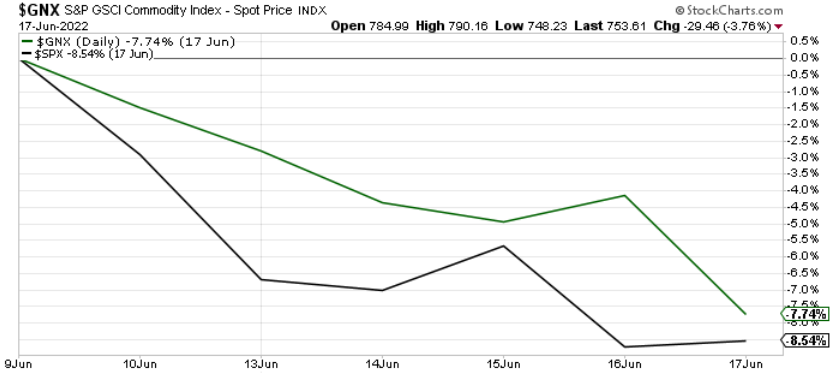
To that point, the S&P 500 reversed sharply over the last several days, and the S&P Goldman Sachs Commodity Index (S&P GSCI) followed suit.
For context, the S&P GSCI contains 24 commodities from all sectors: six energy products, five industrial metals, eight agricultural products, three livestock products, and two precious metals. However, energy accounts for roughly 54% of the index’s movement.
Please see below:
To explain, the green line above tracks the S&P GSCI, while the black line above tracks the S&P 500. As you can see, hawkish rhetoric and a 75 basis point rate hike had their desired effect.
Furthermore, I warned on Apr. 6 that higher asset prices are antithetical to the Fed’s 2% inflation goal. In a nutshell: the more the bull gores, the more inflation bites. I wrote:
Please remember that the Fed needs to slow the U.S. economy to calm inflation, and rising asset prices are mutually exclusive to this goal. Therefore, officials should keep hammering the financial markets until investors finally get the message.
Moreover, with the Fed in inflation-fighting mode and reformed doves warning that the U.S. economy “could teeter” as the drama unfolds, the reality is that there is no easy solution to the Fed’s problem. To calm inflation, it has to kill demand. As that occurs, investors should suffer a severe crisis of confidence.
Speaking of which, the fundamental thesis continues to unfold as expected. For example, Fed Chairman Jerome Powell said on Jun. 17: “The Federal Reserve’s strong commitment to our price stability mandate contributes to the widespread confidence in the dollar as a store of value.” Moreover, “The Fed’s commitment to both our dual mandate and financial stability encourages the international community to hold and use dollars.”
As a result, while I’ve long warned that unanchored inflation would elicit a hawkish response from the Fed and uplift the USD Index, the man at the top remains focused on the task at hand.
Please see below:
Likewise, Fed Governor Christopher Waller said on Jun. 18:
“This week, the FOMC took another significant step toward achieving our inflation objective by raising the Federal Funds rate target by 75 basis points. In my view, and I speak only for myself, if the data comes in as I expect I will support a similar-sized move at our July meeting.”
Please see below:
Thus, while I’ve been warning for months that the Fed isn’t bluffing, investors are suffering the consequences of their short-sighted expectations. For context, I wrote on Dec. 23, 2021:
Please note that when the Fed called inflation “transitory,” I wrote for months that officials were misreading the data. As a result, I don’t have a horse in this race. However, now, they likely have it right. Thus, if investors assume that the Fed won’t tighten, their bets will likely go bust in 2022.
Continuing the theme, Atlanta Fed President Raphael Bostic said on Jun. 17: "We're attacking inflation and we're going to do all that we can to get it back down to a more normal level, which for us has got to be 2%. We'll do whatever it takes to make that happen."
As a result, the more investors bid up stock and commodity prices, the more "muscular" the Fed's policies become.
Please see below:
Thus, while Fed officials continue to press down on the hawkish accelerator, the plight of many financial assets highlights the ferocity of central bankers’ war against inflation. Moreover, with all bouts of unanchored inflation ending in recessions over the last ~70 years, more fireworks should erupt in the months ahead.
Short Squeeze 2.0
It’s important to remember that financial assets don’t move in a straight line. Therefore, while the fundamental outlook continues to deteriorate, the algorithms may spot bullish short-term trends that let the scalpers profit in the interim. For example, I noted on Jun. 15 that one-sided positioning could (and eventually did) spark a relief rally. I wrote:
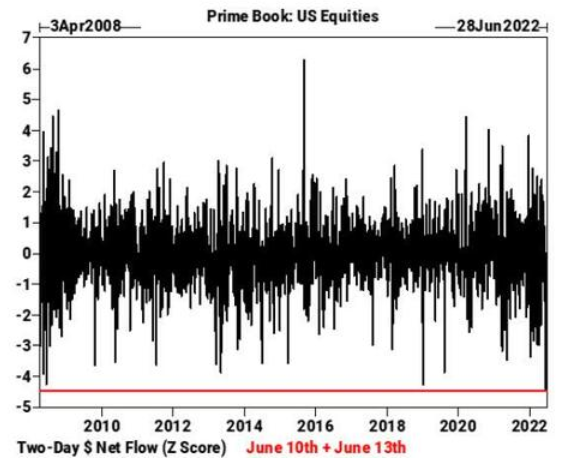
The liquidation frenzy (margin calls) that erupted recently coincided with hedge funds going on the largest two-day selling spree on record. If you analyze the chart below, you can see that Goldman Sachs’ prime brokerage data shows the z-score of combined net dollars sold on Jun. 10 and Jun. 13 exceeded the sell-off following the collapse of Lehman Brothers in 2008.
Thus, while it’s far from a sure thing, it’s prudent to note how these variables may impact the short-term price action.
To that point, last week's sell-off has too many market participants on one side of the boat. As a result, don't confuse a short squeeze with bullish price action.
Please see below:
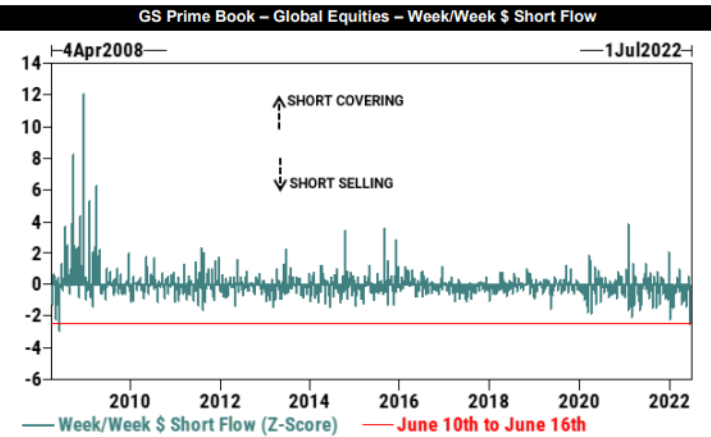
To explain, the blue bars above track the short-selling and short-covering activity of Goldman Sachs' hedge fund clients. If you analyze the red line at the bottom, you can see that the z-score of hedge funds' weekly short sales was the highest since April 2008.
In a nutshell: hedge funds shorted more stocks as the S&P 500 declined, leaving them highly exposed to a short squeeze. As a result, if the markets rally, consider the price action within the context of the above data.
Likewise, oversold conditions are also present.
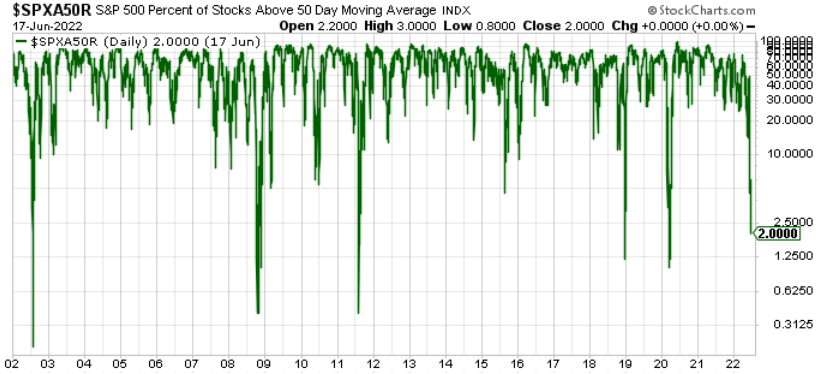
To explain, the green line above tracks the percentage of S&P 500 stocks above their 50-day moving average. If you analyze the right side of the chart, you can see that only 2% of S&P 500 constituents hold the key level, and the reading is abnormally low.
For context, it’s a contrarian indicator, meaning that too much pessimism often elicits a short-term reversion. Moreover, with the dot-com bubble, the global financial crisis (GFC), the 2011 growth scare, the COVID-19 crash, and the 2018 sell-off the only periods with lower readings, it may take a shock-and-awe event to move the metric lower in the short term.
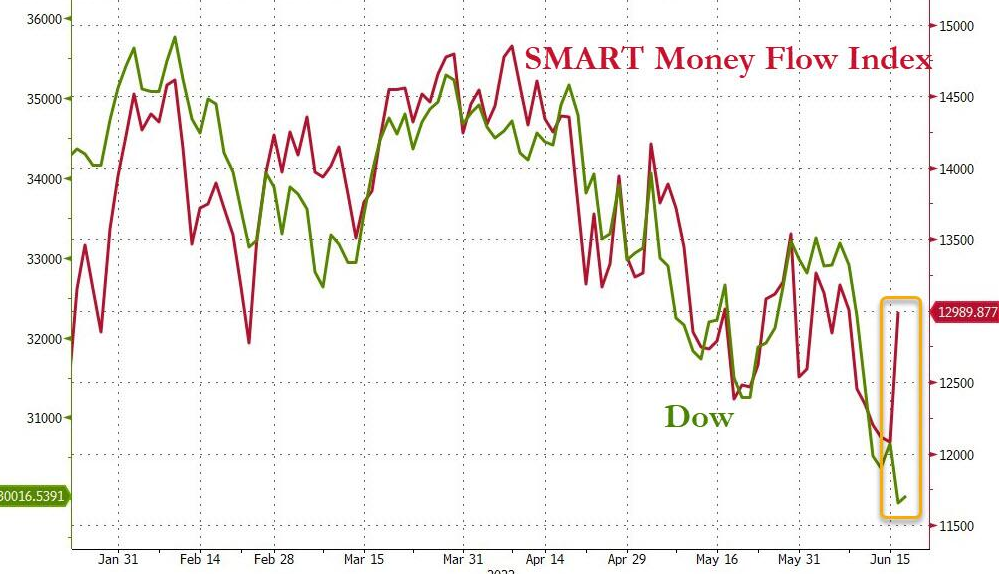
Also noteworthy, Bloomberg’s SMART Money Flow Index diverged from the Dow Jones Industrial Average (DJIA) late last week. For context, the indicator gauges the behavior of ‘smart’ investors that trade during the final hour of the day.
Please see below:
To explain, the green line above tracks the DJIA, while the red line above tracks Bloomberg’s SMART Money Flow Index. If you analyze the right side of the chart, you can see that the smart money expects some selling reprieve.
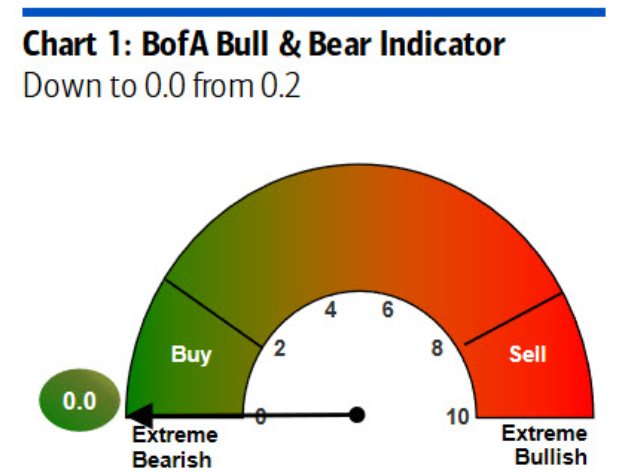
Finally, Bank of America’s Bull & Bear Indicator is at its lowest possible level. Again, this uses contrarian methodology, emphasizing how bearish over-positioning can spark sentiment shifts.
The Bottom Line
There have been several fits and starts along the GDXJ ETF’s path to lower prices, and the medium-term fundamentals remain profoundly bearish. However, rallies can increase investors’ anxiety if they’re unsure of why the optimism has manifested. As a result, while the contrarian bullish stock data may uplift the PMs in the short term, a potential sentiment reversion doesn’t impact their medium-term outlooks.
Moreover, with the Fed hawked up and the developments bullish for the USD Index and U.S. real yields, the S&P 500 and the PMs should confront lower lows in the months ahead.
In conclusion, the PMs declined on Jun. 17, as volatility has asset prices gyrating sharply by the day. However, the frantic buying/selling activity is bearish and highlights the fragility of the financial markets. Therefore, more bouts of panic should erupt in the coming months, even if the selling pressure subsides in the near term.
Overview of the Upcoming Part of the Decline
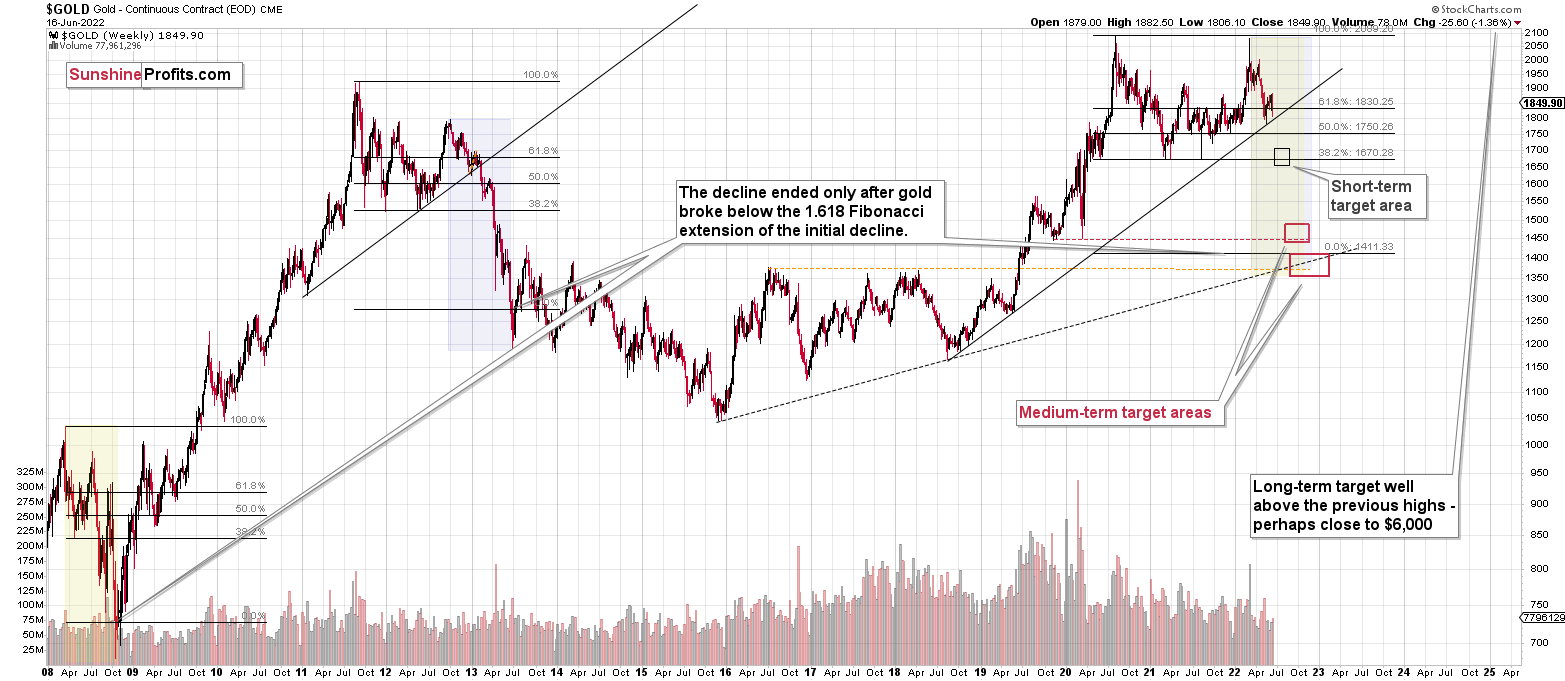
- It seems to me that the very-short-term rally in the precious metals market is either over or very close to being over. It’s so close to being over that I think it’s already a good idea to be shorting junior mining stocks.
- We’re likely to (if not immediately, then soon) see another big slide, perhaps close to the 2021 lows ($1,650 - $1,700).
- If we see a situation where miners slide in a meaningful and volatile way while silver doesn’t (it just declines moderately), I plan to – once again – switch from short positions in miners to short positions in silver. At this time, it’s too early to say at what price levels this could take place and if we get this kind of opportunity at all – perhaps with gold prices close to $1,600.
- I plan to exit all remaining short positions once gold shows substantial strength relative to the USD Index while the latter is still rallying. This may be the case with gold close to $1,400. I expect silver to fall the hardest in the final part of the move. This moment (when gold performs very strongly against the rallying USD and miners are strong relative to gold after its substantial decline) is likely to be the best entry point for long-term investments, in my view. This can also happen with gold close to $1,400, but at the moment it’s too early to say with certainty.
- The above is based on the information available today, and it might change in the following days/weeks.
You will find my general overview of the outlook for gold on the chart below:
Please note that the above timing details are relatively broad and “for general overview only” – so that you know more or less what I think and how volatile I think the moves are likely to be – on an approximate basis. These time targets are not binding or clear enough for me to think that they should be used for purchasing options, warrants, or similar instruments.
Summary
Summing up, it seems to me that the short-term rally in the precious metals market is over, and the decline will now continue. And the tiny correction’s days are likely numbered, too.
I previously wrote that the profits from the previous long position (congratulations once again) were likely to further enhance the profits on this huge decline, and that’s exactly what happened. The profit potential with regard to the upcoming gargantuan decline remains huge.
As investors are starting to wake up to reality, the precious metals sector (particularly junior mining stocks) is declining sharply. Here are the key aspects of the reality that market participants have ignored:
- rising real interest rates,
- rising USD Index values.
Both of the aforementioned are the two most important fundamental drivers of the gold price. Since neither the USD Index nor real interest rates are likely to stop rising anytime soon (especially now that inflation has become highly political), the gold price is likely to fall sooner or later. Given the analogy to 2012 in gold, silver, and mining stocks, “sooner” is the more likely outcome.
After the final sell-off (that takes gold to about $1,350-$1,500), I expect the precious metals to rally significantly. The final part of the decline might take as little as 1-5 weeks, so it's important to stay alert to any changes.
As always, we'll keep you – our subscribers – informed.
To summarize:
Trading capital (supplementary part of the portfolio; our opinion): Full speculative short positions (300% of the full position) in junior mining stocks are justified from the risk to reward point of view with the following binding exit profit-take price levels:
Mining stocks (price levels for the GDXJ ETF): binding profit-take exit price: $27.32; stop-loss: none (the volatility is too big to justify a stop-loss order in case of this particular trade)
Alternatively, if one seeks leverage, we’re providing the binding profit-take levels for the JDST (2x leveraged). The binding profit-take level for the JDST: $18.35; stop-loss for the JDST: none (the volatility is too big to justify a SL order in case of this particular trade).
For-your-information targets (our opinion; we continue to think that mining stocks are the preferred way of taking advantage of the upcoming price move, but if for whatever reason one wants / has to use silver or gold for this trade, we are providing the details anyway.):
Silver futures downside profit-take exit price: $17.22
SLV profit-take exit price: $16.22
ZSL profit-take exit price: $41.47
Gold futures downside profit-take exit price: $1,706
HGD.TO – alternative (Canadian) 2x inverse leveraged gold stocks ETF – the upside profit-take exit price: $11.87
HZD.TO – alternative (Canadian) 2x inverse leveraged silver ETF – the upside profit-take exit price: $31.87
Long-term capital (core part of the portfolio; our opinion): No positions (in other words: cash)
Insurance capital (core part of the portfolio; our opinion): Full position
Whether you’ve already subscribed or not, we encourage you to find out how to make the most of our alerts and read our replies to the most common alert-and-gold-trading-related-questions.
Please note that we describe the situation for the day that the alert is posted in the trading section. In other words, if we are writing about a speculative position, it means that it is up-to-date on the day it was posted. We are also featuring the initial target prices to decide whether keeping a position on a given day is in tune with your approach (some moves are too small for medium-term traders, and some might appear too big for day-traders).
Additionally, you might want to read why our stop-loss orders are usually relatively far from the current price.
Please note that a full position doesn't mean using all of the capital for a given trade. You will find details on our thoughts on gold portfolio structuring in the Key Insights section on our website.
As a reminder - "initial target price" means exactly that - an "initial" one. It's not a price level at which we suggest closing positions. If this becomes the case (as it did in the previous trade), we will refer to these levels as levels of exit orders (exactly as we've done previously). Stop-loss levels, however, are naturally not "initial", but something that, in our opinion, might be entered as an order.
Since it is impossible to synchronize target prices and stop-loss levels for all the ETFs and ETNs with the main markets that we provide these levels for (gold, silver and mining stocks - the GDX ETF), the stop-loss levels and target prices for other ETNs and ETF (among other: UGL, GLL, AGQ, ZSL, NUGT, DUST, JNUG, JDST) are provided as supplementary, and not as "final". This means that if a stop-loss or a target level is reached for any of the "additional instruments" (GLL for instance), but not for the "main instrument" (gold in this case), we will view positions in both gold and GLL as still open and the stop-loss for GLL would have to be moved lower. On the other hand, if gold moves to a stop-loss level but GLL doesn't, then we will view both positions (in gold and GLL) as closed. In other words, since it's not possible to be 100% certain that each related instrument moves to a given level when the underlying instrument does, we can't provide levels that would be binding. The levels that we do provide are our best estimate of the levels that will correspond to the levels in the underlying assets, but it will be the underlying assets that one will need to focus on regarding the signs pointing to closing a given position or keeping it open. We might adjust the levels in the "additional instruments" without adjusting the levels in the "main instruments", which will simply mean that we have improved our estimation of these levels, not that we changed our outlook on the markets. We are already working on a tool that would update these levels daily for the most popular ETFs, ETNs and individual mining stocks.
Our preferred ways to invest in and to trade gold along with the reasoning can be found in the how to buy gold section. Furthermore, our preferred ETFs and ETNs can be found in our Gold & Silver ETF Ranking.
As a reminder, Gold & Silver Trading Alerts are posted before or on each trading day (we usually post them before the opening bell, but we don't promise doing that each day). If there's anything urgent, we will send you an additional small alert before posting the main one.
Thank you.
Przemyslaw Radomski, CFA
Founder, Editor-in-chief


