

Briefly: in our opinion, full (300% of the regular position size) speculative short positions in junior mining stocks are justified from the risk/reward point of view at the moment of publishing this Alert.
The markets are closed in the U.S. today (June 20th), and we’re generally not posting anything on holidays, but I decided to make an exception. I’ll provide you with a brief overview of Friday’s session and reply to two questions that I received recently.
In short, the precious metals sector moved lower on Friday, and the GDXJ declined more than GDX, silver, and gold.
This daily decline didn’t change anything – it was in tune with what I wrote previously, and in tune with how the GDXJ performed in late-April and early-May before the second part of the big decline.
Consequently, the current situation remains similar to that time period, and it seems that the decline could continue any day now. What’s important, is that it probably won’t be minor. Practically everything that I wrote about that situation in my Friday’s extensive analysis remains up-to-date.
Before moving to the Q&A part of today’s Alert, I’d like to quote the part of the above-mentioned analysis that was dedicated to mining stocks – as context.
First, let me emphasize that gold stocks are declining similarly to how they did in 2008.
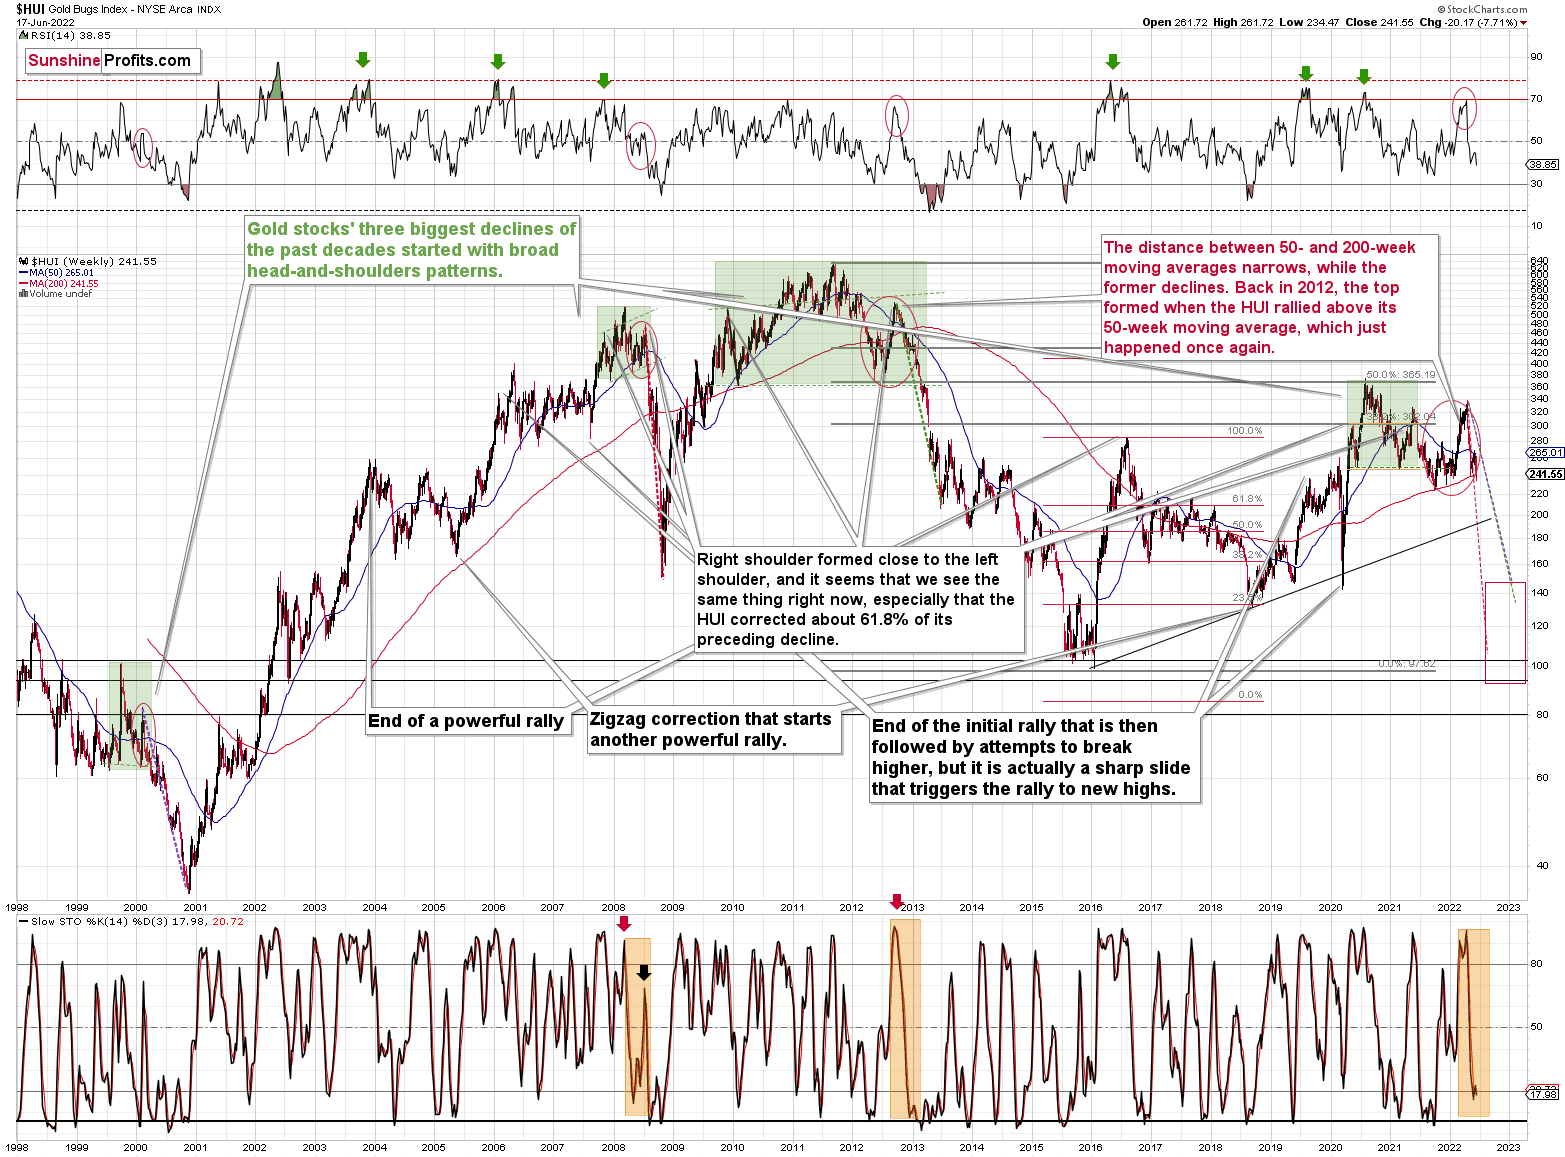
The Russian invasion triggered a rally, which was already erased, and if it wasn’t for it, the self-similarity would be very clear (note the head-and-shoulders patterns marked with green). Since the latter happened, it’s not as clear, but it seems that it’s still present. At least that’s what the pace of the current decline suggests.
I used a red dashed line to represent the 2008 decline, and copied it to the current situation. They are very similar. We even saw a corrective upswing from more or less the 200-week moving average (red line), just like what happened in 2008.
All right, let’s zoom in and see how mining stocks declined in 2008.

Back then, the GDXJ ETF was not yet trading, so I’m using the GDX ETF as a short-term proxy here.
The decline took about 3 months, and it erased about 70% of the miners’ value. The biggest part of the decline happened in the final month, though.
However, the really interesting thing about that decline – that might also be very useful this time – is that there were five very short-term declines that took the GDX about 30% lower.
I marked those declines with red rectangles. After that, a corrective upswing started. During those corrective upswings, the GDX rallied by 14.8-41.6%. The biggest corrective upswing (where GDX rallied by 41.6%) was triggered by a huge rally in gold, and since I don’t expect to see anything similar this year, it could be the case that this correction size is an outlier. Not paying attention to the outlier, we get corrections of between 14.8% and 25.1%.
The interesting thing was that each corrective upswing was shorter (faster) than the preceding one.
The first one took 12 trading days. The second one took seven trading days. The third one took 2 trading days, and the fourth and final one took just 1 trading day.
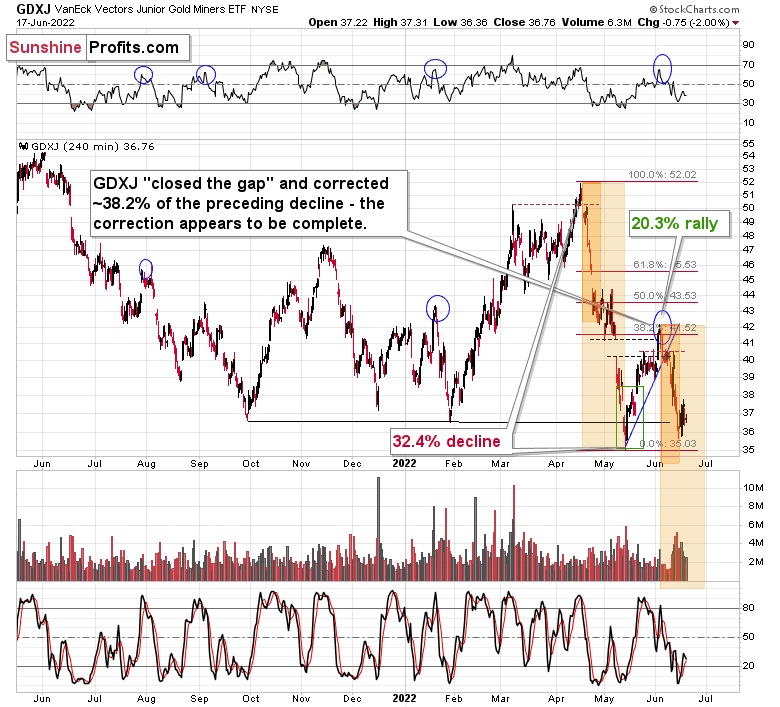
Fast forward to the current situation. Let’s take a look at the GDXJ ETF.
The GDXJ ETF declined by 32.4% and then corrected – it rallied by about 20.3%. The corrective upswing took 14 trading days.
The above is in perfect tune with the previous patterns seen in the GDX during the 2008 slide.
What does it tell us? It indicates that history can be rhymed, and while it will not be identical, we should pay attention to the indicators that worked in 2008. The next corrective upswing (a notable one, that is) might start when the GDXJ ETF declines by about 29-35% from its recent top. To clarify, I don’t claim that the above technique would be able to detect all corrective upswings, or that I aim to trade all of them. For instance, in my view, it was a good idea to enter a long position on May 12 and switch to a short position on May 26, but I wasn’t aiming to catch the intraday moves.
GDXJ could also decline a bit more than 29-35%, as let’s keep in mind that previous statistics are based on the GDX ETF and we are discussing the GDXJ here, and the latter is likely to decline even more than GDX as juniors are more correlated with the general stock market (and the latter is likely to slide).
So, let’s say that the GDXJ might decline between 29% and 40% from the recent high before triggering another notable corrective upswing (one that could take between 5 and 10 trading days based on how long the last one took and how big those corrections were in 2008).
The recent high was formed with the GDXJ ETF at $42.19. Applying the above-mentioned percentages to this price provides us with $24.78-29.32.
Now, is there any meaningful support level in this area that could stop the decline?
Yes!
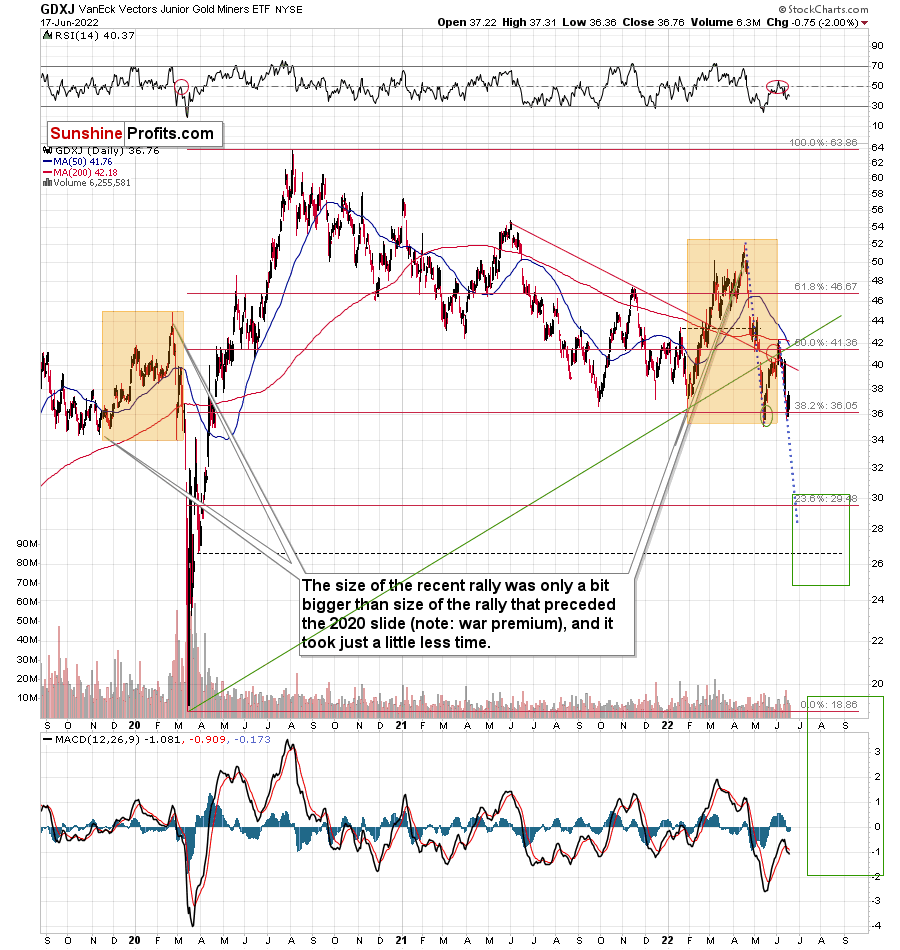
The late-March 2020 low is at $26.62, and it provides significant short-term support within the analogy-based target area.
Additionally, the above corresponds – more or less – to the size of the decline that would match the size of the April-May decline. It would be only somewhat bigger.
Let’s keep in mind that gold stocks don’t necessarily move on their own, but rather move along with gold. So, if gold moves to its strong medium-term support provided by the 2021 lows and then starts a brief rally, the same action would be likely in mining stocks.
Naturally, as always, I’ll keep you – my subscribers – informed.
Overview of the Upcoming Part of the Decline
- It seems to me that the very-short-term rally in the precious metals market is either over or very close to being over. It’s so close to being over that I think it’s already a good idea to be shorting junior mining stocks.
- We’re likely to (if not immediately, then soon) see another big slide, perhaps close to the 2021 lows ($1,650 - $1,700).
- If we see a situation where miners slide in a meaningful and volatile way while silver doesn’t (it just declines moderately), I plan to – once again – switch from short positions in miners to short positions in silver. At this time, it’s too early to say at what price levels this could take place and if we get this kind of opportunity at all – perhaps with gold prices close to $1,600.
- I plan to exit all remaining short positions once gold shows substantial strength relative to the USD Index while the latter is still rallying. This may be the case with gold close to $1,400. I expect silver to fall the hardest in the final part of the move. This moment (when gold performs very strongly against the rallying USD and miners are strong relative to gold after its substantial decline) is likely to be the best entry point for long-term investments, in my view. This can also happen with gold close to $1,400, but at the moment it’s too early to say with certainty.
- The above is based on the information available today, and it might change in the following days/weeks.
You will find my general overview of the outlook for gold on the chart below:
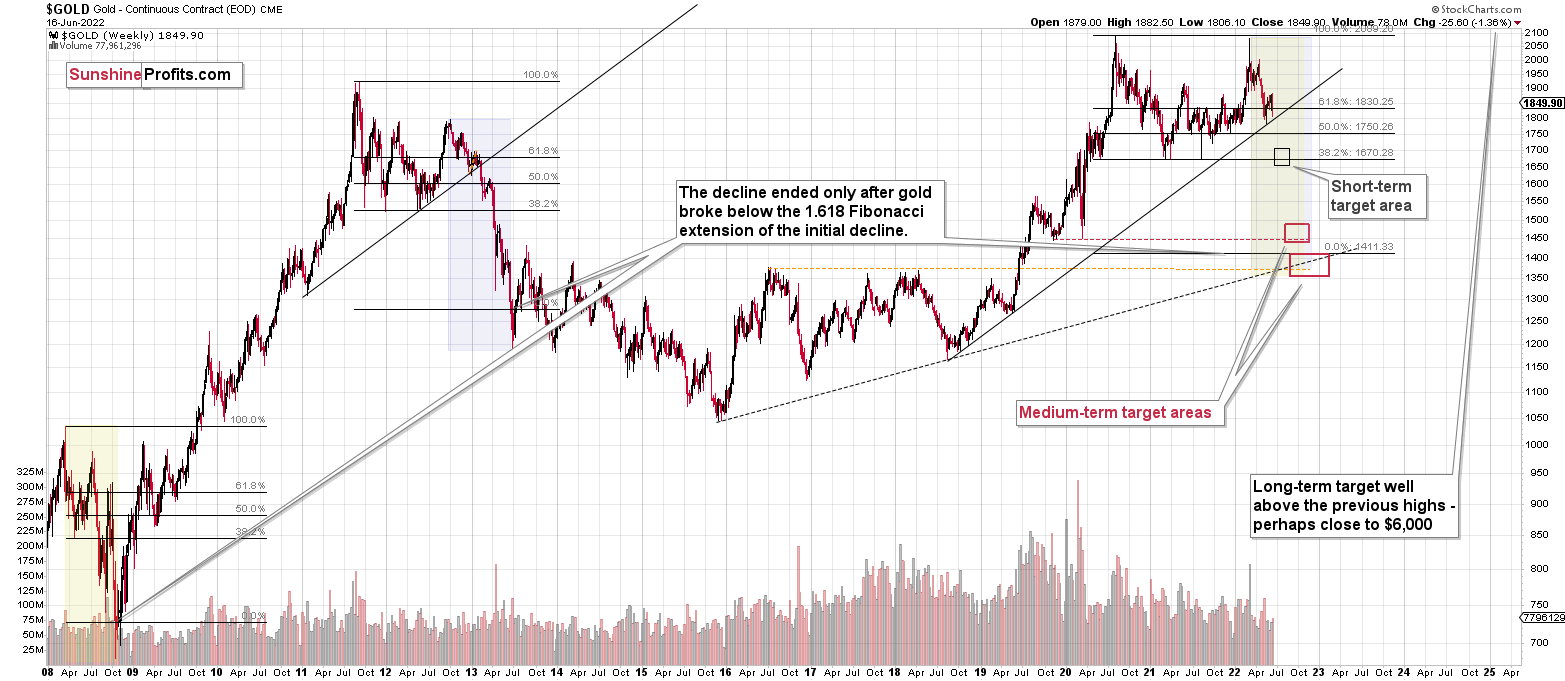
Please note that the above timing details are relatively broad and “for general overview only” – so that you know more or less what I think and how volatile I think the moves are likely to be – on an approximate basis. These time targets are not binding or clear enough for me to think that they should be used for purchasing options, warrants, or similar instruments.
Letters to the Editor
Q: Using your potential target (26.62) for GDXJ referenced today, GDXJ is looking like a 28% haircut from the current price. Applying 56% to JDST (2x Bear), I get a 16.8 target. You state 18.35. If I use the 27.32 exit price stated in the trading capital section, the JDST exit price would be even lower than 16.8. Please advise so I can learn.
A: Thanks for the question – it’s one of the “boomerang questions” that I get every now and then.
The thing is that the leveraged ETFs provide leverage to the DAILY PRICE MOVES, not to the entire price moves. So, your calculation would be correct if GDXJ reached its target during a single session. It’s not likely to happen, though, and while it’s impossible to say how long exactly it will take or what specific price path the GDXJ will take to get there, it’s possible to say that, well, it’s unlikely that this drop will happen during one session right now.
The simplest of realistic expectations is, in my opinion, to assume that it will take several days, or more. It’s probably not going to be the case that the GDXJ declines each day by the same percentage, but it’s still the best approximation that’s simple and applicable – in my view.
So, if the GDXJ declined from 36.76 to 26.62 during one session, the JDST would likely rally by twice as much percentagewise.
26.62/36.76 - 1 = -27.58%
-27.58% x (-2) = 55.16%
Let’s see what happens if it took place over 5 trading days, during which GDXJ declines by the same percent.
In order for the GDXJ to decline by 27.58% over 5 trading days, it would have to decline by (1-0.2758)^(1/5) – 1 = -6.25%
Reversing and doubling it means daily rallies by 12.5%
Let’s see how much it compounds to after five trading days.
(1+0.125)^5 -1 = 80.20%
See how big the difference is? 55.16% vs. 80.20% - that’s due to the fact that it’s not the absolute return that is doubled, but daily ones.
This effect can also diminish profits if the GDXJ moves back and forth instead of declining.
In the current case, the starting price of the JDST (Friday’s closing price) is $10.8, and adding 80.2% to it provides about a $19.46 target.
Here’s how the target changes based on the length of the equal daily declines:
1 day: $16.76
2 days: $18.20
3 days: $18.85
4 days: $19.22
5 days: $19.46
10 days: $19.99
30 days: $20.39
So, as you see, it makes a huge difference if it happens almost instantly or over several days, but it doesn’t make that much of a difference if it happens over longer periods (provided that there are no corrective upswings, and there usually are corrective upswings).
The $18.35 target for the JDST that you see in my analyses is leaning toward a more conservative estimation, while not being too conservative and pushing it to the limit. The target for the GDXJ itself is also somewhat above the final target level, and both are where they are to balance profitability and the chance of realizing the trade at all.
The most important take-away from the above simulation is that the targets for the leveraged ETFs are not set in stone and might change over time. In addition, they will get more precise as we move closer to the target price, as less time there is before it’s reached. That’s why when we’re closer to the target, I’ll likely provide updates on the profit-take price levels.
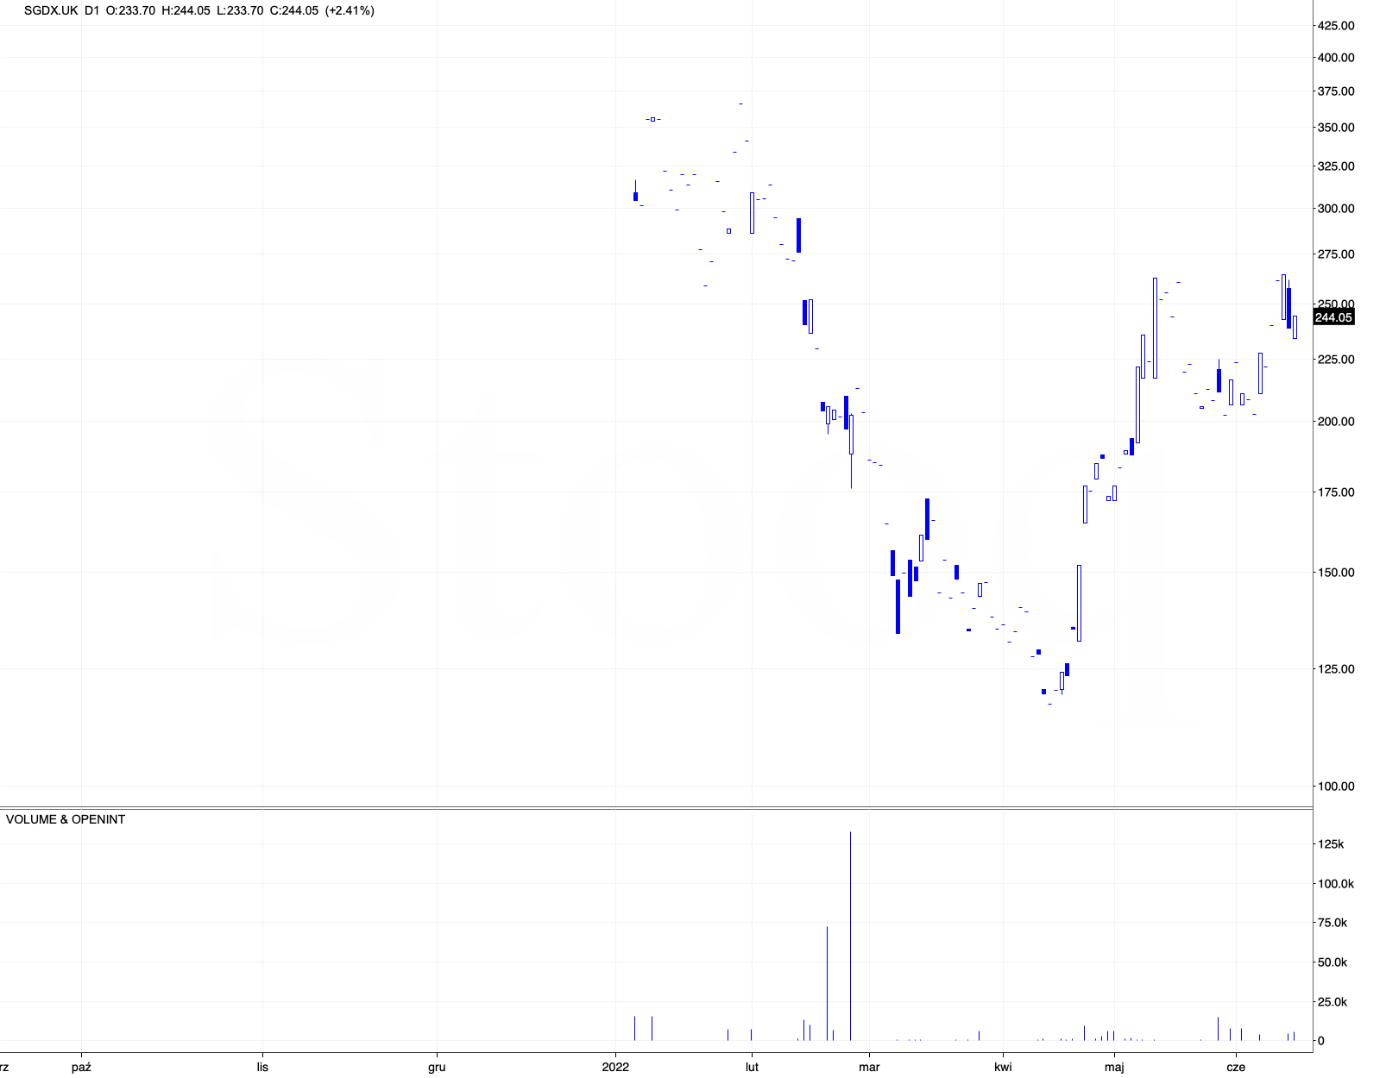
Q: Question regarding currencies and the rising dollar: I am in the UK and trade UK investment vehicles such as SGDX (3x short GDX). They are bought and priced in GBP. With the potential of the DXY rising to $120 from its current price of $105 (or a 14.28% increase) is it more valuable to hold an existing position or trade the peaks and troughs (and potentially by less SGDX should the dollar rise) later on? The potential highs and lows, should we trade them, show excellent potential. But a rising US dollar has a positive impact on my current positions too. How would profit be affected for those of us who are trading in local currency, non-USD investment products? Is it more profitable to hold what we have or trade the peaks and troughs?
A: Your question has two parts, and I’ll add one more to the mix. Here they are:
- What’s the impact of the USD Index movement on the position? In other words, will the movement in the USD Index counter the moves in the mining stocks?
- Is it better to trade in and out of the trade or to just stick to the position throughout the move given the currency exchange fluctuations?
- (The most important issue that was not mentioned): Is it better to trade in and out of the trade or to just stick to the position throughout the move given the volume and depth of the SGDX?
As for the first question, it seems to me that the movement in mining stocks will be much bigger than the one on the USD Index, especially that the former will be tripled, so it doesn’t seem that the latter is that important here.
For example, the USD Index is up by about 3% from its May/June low. The GDX is down by about 9% from its May/June high. And the SGDX is up by about 20%.
As for the second question, due to how the dynamics between USDX and SGDX look, it might not be the key factor here. The 20% is much more than the 3% in the USDX.
As for the third question, the SGDX is thinly traded, which suggests that trading in and out of it might not be the optimal strategy.
Given how low the volume is, it could be the case that even more “regular” transactions are able to move the market. There is a limit to it, as ultimately it can’t diverge too much from the underlying GDX, but it could limit one’s profitability and make the overall process stressful.
I won’t tell you what to do, as that would be investment advice and I’m not providing such. I’m simply noting the additional risk that you’re facing due to using the SGDX instrument.
What will be more profitable depends on the ability to time entry and exit points. The risk is definitely bigger and since the position is already triple leveraged, adding even more risk due to the focus on very short-term price swings, might not be the best idea for most people, especially given the additional liquidity risk.
However, it’s up to you to decide if you want to do it.
Summary
Summing up, it seems to me that the short-term rally in the precious metals market is over, and the decline will now continue. And the tiny correction’s days are likely numbered, too.
I previously wrote that the profits from the previous long position (congratulations once again) were likely to further enhance the profits on this huge decline, and that’s exactly what happened. The profit potential with regard to the upcoming gargantuan decline remains huge.
As investors are starting to wake up to reality, the precious metals sector (particularly junior mining stocks) is declining sharply. Here are the key aspects of the reality that market participants have ignored:
- rising real interest rates,
- rising USD Index values.
Both of the aforementioned are the two most important fundamental drivers of the gold price. Since neither the USD Index nor real interest rates are likely to stop rising anytime soon (especially now that inflation has become highly political), the gold price is likely to fall sooner or later. Given the analogy to 2012 in gold, silver, and mining stocks, “sooner” is the more likely outcome.
After the final sell-off (that takes gold to about $1,350-$1,500), I expect the precious metals to rally significantly. The final part of the decline might take as little as 1-5 weeks, so it's important to stay alert to any changes.
As always, we'll keep you – our subscribers – informed.
To summarize:
Trading capital (supplementary part of the portfolio; our opinion): Full speculative short positions (300% of the full position) in junior mining stocks are justified from the risk to reward point of view with the following binding exit profit-take price levels:
Mining stocks (price levels for the GDXJ ETF): binding profit-take exit price: $27.32; stop-loss: none (the volatility is too big to justify a stop-loss order in case of this particular trade)
Alternatively, if one seeks leverage, we’re providing the binding profit-take levels for the JDST (2x leveraged). The binding profit-take level for the JDST: $18.35; stop-loss for the JDST: none (the volatility is too big to justify a SL order in case of this particular trade).
For-your-information targets (our opinion; we continue to think that mining stocks are the preferred way of taking advantage of the upcoming price move, but if for whatever reason one wants / has to use silver or gold for this trade, we are providing the details anyway.):
Silver futures downside profit-take exit price: $17.22
SLV profit-take exit price: $16.22
ZSL profit-take exit price: $41.47
Gold futures downside profit-take exit price: $1,706
HGD.TO – alternative (Canadian) 2x inverse leveraged gold stocks ETF – the upside profit-take exit price: $11.87
HZD.TO – alternative (Canadian) 2x inverse leveraged silver ETF – the upside profit-take exit price: $31.87
Long-term capital (core part of the portfolio; our opinion): No positions (in other words: cash)
Insurance capital (core part of the portfolio; our opinion): Full position
Whether you’ve already subscribed or not, we encourage you to find out how to make the most of our alerts and read our replies to the most common alert-and-gold-trading-related-questions.
Please note that we describe the situation for the day that the alert is posted in the trading section. In other words, if we are writing about a speculative position, it means that it is up-to-date on the day it was posted. We are also featuring the initial target prices to decide whether keeping a position on a given day is in tune with your approach (some moves are too small for medium-term traders, and some might appear too big for day-traders).
Additionally, you might want to read why our stop-loss orders are usually relatively far from the current price.
Please note that a full position doesn't mean using all of the capital for a given trade. You will find details on our thoughts on gold portfolio structuring in the Key Insights section on our website.
As a reminder - "initial target price" means exactly that - an "initial" one. It's not a price level at which we suggest closing positions. If this becomes the case (as it did in the previous trade), we will refer to these levels as levels of exit orders (exactly as we've done previously). Stop-loss levels, however, are naturally not "initial", but something that, in our opinion, might be entered as an order.
Since it is impossible to synchronize target prices and stop-loss levels for all the ETFs and ETNs with the main markets that we provide these levels for (gold, silver and mining stocks - the GDX ETF), the stop-loss levels and target prices for other ETNs and ETF (among other: UGL, GLL, AGQ, ZSL, NUGT, DUST, JNUG, JDST) are provided as supplementary, and not as "final". This means that if a stop-loss or a target level is reached for any of the "additional instruments" (GLL for instance), but not for the "main instrument" (gold in this case), we will view positions in both gold and GLL as still open and the stop-loss for GLL would have to be moved lower. On the other hand, if gold moves to a stop-loss level but GLL doesn't, then we will view both positions (in gold and GLL) as closed. In other words, since it's not possible to be 100% certain that each related instrument moves to a given level when the underlying instrument does, we can't provide levels that would be binding. The levels that we do provide are our best estimate of the levels that will correspond to the levels in the underlying assets, but it will be the underlying assets that one will need to focus on regarding the signs pointing to closing a given position or keeping it open. We might adjust the levels in the "additional instruments" without adjusting the levels in the "main instruments", which will simply mean that we have improved our estimation of these levels, not that we changed our outlook on the markets. We are already working on a tool that would update these levels daily for the most popular ETFs, ETNs and individual mining stocks.
Our preferred ways to invest in and to trade gold along with the reasoning can be found in the how to buy gold section. Furthermore, our preferred ETFs and ETNs can be found in our Gold & Silver ETF Ranking.
As a reminder, Gold & Silver Trading Alerts are posted before or on each trading day (we usually post them before the opening bell, but we don't promise doing that each day). If there's anything urgent, we will send you an additional small alert before posting the main one.
Thank you.
Przemyslaw Radomski, CFA
Founder, Editor-in-chief

