

Briefly: in our opinion, full (250% of the regular size of the position) speculative short positions in gold, silver and mining stocks are justified from the risk/reward perspective at the moment of publishing this alert.
After Trump’s comments on interest rate hikes, the USD Index invalidated the breakout above its rising wedge channel and declined back to it. Invalidations of breakouts usually have immediate consequences, so in this case one might expect the USD Index to decline further in the following days, thus fueling gold’s, silver’s, and miners’ rally. Will the metals and miners indeed soar from their oversold price levels?
Not likely. The price levels are definitely oversold from the short-term point of view, but looking at their outlook from a broader perspective, and comparing the current decline to the 2013 one, it’s clear that the decline has likely further to go.
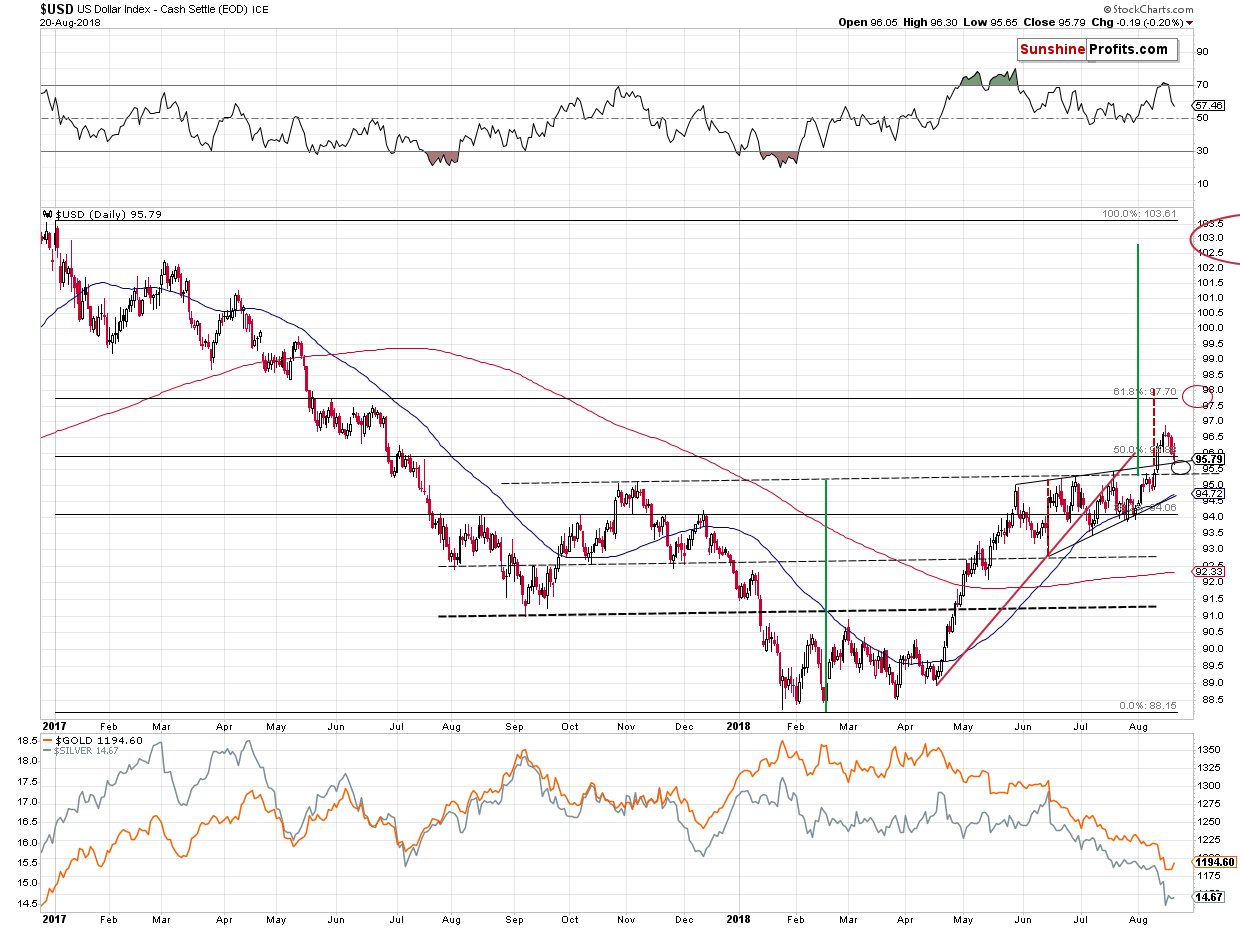
The USD Index invalidated the breakout above the short-term rising wedge pattern. That’s true. But, at the same time it seems to have verified the breakout above the neck levels of the reverse head-and-shoulders pattern, which is much more important. Let’s take a closer look (chart courtesy of http://stockcharts.com).
In Monday’s analysis, we wrote the following:
We may have indeed seen an important bearish indication based on the weekly price changes in the USD Index, but it has absolutely no implications for our trading positions in the precious metals sector. In fact, it barely changes the outlook for the USDX. The very short-term implications are bearish. But the above just isn’t the full truth. The full truth is that while we may see a move lower, it’s likely to be very small. Moreover, it’s something quite natural at this time.
The USD Index has recently broken above the rising wedge pattern and above the neck level of the reverse head-and-shoulders pattern. This means that one can expect the USDX to decline back to the previously broken levels and to verify them as support. And there will be nothing bearish about it.
These two levels create the near-term downside target area and is very close to where the USDX closed on Friday – between 95.4 and 95.7. Since the USDX just closed at about 96, the potential size of the downswing is between 0.3 and 0.6. In other words, the USDX is likely to at most repeat its Friday’s decline and perhaps it’s going to decline by only about half of its Friday’s decline.
Is this a substantial decline? No. Consequently, is it likely to trigger a substantial (!) rally in the precious metals or mining stocks? No.
To be clear, metals and miners are very oversold on a very short-term basis and are after a very volatile decline, so they could correct in a volatile manner as well, but even if this is the case, such a move would likely be very temporary and it might not be possible to trade this kind of a price swing, unless one is engaging in day-trading. The risk to reward ratio seems to favor sticking to the current short position even though we might have a temporary (probably 1-3 days at most) correction in profits.
What can we expect shortly if the USDX declines? Most likely the same thing we can expect for the U.S. currency. Something between a repeat of what we saw on Friday and half of that. Before assuming that in this case it’s a good idea to close the position and re-open it after seeing half of Friday’s move, please note that the possible (not imminent) move in the USDX could happen very quickly as both price targets are relatively close. It could just be a matter of hours or it could happen overnight. You could go to sleep with the USDX at 96 and you could wake up with it at 97 (and gold below $1,150) and already after an overnight drop to 95.5 or so. Is a chance of saving $5 - $10 on a trade in gold worth risking missing profits from a $60 - $135 decline? No, that’s not a good idea in our view. Consequently, we are not adjusting our positions in light of all the above. And in light of all that we wrote previously and what we’re about to write next today.
If you have just joined our service, be sure to read last Monday’s analysis with a list of long-term factors impacting the current move, and the analysis in which we discuss the short- and medium-term downside targets as well as the analysis in which we discuss the long-term upside potential of gold.
And yesterday, we added the following:
The USD Index indeed moved lower yesterday, closing the day at 95.79 and in today’s pre-market trading it temporarily moved to 95.44. That’s in perfect tune with what we wrote above and it likely means that the USDX’s small decline is already over or about to be over.
Did it trigger a substantially rally in the precious metals sector? No. Most importantly, it didn’t trigger any significant strength in mining stocks.
Today, we can also say that significant strength in metals and miners remains to be seen. The USD Index just moved to where it was trading in the first part of August. As you can see in the lower part of the above chart, gold is not close to analogous levels, and silver is relatively far.
And mining stocks…
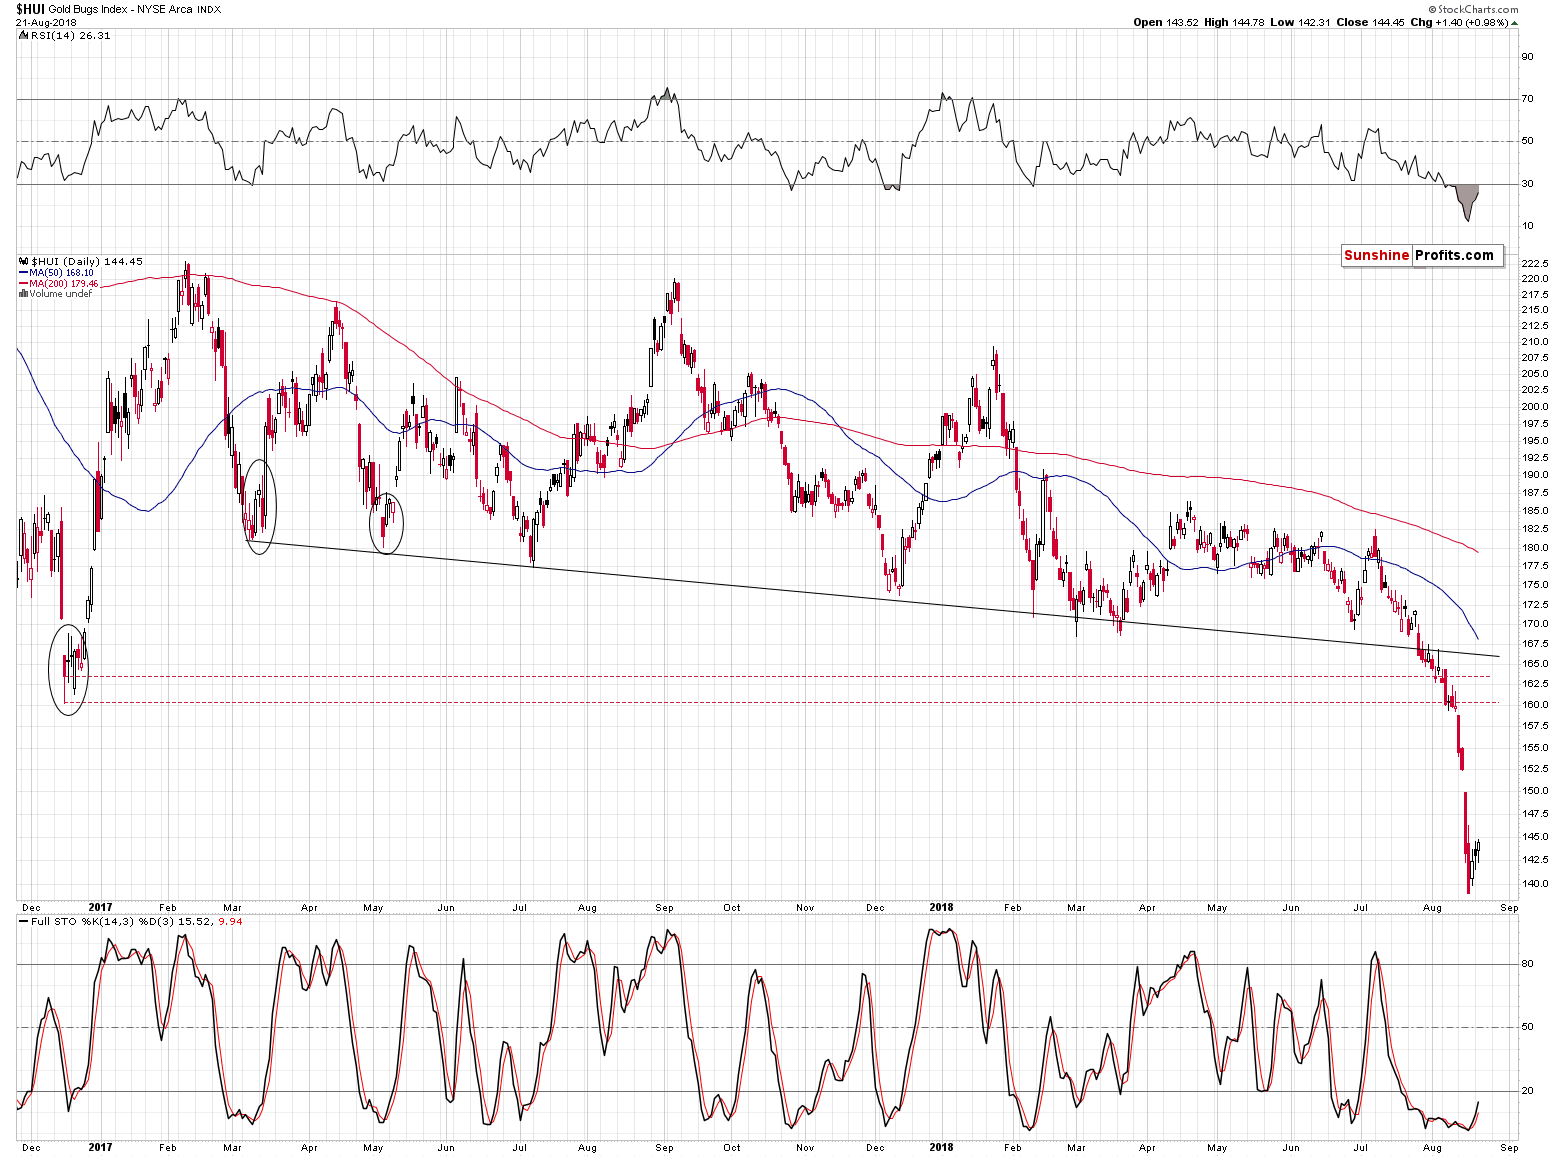
Mining stocks continue to be exceptionally weak. The decline in the USDX was quite sizable yesterday and it managed to trigger only a 1.40 rally, which is less than 1%. That’s very little - almost nothing compared to the size of this month’s decline so far. The early parts of big upswings are usually characterized by strong performance of gold stocks – and we’re seeing the exact opposite. The implications are strongly bearish.
But, let’s move to USD Index’s patterns and their invalidations. The key pattern for the U.S. currency is not the rising wedge. It’s the huge multi-month reverse head-and-shoulders pattern with the upside target of about 102.5 – 103.
The question is if this major pattern was invalidated or not. In our view, it wasn’t. The upper, dashed line (the neck level of the pattern based on the intraday highs) was broken in a rather insignificant way and the USDX is almost back above it (trading at 95.32 at the moment of writing these words). The more significant thing is that the neck level was not broken in terms of the daily closing prices.
The thick dashed line represents the neck level in these terms and as you can see, it was only touched on an intraday basis – the USDX didn’t close below it.
Moreover, since these lines are very close to the 95 level, traders might have simply viewed this round number as critical. And what did the USDX do yesterday? It moved to 94.96 on an intraday basis and then moved back up, closing at 95.15.
Consequently, since the breakout above the neck level of the reverse head-and-shoulders was clear and followed by several daily closes above it, it seems that we shouldn’t view yesterday’s brief move to this line as anything close to being a game-changer.
Besides, it’s important to note what was the likely reason for the USD’s decline.
Quoting a finance.yahoo.com article:
The dollar fell under pressure after Trump’s interview with Reuters, where he reiterated that he is “not thrilled” by the actions of the Fed and prefers a policy of low-interest rates. The dollar index lost 0.7% over the past 24 hours. EURUSD up to 1.1530, the maximum in the last 2 weeks.
Previously Trump used similar verbal interventions in an attempt to stop the U.S. Dollar rally. Such comments were made on July 19, which restrained the dollar from growth for several weeks. Investors were waiting for Powell’s reaction to the president’s dissatisfaction. However, the Fed has not changed the rhetoric, hinting at the willingness to raise rates as soon as September. In addition to raising the rate of the Fed, the dollar is also supported by Trump’s policy.
To be clear, the daily decline that followed the July 19 comments was practically the end of the declines. The time after the daily decline was a perfect moment for one to position themselves for profiting from higher USD values and lower precious metals values.
Back then, investors were waiting for Powell’s reaction and they now know that Trump’s comments didn’t change anything regarding the interest rate decision.
Consequently, it’s highly likely that yesterday’s decline in the USDX was emotional and temporary and the overall trend didn’t change – and the trend for the U.S. currency is up.
Summing up, the USD Index seems to have formed an important bottom yesterday, or it’s extremely close to it. The breakout above the rising wedge pattern was invalidated, but the much more important pattern – the reverse head-and-shoulders formation – remains in place. This means that the pause in the precious metals and mining stocks is over or very close to being over and that another big slide is likely just ahead. Based on what we can infer from the 2013 decline, it is the time that we should pay extra attention to the PMs as their decline is likely not close to being over since no meaningful support was reached in the case of gold and mining stocks.
As always, we’ll keep you – our subscribers – informed.
To summarize:
Trading capital (supplementary part of the portfolio; our opinion): Full short positions (250% of the full position) in gold, silver and mining stocks are justified from the risk/reward perspective with the following stop-loss orders and exit profit-take price levels:
- Gold: profit-take exit price: $1,062; stop-loss: $1,221; initial target price for the DGLD ETN: $82.96; stop-loss for the DGLD ETN $54.27
- Silver: profit-take exit price: $12.72; stop-loss: $15.56; initial target price for the DSLV ETN: $46.97; stop-loss for the DSLV ETN $28.87
- Mining stocks (price levels for the GDX ETF): profit-take exit price: $13.12; stop-loss: $20.81; initial target price for the DUST ETF: $80.97; stop-loss for the DUST ETF $30.87
Note: the above is a specific preparation for a possible sudden price drop, it does not reflect the most likely outcome. You will find more detailed explanation in our August 1 Alert. In case one wants to bet on junior mining stocks’ prices (we do not suggest doing so – we think senior mining stocks are more predictable in the case of short-term trades – if one wants to do it anyway, we provide the details), here are the stop-loss details and target prices:
- GDXJ ETF: profit-take exit price: $17.52; stop-loss: $30.72
- JDST ETF: initial target price: $154.97 stop-loss: $62.78
Long-term capital (core part of the portfolio; our opinion): No positions (in other words: cash)
Insurance capital (core part of the portfolio; our opinion): Full position
Important Details for New Subscribers
Whether you already subscribed or not, we encourage you to find out how to make the most of our alerts and read our replies to the most common alert-and-gold-trading-related-questions.
Please note that the in the trading section we describe the situation for the day that the alert is posted. In other words, it we are writing about a speculative position, it means that it is up-to-date on the day it was posted. We are also featuring the initial target prices, so that you can decide whether keeping a position on a given day is something that is in tune with your approach (some moves are too small for medium-term traders and some might appear too big for day-traders).
Plus, you might want to read why our stop-loss orders are usually relatively far from the current price.
Please note that a full position doesn’t mean using all of the capital for a given trade. You will find details on our thoughts on gold portfolio structuring in the Key Insights section on our website.
As a reminder – “initial target price” means exactly that – an “initial” one, it’s not a price level at which we suggest closing positions. If this becomes the case (like it did in the previous trade) we will refer to these levels as levels of exit orders (exactly as we’ve done previously). Stop-loss levels, however, are naturally not “initial”, but something that, in our opinion, might be entered as an order.
Since it is impossible to synchronize target prices and stop-loss levels for all the ETFs and ETNs with the main markets that we provide these levels for (gold, silver and mining stocks – the GDX ETF), the stop-loss levels and target prices for other ETNs and ETF (among other: UGLD, DGLD, USLV, DSLV, NUGT, DUST, JNUG, JDST) are provided as supplementary, and not as “final”. This means that if a stop-loss or a target level is reached for any of the “additional instruments” (DGLD for instance), but not for the “main instrument” (gold in this case), we will view positions in both gold and DGLD as still open and the stop-loss for DGLD would have to be moved lower. On the other hand, if gold moves to a stop-loss level but DGLD doesn’t, then we will view both positions (in gold and DGLD) as closed. In other words, since it’s not possible to be 100% certain that each related instrument moves to a given level when the underlying instrument does, we can’t provide levels that would be binding. The levels that we do provide are our best estimate of the levels that will correspond to the levels in the underlying assets, but it will be the underlying assets that one will need to focus on regarding the signs pointing to closing a given position or keeping it open. We might adjust the levels in the “additional instruments” without adjusting the levels in the “main instruments”, which will simply mean that we have improved our estimation of these levels, not that we changed our outlook on the markets. We are already working on a tool that would update these levels on a daily basis for the most popular ETFs, ETNs and individual mining stocks.
Our preferred ways to invest in and to trade gold along with the reasoning can be found in the how to buy gold section. Additionally, our preferred ETFs and ETNs can be found in our Gold & Silver ETF Ranking.
As a reminder, Gold & Silver Trading Alerts are posted before or on each trading day (we usually post them before the opening bell, but we don't promise doing that each day). If there's anything urgent, we will send you an additional small alert before posting the main one.
=====
Hand-picked precious-metals-related links:
PRECIOUS-Gold clings to 1-week high ahead of Fed minutes
South African Gold Miners and Union Deadlocked Over Wages
Silver Is ‘The Best Buy’ Right Now— Wells Fargo
Russian Central Bank Buys More Gold in Face of Tougher Sanctions
=====
In other news:
U.S. Futures Slip on Trump Legal Woes; Euro Rises: Markets Wrap
Euro nears two-week high as markets await Fed minutes, trade talks
Goldman Sachs lowers U.S 10-year Treasury yield forecast
Market milestone: This is the longest bull run in history
Pimco Veteran Says Recession Possible in as Early as Three Years
It's Complicated: New Pound-FTSE Relationship Is a Bad Omen
Banking is surprise item on list of Brexit 'no-deal' impact papers
Osmium - The World's Rarest And Densest Metal
=====
Thank you.
Sincerely,
Przemyslaw Radomski, CFA
Founder, Editor-in-chief, Gold & Silver Fund Manager
Gold & Silver Trading Alerts
Forex Trading Alerts
Oil Investment Updates
Oil Trading Alerts

