

Briefly: in our opinion, full (300% of the regular position size) speculative short positions in junior mining stocks are justified from the risk/reward point of view at the moment of publishing this Alert.
Very little happened in the precious metals market yesterday, and what I wrote and said yesterday remains up-to-date.
I got a request to comment on the USD Index (and its link with gold), and I’ll be happy to deliver.
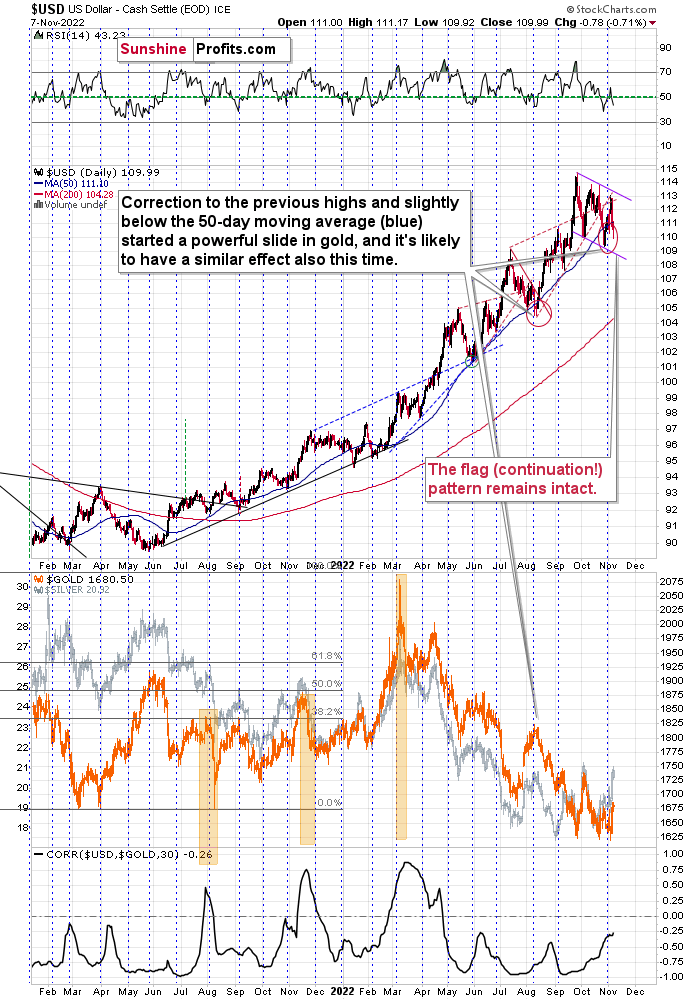
In short, the USD Index remains in its flag pattern that started in September. A flag pattern is a continuation pattern where the price trades sideways (but slightly against the trend) and it continues… until it doesn’t. Quite often, the pattern ends after two or three bottoms. We already had two, and it seems that the third one is about to be formed or it has already formed.
The RSI is slightly below 50 and the USDX itself is a bit below its 50-day moving average (blue line). In the previous months, this combination of factors meant that another sizable rally was just around the corner. As history tends to rhyme, the implications are bullish.
Since March, gold has been moving in the opposite direction to the USD Index, so the implications of the above are bearish for gold and the rest of the precious metals sector.
Why wasn’t gold moving against the USD Index in February? Because of the fear and uncertainty related to the Russian invasion of Ukraine. Please note that the war in Ukraine is still in place, and yet, gold is hundreds of dollars below its 2022 high. This serves as a strong confirmation of gold’s current weakness.
Looking at gold’s short-term picture, we see that its short-term top might already be in.
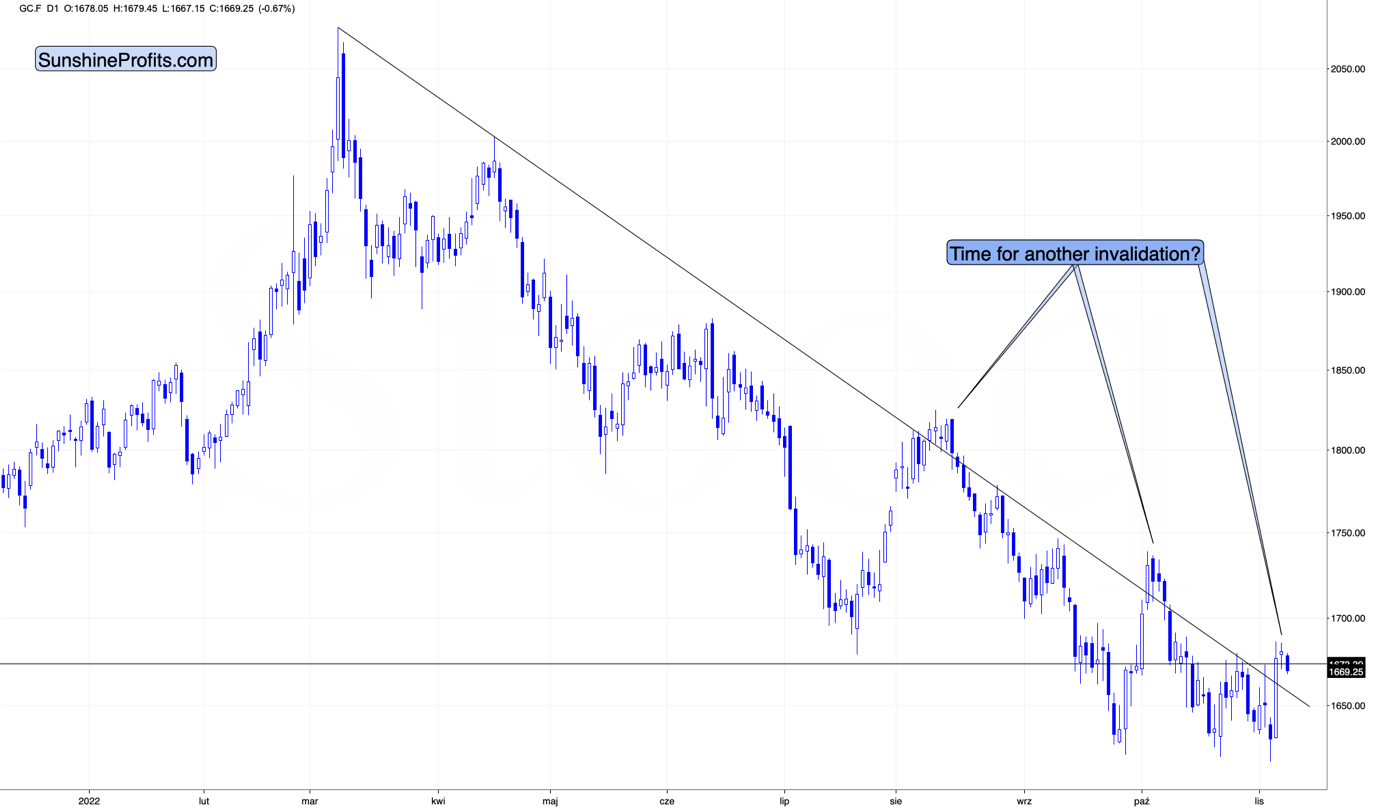
The last two times it broke slightly above its declining medium-term resistance line, it then stayed above it for a couple of days, and then it started $100+ declines.
Given today’s pre-market decline, and given the overall self-similarity to how gold performed in 2013, it seems that not only the short-term top is in, but it’s likely the case that another huge decline is about to be seen.
Moreover, let’s keep in mind the silver price signal.
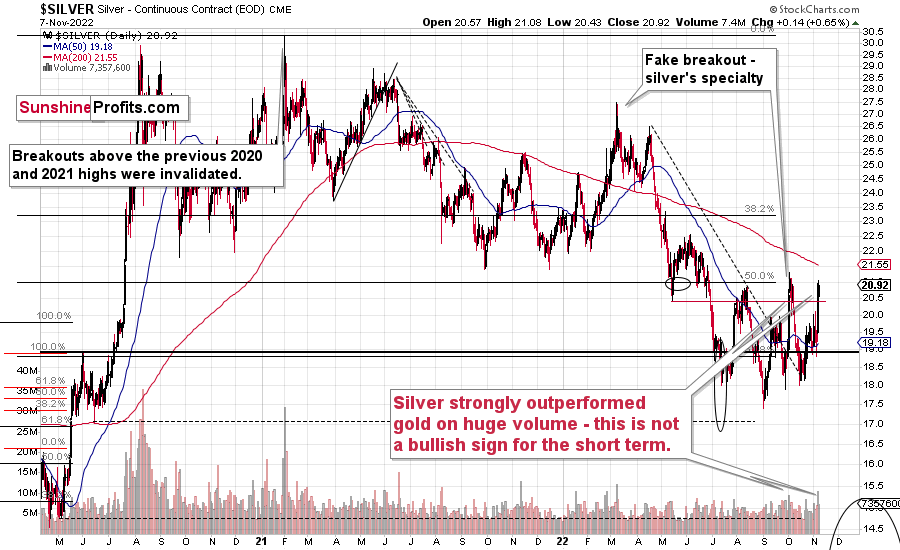
As I explained in my yesterday’s video, silver’s short-term outperformance is an important sell signal.
We saw this indication many times before, and it’s been one of the most reliable indications that the next big move lower is at hand. Remember the spike at the 2021 top, when silver soared relative to gold? Many people thought that silver was taking off and heading straight to the moon, but I warned that this was likely a fake move. And indeed, that was the top.
There were times to be long this year (for example, I went long miners on May 12 and on July 11 – very close to local bottoms). However, in my opinion, right now is not a good time to do so. Instead, it seems to me that profits from short positions are likely to grow substantially in the following weeks.
Having said that, let’s take a look at the markets from a more fundamental point of view.
Dollar Doldrums
With the USD Index consolidating over the last month and a half, the pause has helped ignite risk-on sentiment. Moreover, with a weaker U.S. dollar also supporting higher prices for gold, silver and mining stocks, the relative weakness may look puzzling in the face of a hawkish Fed.
Furthermore, because the November seasonality is bullish for the greenback, the price action may seem even more troublesome. However, the critical point is that narratives shape short-term sentiment, and investors are making fundamentally illogical bets once again.
To explain, rumors are like sparks that sometimes turn into flames; and with market participants' wishful thinking guiding their investment process, the herd mentality causes the crowd to rotate out of winners and into laggards in hopes of capturing a greater return.
Therefore, with the pivot crowd becoming more confident, rumors of a dovish Fed are bearish for the USD Index and bullish for risk assets.
Please see below:
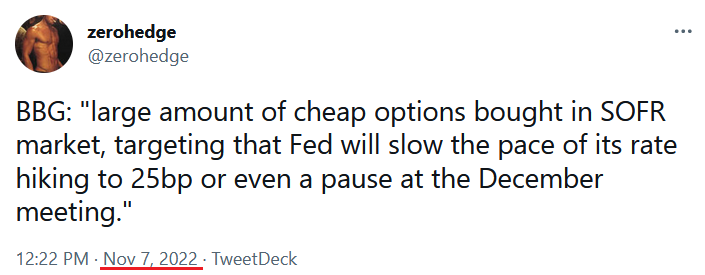
For context, BBG stands for Bloomberg, and SOFR stands for Secured Overnight Financing Rate. In addition, the latter is used to measure the cost of borrowing overnight cash that's collateralized by Treasury securities.
As a result, SOFR, Fed Funds futures and Eurodollar futures are used to speculate on the direction of the U.S. federal funds rate (FFR); and when dovish trades garner the media’s attention, investors often use them as an excuse to turn bullish on risk assets.
However, please remember that these failed bets are a dime a dozen, and have occurred throughout 2021 and 2022. Yet, the FFR continues to march higher. As such, we expect a similar outcome.
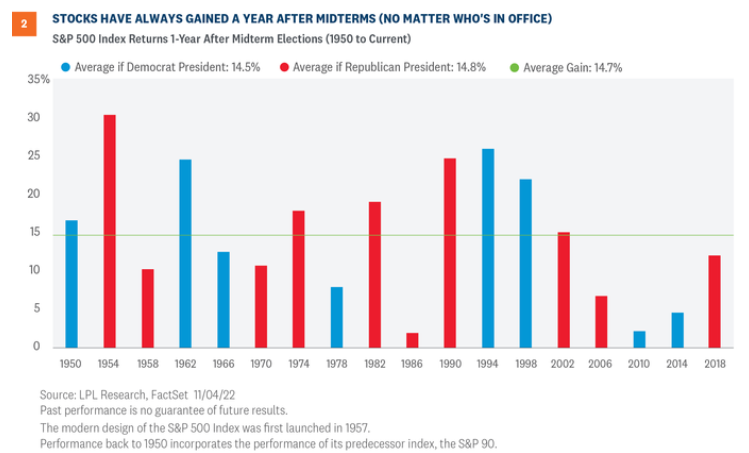
Also, the U.S. midterm elections commence today, and LPL strategists Barry Gilbert and Jeffrey Buchbinder told clients on Nov. 7 that the event is bullish for the S&P 500. They wrote:
“Markets historically have done well in the year after midterms. In fact, they have been higher 18 out of 18 times in the following year dating back to 1950, with nearly identical historical returns under Democratic and Republican presidents.”
Please see below:
Likewise, Ross Mayfield, an Investment Strategy Analyst at Baird, summed up the potential effects. He said:
“The likelihood that the Republicans take the House or the Senate is pretty high, therefore guaranteeing some form of gridlock over the next couple of years. That would probably take tax hikes off the table, and any sort of big spending potentially perceived as inflationary off the table.”
Thus, a fundamental development depressing the USD Index stems from the (false) belief that U.S. political gridlock will reduce government spending, which in turn reduces inflation and allows the Fed to pivot.
However, the narrative is shortsighted because the inflation train has already left the station. I've warned repeatedly that despite investors' hope for an unrealistic outcome, the Fed has two choices:
- Continue to raise the FFR, curb inflation and cause a recession.
- Pause rate hikes to stimulate growth and wait for inflation to cause an even worse recession.
So while the crowd believes there is some fairy tale ending in the cards, the reality is that the first option is less damaging to the U.S. economy and the preferable path for the Fed to take. Moreover, a Republican or Democrat victory on Nov. 8 is irrelevant. Either way, the Fed has an inflation problem, and every inflation fight since 1954 has ended with a recession.
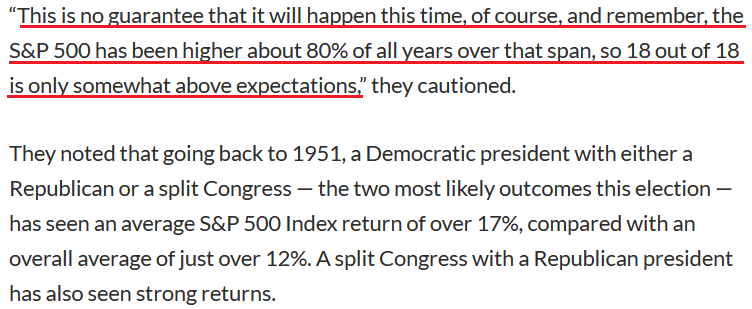
Also, while the LPL analysts noted that the S&P 500 has rallied "18 out of 18 times" after midterm elections, they added that the index rises 80% of the time anyway, so it's no smoking gun.
Please see below:
 Source: MarketWatch
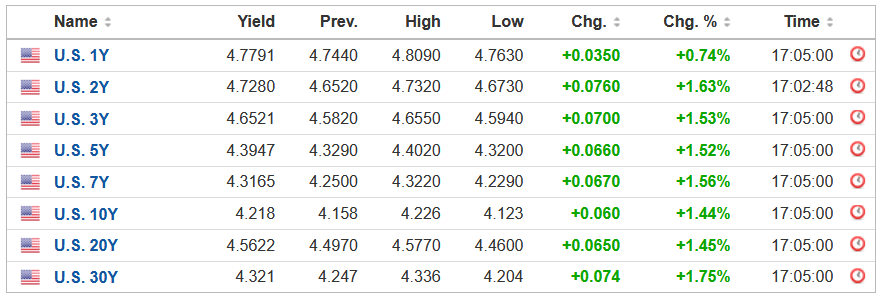
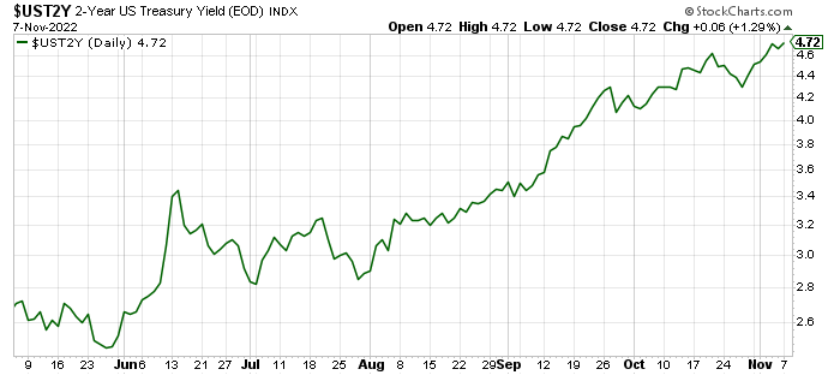
More importantly, do you know who’s not boarding the pivot train? The U.S. bond market. With interest rates rallying across the curve on Nov. 7, the U.S. 10-Year Treasury closed near its 2022 high, and the U.S. 2-Year Treasury yield closed at a new 2022 high.
Please see below:
 Source: Investing.com
In addition, with the latter often leading the FFR, the 2Y rate’s ascent highlights how bond investors are not betting on the Fed to turn dovish anytime soon.
Please see below:
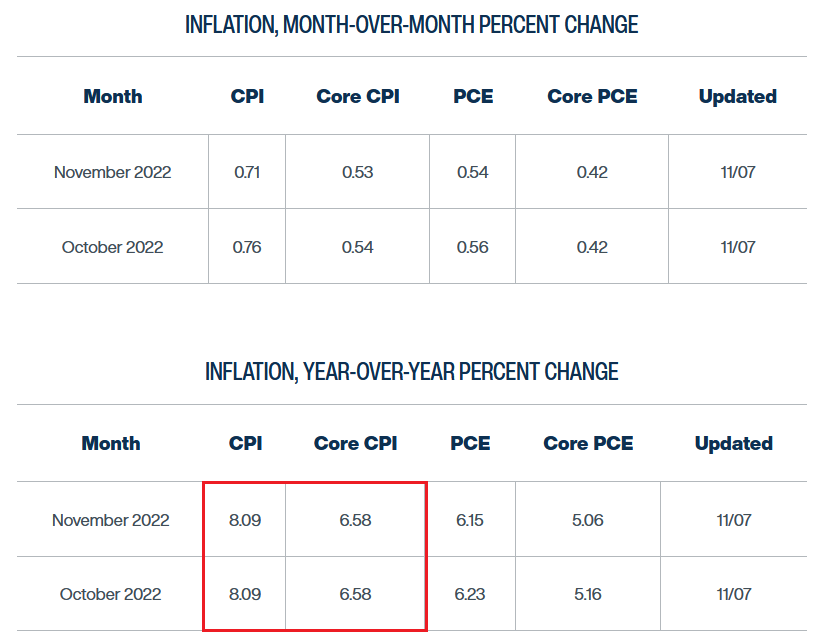
On top of that, investors don’t realize that all of this misguided optimism only makes inflation worse. With commodity prices rising materially in recent days, the flow-through will only increase input costs and further spur output inflation. Moreover, the Cleveland Fed’s inflation nowcast highlights the predicament. To explain, I wrote on Nov. 4:
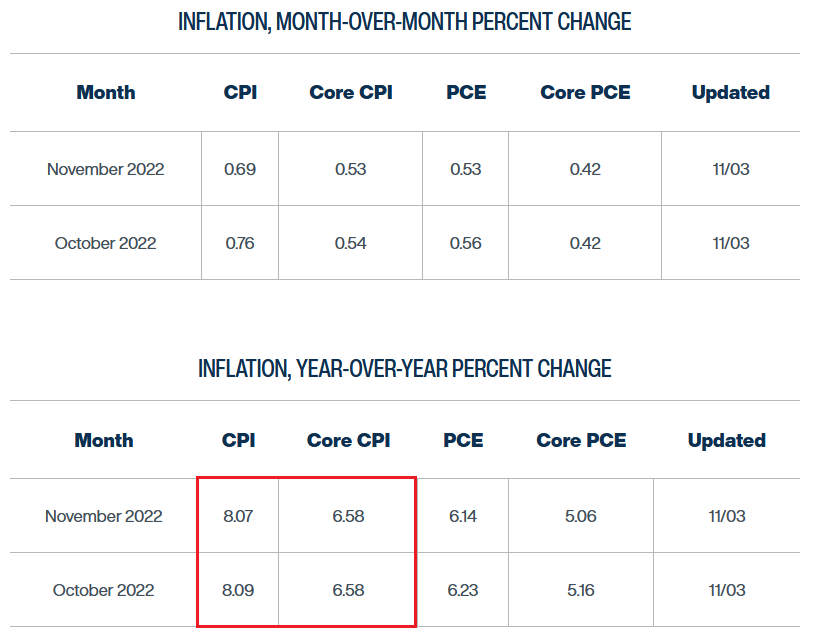 Source: Cleveland Fed
The first two rows at the top show that the Cleveland Fed expects the headline Consumer Price Index (CPI) to increase by 0.76% month-over-month (MoM) in October and 0.69% MoM in November. Moreover, the realizations would equate to year-over-year (YoY) increases of more than 8%.
However, after the recent commodities rally, the Cleveland Fed increased its November headline CPI projections to 0.71% MoM and 8.09% YoY. As a result, investors are unknowingly creating their own problem.
Please see below:
 Source: Cleveland Fed
All in all, while the abovementioned issues helped depress the USD Index, the important point is that the narratives contrast fundamental reality. In the real world, inflation is still problematic, interest rates are rising, and the Fed has realized little to no progress in its bid to lower prices.
As such, the medium-term outlook is bullish for the FFR, real yields and the USD Index, and the current optimism should reverse as all of the other countertrend risk rallies did in 2022.
Fed Speak
While investors choose to ignore the Fed at their own peril, officials continue to signal more hawkish policy in the months ahead. Likewise, while the crowd believes that the pace of hikes will make a difference between a hard or soft landing (it won’t), I’ve warned on numerous occasions that the FFR’s final destination is all that matters. For context, I wrote on Nov. 4:
Do you remember what I wrote on Oct. 31?
While the stock market heads in one direction, the bond, FX, commodity and futures markets have headed in another. Moreover, with employment still resilient and inflation highly problematic, the prospect of a pivot is more semblance than substance. Therefore, while the Fed could pull a Bank of Canada (BoC) and surprise with 50 basis points on Nov. 2 (though, unlikely), the FFR’s peak is much more important than what happens at any one meeting. Thus, the stock bulls should learn this lesson the hard way over the medium term.
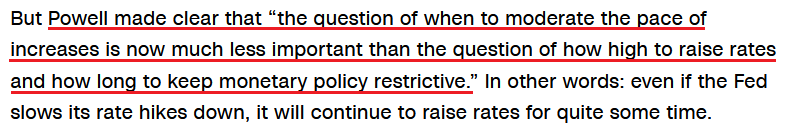
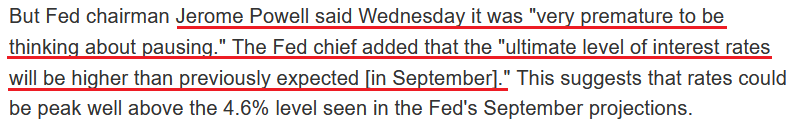
And what did [Fed Chairman Jerome] Powell say on Nov. 2?
 Source: CNN
I added:
While phrases like “cumulative tightening” and “lags” were initially viewed as a soft pivot, reality re-emerged during Powell's press conference. He said:
 Source: Investing.com
So after U.S. nonfarm payrolls outperformed expectations on Nov. 4, Minneapolis Fed President Neel Kashkari said:
Hiring is “quite healthy,” and “that tells me we have more work to do to try to cool down the economy and bring demand and supply into balance.”
“We want people to find jobs. But for me, we also need to see some evidence that the labor market is softening at least a little bit. I’m not seeing much evidence of that.”
As a result, he echoed Powell’s point that the FFR needs to rise more than previously expected.
Please see below:
 Source: Financial Post
On top of that, while Boston Fed President Susan Collins mirrored Powell and Kashkari by noting that “smaller increments” like 50 or 25 basis points could be more useful in the future, she also leaned toward a higher FFR peak on Nov. 4: She said:
 Source: Bloomberg
Thus, after Powell set the tone on Nov. 2, his deputies followed suit; and though the FX, commodity and stock markets turned a blind eye, the bond market understands the ramifications. Furthermore, the GDXJ ETF’s bear market rally in July and August was built on the same misunderstandings we’re seeing now. I wrote on Aug. 12:
Down is up, bad is good, and the narrative is if you don’t board the bull train, it may leave the station. However, while the crowd is eager to ignore the fundamental imbalances that threaten the outlooks for the S&P 500, gold, silver and mining stocks, it’s important to remember that gravity is undefeated. Therefore, while sentiment can keep asset prices uplifted in the short term, fundamental warning signs are flashing red.
As such, after those “fundamental warnings signs” helped push the junior miners’ index to new 2022 lows, nothing has changed, and the bulls should learn this lesson the hard way in the months ahead.
The Bottom Line
Risk assets remain uplifted as the midterms elicit optimism. However, the fundamentals continue to deteriorate as Fed officials realize that a higher FFR is needed to curb inflation. Moreover, while I warned throughout 2021 and 2022 that the Fed would have a hawkish epiphany, even my 2023 FFR projection of 4.5% to 5.5% may prove too low. As a result, investors significantly underestimate the challenges that lie ahead.
In conclusion, the PMs rallied on Nov. 7, as FOMO percolates throughout the financial markets; and while the USD Index declined once again, the U.S. 10-Year real yield closed flat. However, we expect the pair to hit higher highs over the medium term, and a realization is bearish for gold, silver and mining stocks.
Overview of the Upcoming Part of the Decline
- It seems to me that the corrective upswing is over and that the next big move lower is already underway.
- If we see a situation where miners slide in a meaningful and volatile way while silver doesn’t (it just declines moderately), I plan to – once again – switch from short positions in miners to short positions in silver. At this time, it’s too early to say at what price levels this could take place and if we get this kind of opportunity at all – perhaps with gold prices close to $1,500 - $1,550.
- I plan to switch from the short positions in junior mining stocks or silver (whichever I’ll have at that moment) to long positions in junior mining stocks when gold / mining stocks move to their 2020 lows (approximately). While I’m probably not going to write about it at this stage yet, this is when some investors might consider getting back in with their long-term investing capital (or perhaps 1/3 or 1/2 thereof).
- I plan to return to short positions in junior mining stocks after a rebound – and the rebound could take gold from about $1,450 to about $1,550, and it could take the GDXJ from about $20 to about $24.
- I plan to exit all remaining short positions once gold shows substantial strength relative to the USD Index while the latter is still rallying. This may be the case with gold prices close to $1,400 and GDXJ close to $15 . This moment (when gold performs very strongly against the rallying USD and miners are strong relative to gold after its substantial decline) is likely to be the best entry point for long-term investments, in my view. This can also happen with gold close to $1,400, but at the moment it’s too early to say with certainty.
- The above is based on the information available today, and it might change in the following days/weeks.
You will find my general overview of the outlook for gold on the chart below:
Please note that the above timing details are relatively broad and “for general overview only” – so that you know more or less what I think and how volatile I think the moves are likely to be – on an approximate basis. These time targets are not binding nor clear enough for me to think that they should be used for purchasing options, warrants, or similar instruments.
Summary
Summing up, it seems that the biggest part of the 2013-like decline is taking place right now, and – while I can’t make any promises regarding performance - it seems likely to me that our big profits are about to become huge and then ridiculously big in the relatively near future.
As I have written before, the recent upswing didn’t change anything. While the mining stocks appeared “strong” recently, it seems to me that it’s just a reflection of the temporary (in my view) strength in the general stock market. And as stocks decline, mining stocks – and especially junior mining stocks – are likely to truly slide.
Things might happen very fast in the coming days, and if I plan to make any adjustments, I’ll keep you informed. Still, if the targets that I’m mentioning in the “Trading” part of the summary are reached, I think that profits should be taken off the table without an additional confirmation from me. I will probably get on the long side of the market at that time, but I’ll send a confirmation if I decide to do so.
After the final sell-off (that takes gold to about $1,350-$1,500), I expect the precious metals to rally significantly. The final part of the decline might take as little as 1-5 weeks, so it's important to stay alert to any changes.
As always, we'll keep you – our subscribers – informed.
To summarize:
Trading capital (supplementary part of the portfolio; our opinion): Full speculative short positions (300% of the full position) in junior mining stocks are justified from the risk to reward point of view with the following binding exit profit-take price levels:
Mining stocks (price levels for the GDXJ ETF): binding profit-take exit price: $20.32; stop-loss: none (the volatility is too big to justify a stop-loss order in case of this particular trade)
Alternatively, if one seeks leverage, we’re providing the binding profit-take levels for the JDST (2x leveraged). The binding profit-take level for the JDST: $27.87; stop-loss for the JDST: none (the volatility is too big to justify a SL order in case of this particular trade).
For-your-information targets (our opinion; we continue to think that mining stocks are the preferred way of taking advantage of the upcoming price move, but if for whatever reason one wants / has to use silver or gold for this trade, we are providing the details anyway.):
Silver futures downside profit-take exit price: $12.32
SLV profit-take exit price: $11.32
ZSL profit-take exit price: $74.87
Gold futures downside profit-take exit price: $1,504
HGD.TO – alternative (Canadian) 2x inverse leveraged gold stocks ETF – the upside profit-take exit price: $18.47
HZD.TO – alternative (Canadian) 2x inverse leveraged silver ETF – the upside profit-take exit price: $46.87
Long-term capital (core part of the portfolio; our opinion): No positions (in other words: cash)
Insurance capital (core part of the portfolio; our opinion): Full position
Whether you’ve already subscribed or not, we encourage you to find out how to make the most of our alerts and read our replies to the most common alert-and-gold-trading-related-questions.
Please note that we describe the situation for the day that the alert is posted in the trading section. In other words, if we are writing about a speculative position, it means that it is up-to-date on the day it was posted. We are also featuring the initial target prices to decide whether keeping a position on a given day is in tune with your approach (some moves are too small for medium-term traders, and some might appear too big for day-traders).
Additionally, you might want to read why our stop-loss orders are usually relatively far from the current price.
Please note that a full position doesn't mean using all of the capital for a given trade. You will find details on our thoughts on gold portfolio structuring in the Key Insights section on our website.
As a reminder - "initial target price" means exactly that - an "initial" one. It's not a price level at which we suggest closing positions. If this becomes the case (as it did in the previous trade), we will refer to these levels as levels of exit orders (exactly as we've done previously). Stop-loss levels, however, are naturally not "initial", but something that, in our opinion, might be entered as an order.
Since it is impossible to synchronize target prices and stop-loss levels for all the ETFs and ETNs with the main markets that we provide these levels for (gold, silver and mining stocks - the GDX ETF), the stop-loss levels and target prices for other ETNs and ETF (among other: UGL, GLL, AGQ, ZSL, NUGT, DUST, JNUG, JDST) are provided as supplementary, and not as "final". This means that if a stop-loss or a target level is reached for any of the "additional instruments" (GLL for instance), but not for the "main instrument" (gold in this case), we will view positions in both gold and GLL as still open and the stop-loss for GLL would have to be moved lower. On the other hand, if gold moves to a stop-loss level but GLL doesn't, then we will view both positions (in gold and GLL) as closed. In other words, since it's not possible to be 100% certain that each related instrument moves to a given level when the underlying instrument does, we can't provide levels that would be binding. The levels that we do provide are our best estimate of the levels that will correspond to the levels in the underlying assets, but it will be the underlying assets that one will need to focus on regarding the signs pointing to closing a given position or keeping it open. We might adjust the levels in the "additional instruments" without adjusting the levels in the "main instruments", which will simply mean that we have improved our estimation of these levels, not that we changed our outlook on the markets. We are already working on a tool that would update these levels daily for the most popular ETFs, ETNs and individual mining stocks.
Our preferred ways to invest in and to trade gold along with the reasoning can be found in the how to buy gold section. Furthermore, our preferred ETFs and ETNs can be found in our Gold & Silver ETF Ranking.
As a reminder, Gold & Silver Trading Alerts are posted before or on each trading day (we usually post them before the opening bell, but we don't promise doing that each day). If there's anything urgent, we will send you an additional small alert before posting the main one.
Thank you.
Przemyslaw K. Radomski, CFA
Founder, Editor-in-chief

