

Briefly: in our opinion, full (300% of the regular position size) speculative short positions in junior mining stocks are justified from the risk/reward point of view at the moment of publishing this Alert.
The prices of gold, silver, and mining stocks moved higher on Friday, which might have seemed a big deal, but in reality, it wasn’t. Nothing happened that hasn’t already happened before, and the outlook is just as bearish as it’s been previously.
Of course, we would all prefer to see our profits increase on a daily basis, but sometimes the market really “likes” to test our patience. Fortunately, the current short position in the GDXJ is still profitable, as we entered it on July 28, 2022, when the GDXJ was trading at about $33.50, and all previous trades this year were profitable (just as this one currently is), so the waiting shouldn’t be that difficult.
In the video you’ll find below, I’ll discuss the current technical picture, and will also talk about the supposedly bullish nature of the recent increase in the official (governments / monetary authorities) sector’s purchases (it’s not bullish).
I received quite a substantial amount of questions recently, but they were practically all about last Friday’s rally and/or the official sector’s sales and/or things that I’m discussing below. Consequently, I’m not including the traditional “Letters to the Editor” section in today’s analysis, but rather I’m replying to the questions that I received within the above video and the below text.
Having said that, let’s move to the discussion of other news that recently hit the market below.
Here We Go Again
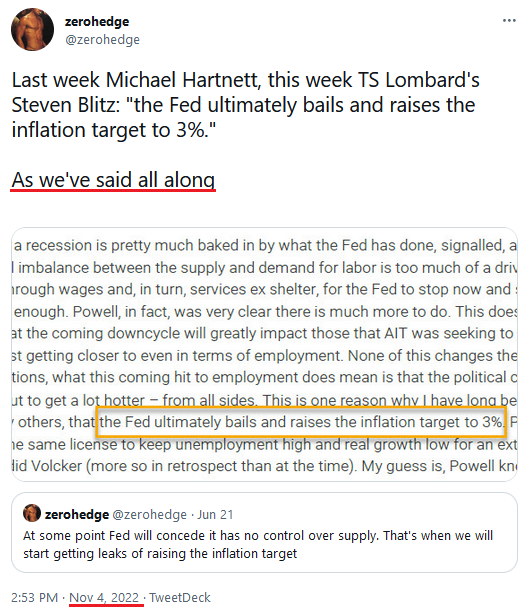
With false narratives igniting misguided hope, investors bid up gold, silver, mining stocks and the S&P 500 on Nov. 4. However, just like houses built on faulty foundations are destined to collapse, I will explain why the current narrative is doomed to fail.
To begin, optimism erupted amid rumors that China will end its zero-COVID policy; and since the region is a major commodities importer, short-covering helped propel crude oil 5% higher and copper nearly 8% higher. As a result, the PMs benefited from the positioning shift.
Second, House Financial Services Committee Chairwoman Maxine Waters – a Democrat from California – wrote a letter to Fed Chairman Jerome Powell. It read:
“I am deeply troubled by the Federal Reserve’s (Fed’s) rapid series of super-sized interest rate hikes, which may inflict unnecessary pain on millions of individuals and families while sending the economy into a devastating recession.
“This week’s Federal Open Market Committee (FOMC) decision marks the fourth consecutive mega rate hike by the Fed, resulting in the highest federal funds rate since before the 2008 global financial crisis and the fastest set of rate hikes by the Fed in four decades. Enough is enough.”
So, with China’s reopening optimism colliding with new-found hope for a dovish pivot, the shorts ran for cover and the PMs surged. Likewise, with ZeroHedge – the CEO of Pivot Inc. – insinuating that the Fed could raise its inflation target to 3%, it was essentially fundamental nirvana for gold, silver and mining stocks on Nov. 4.
Please see below:
However, while the GDXJ ETF's rise was not a cause for celebration, the divers of the move were much more semblance than substance.
For example, while the USD Index suffered mightily, the U.S. 10-Year real yield only declined by five basis points on Nov. 4. As such, the bond market did not buy the pivot optimism.
As further evidence, the futures market is pricing in a peak U.S. federal funds rate (FFR) of ~5.10% (100 minus the last price below). Moreover, it's roughly 10 basis points below the recent 2022 high, so the PMs' price action on Nov.4 was another example of investors buying hope and selling reality.
Please see below:
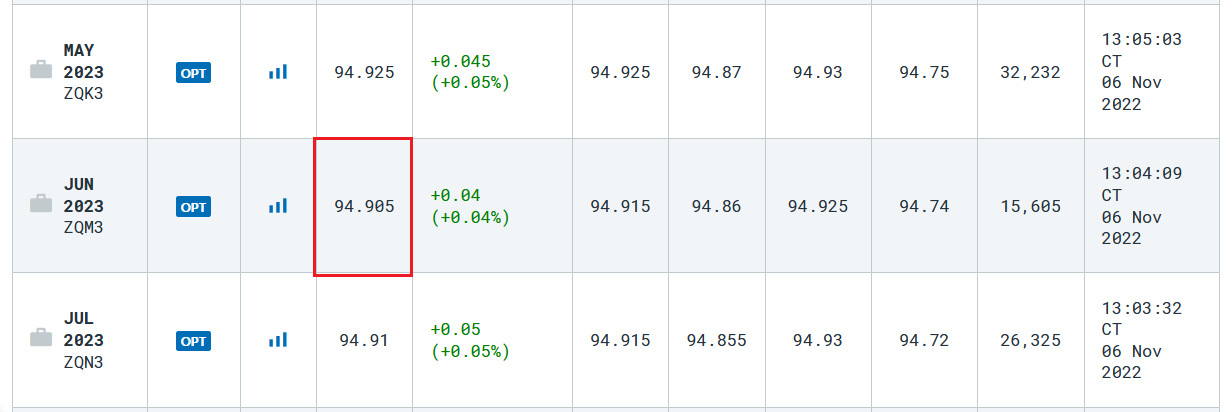 Source: CME Group
To that point, uniformed investors repeat the same mistakes. Despite numerous pivot predictions ending with hefty losses for the adopters, they continue to bet on an unrealistic outcome. Furthermore, they don’t realize that letting inflation fester is not bullish; and if Powell follows the advice of Waters (who wrote the letter for political reasons with the midterms approaching), it will result in the worst-possible outcome for the U.S. economy.
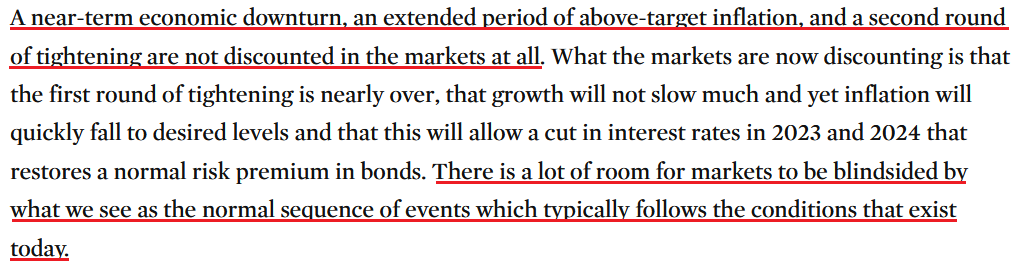
To explain, Bridgewater Associates is the largest hedge fund in the world, with more than $100 billion in assets under management (AUM). Co-CIO Bob Prince wrote on Oct. 11:
“Up to this point, the appropriate policy response to the environment has been clear, though it came too late. Strong growth and the emergence of a self-reinforcing, high level of inflation required a tightening. Going forward, the policy choices will be far more challenging when the goals of full employment and stable prices are at odds and the contraction in employment has not been sustained for long enough to bring down wage growth.
“For most central banks, at that stage there is a tendency to pause and see how things transpire. Such a pause tends to give markets a celebratory reprieve, producing a period of very good asset returns and a pickup in growth, both of which conspire to prevent wages and inflation from settling at the desired level, which necessitates the next round of tightening.”
Thus, while I warned on numerous occasions that “stop-go” monetary policy – which means the Fed pauses and then has to raise interest rates again to curb inflation – is worse than simply increasing the FFR precipitously, Prince highlights the historical lesson:
Investors assume a slowdown in rate hikes is bullish, inflation persists, and another round of tightening creates an even worse outcome.
Please see below:
 Source: Bridgewater Associates
Prince added:
“In addition to the rise in real and nominal interest rates, the Fed and other central banks are now contracting balance sheets at a time when government bond issuance remains high, withdrawing liquidity from financial markets and creating a liquidity hole….
“For the first time in a while, the private sector must buy new bonds at a massively increasing clip in order for the market to clear. This requires a level of yields at which the private sector desires to buy them, not the yields that central banks want to create and are willing to accept in order to institute their policies.”
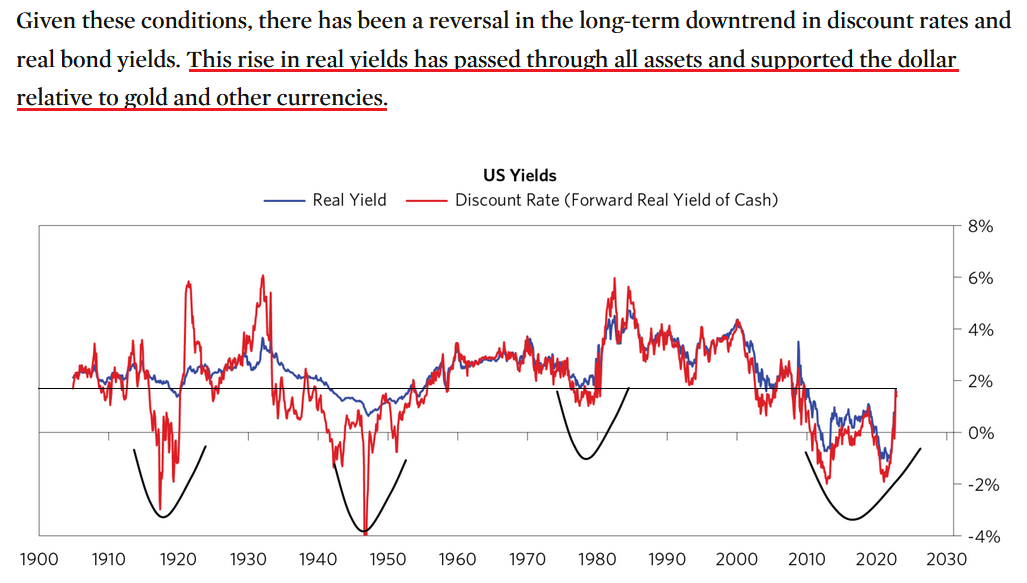
As such, higher interest rates are bullish for the USD Index, real yields and cash flow discount rates.
Please see below:
 Source: Bridgewater Associates
To explain, the red line above tracks the U.S. discount rate, while the blue line above tracks the average U.S. real yield. Even though both have risen on the right side of the chart, they are still below the highs set in 2008, 2000 and the inflationary malaises of the 1970s/1980s. Thus, both metrics should seek higher ground before this bear market ends.
Furthermore, while I’ve been bullish on the U.S. economy and Fed policy for many months, a higher FFR is only one part of the bearish thesis. I’ve noted repeatedly that every inflation fight since 1954 has ended with a recession; and while real GDP growth remains resilient right now (which is bullish for the FFR), normalizing inflation will require a greater level of demand destruction than investors realize.
Prince continued:
“Starting from economic contractions in the pandemic there was an aggressive easing, then the declines in discount rates and risk premiums and rises in asset values, then the pickup in economies, which led to inflation, then the tightening and rise in discount rates in response to that. What comes next is the rise in risk premiums and the weakening of economies…..
“Our leading estimates of inflation indicate that economies have not weakened enough for long enough to move inflation rates very far toward central bank targets or what the markets are discounting.”
Please see below:
 Source: Bridgewater Associates
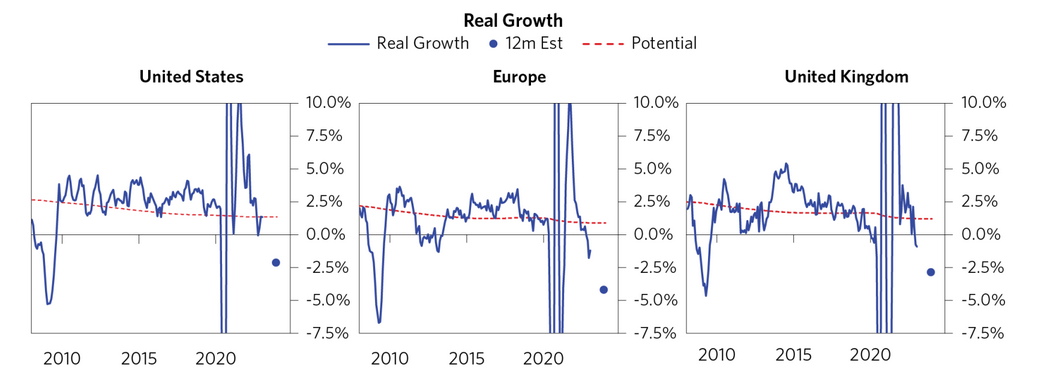
To explain, the blue lines above track the realized real GDP growth in the U.S., Europe and the U.K. In addition, the blue dots near the bottom right of the charts depict Bridgewater Associates' 12-month real GDP estimates. If you analyze the placements, you can see that the U.S. and the U.K. are projected to endure negative real GDP growth of ~2.5%, while Europe is closer to negative ~5%.
As a result, Bridgewater Associates shares our view that investors materially underestimate the resiliency of inflation and the economic pain required to normalize the metric. Moreover, while the crowd may say, "well, that's why the Fed will pivot and let inflation run hot," they don't understand that inflation will create a recession on its own.
History shows that unchecked inflation reduces consumers' spending power, derails corporate profits and eventually leads to a major decline in the U.S. labor market; and as the vicious circle continues, unemployment rises and the economy weakens further. We're just early in the inflation cycle right now.
So, while the bulls want you to believe that a pivot will solve all of the financial markets' problems, the reality is that pivot or no pivot, the recessionary seeds are already sown.
Fade the S&P 500
While the S&P 500 squeezed higher on Nov. 4 and seasonality is bullish through the end of 2022, the pivot optimism is nothing new. To explain, I wrote on Aug. 15:
With uninformed investors assuming that cutting interest rates was the appropriate response, a sharp rally occurred in July 1973, followed by a sharp pullback and then another rally to a higher high. As a result, don’t you think the crowd was calling for a new bull market from July through October 1973?
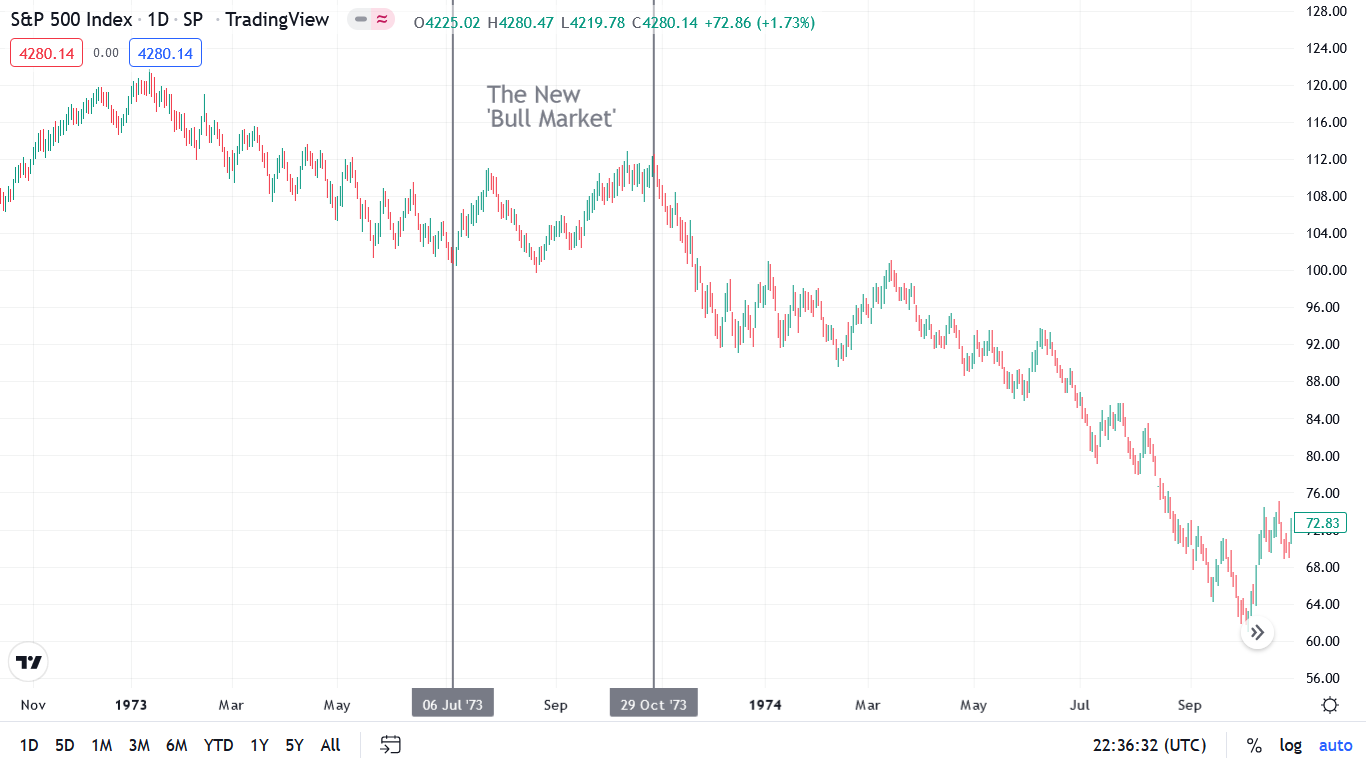
However, unanchored inflation forced the Fed to reverse course and the S&P 500 fell off a cliff. Therefore, while I’ve warned repeatedly that a dovish pivot (a “stop-go approach”) is the worst-case scenario for the U.S. economy and financial assets, investors are cheering on this outcome with glee. As such, their expectations are in la-la land, and the return of reality should elicit sharp drawdowns of the S&P 500 and the PMs.
So while the S&P 500 and the GDXJ ETF have declined since then, the crowd fails to understand that a pivot amid high inflation is bearish, not bullish.
Please see below:
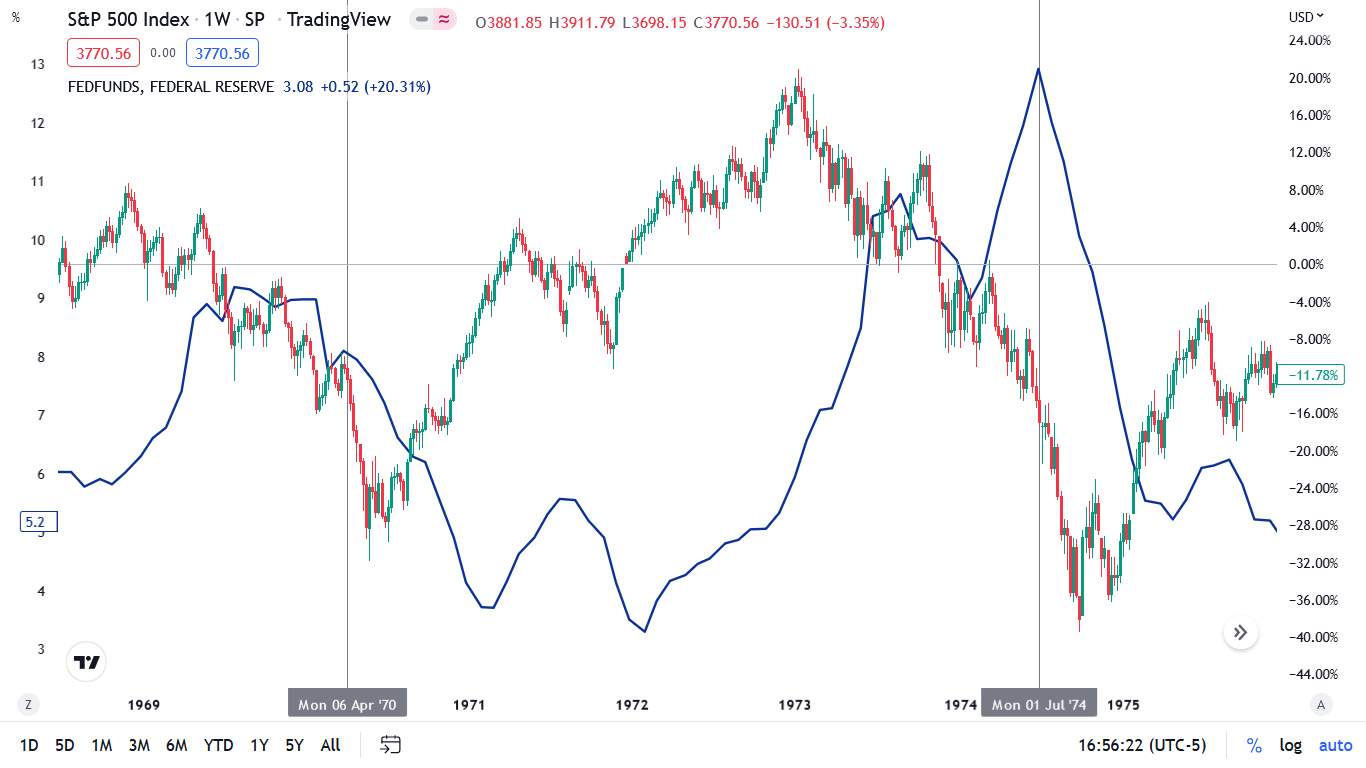
To explain, the candlesticks above track the performance of the S&P 500, while the blue line above tracks the FFR. If you analyze the vertical gray line on the left side of the chart, you can see that when the Fed cut the FFR dramatically in April 1970, the S&P 500 went from down ~14% to bottoming down ~32%.
Likewise, the vertical gray line on the right side of the chart shows how when the Fed cut the FFR dramatically in July 1974, the S&P 500 went from down ~17% to bottoming down ~39%. Therefore, when real pivots occur, it's bearish, and asset liquidations are already underway.
To that point, the pivot had similar ramifications in 1980/1981.
Please see below:
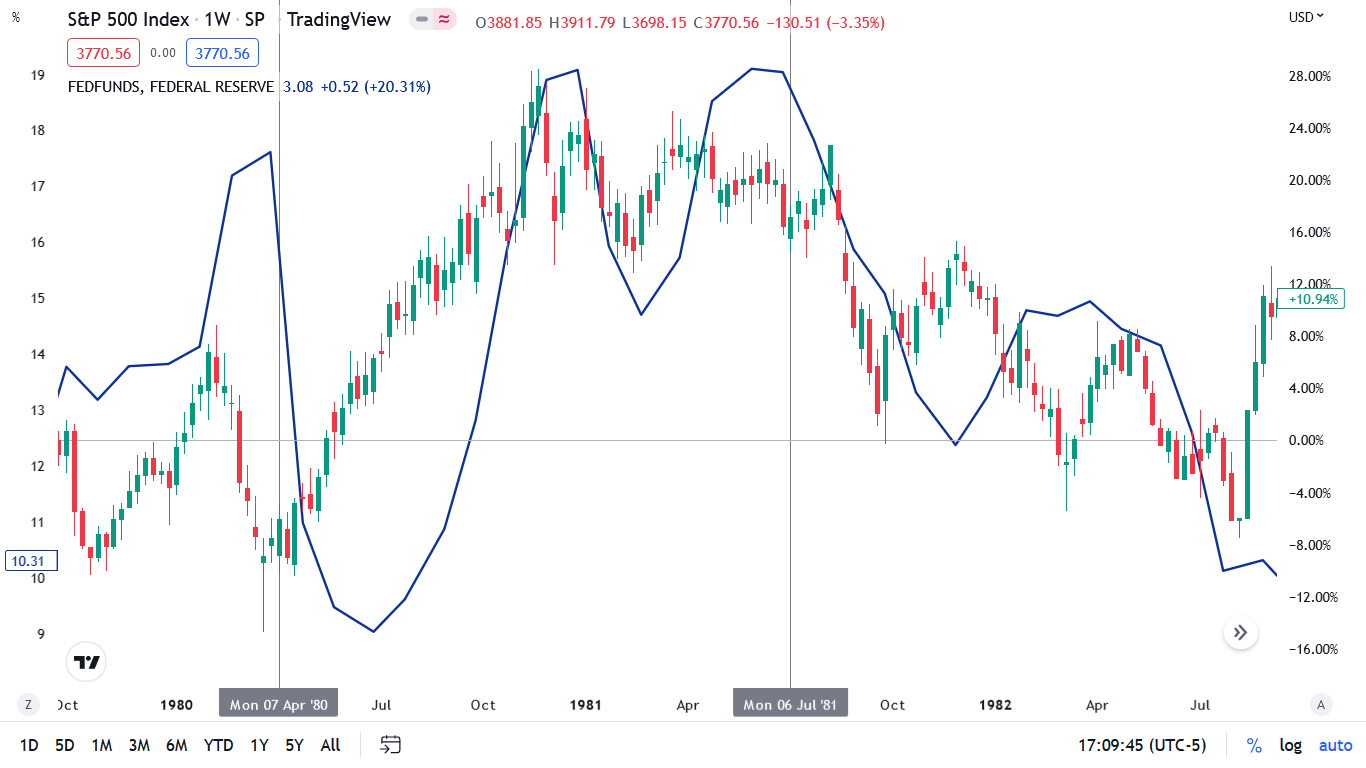
To explain, the S&P 500 (candlesticks) rallied sharply when the FFR (the blue line) was cut dramatically in April 1980. However, the recession was over relatively quickly, so investors’ reaction to lower interest rates and brighter economic days was rational.
In contrast, when the FFR declined dramatically in July 1981, the S&P 500 fell off a cliff and gave back nearly all of its 1980 gains. As a result, the price action after the FFR cut in 1981 mirrored 1970 and 1974.
Remember, the 1980 recession only lasted six months, while 1970 lasted 11 months, 1974 lasted 17 months and 1981 lasted 17 months. Furthermore, since this recession hasn’t even started, and little to no inflation progress has occurred, we’re still early in this cycle.
So while the narrative proclaims that a pivot is bullish, the data highlights the perils of turning dovish amid high inflation; and those that imply otherwise are uninformed about history and economic reality.
The Bottom Line
While the GDXJ ETF's Nov. 4 ascent was not pleasant, it's essential to focus on the big picture. The Fed is nowhere near its 2% inflation target, and normalizing the metric will be extremely hard on the U.S. economy.
Likewise, even if ZeroHedge is correct (it's not) and the Fed raises its inflation target to 3%, the central bank can't even get there without a massive economic slowdown. Thus, it's a fairy tale that's irrelevant in the real world. Therefore, investors should learn the hard way that ignoring inflation is the biggest risk to financial assets.
In conclusion, the PMs rallied on Nov. 4, as optimism reigned. However, investors fail to comprehend that the sharp rise in oil prices will only put upward pressure on inflation in the months ahead. As such, commodity rallies make a bad situation worse, and investors' misguided optimism makes the Fed's job that much more difficult.
Overview of the Upcoming Part of the Decline
- It seems to me that the corrective upswing is over and that the next big move lower is already underway.
- If we see a situation where miners slide in a meaningful and volatile way while silver doesn’t (it just declines moderately), I plan to – once again – switch from short positions in miners to short positions in silver. At this time, it’s too early to say at what price levels this could take place and if we get this kind of opportunity at all – perhaps with gold prices close to $1,500 - $1,550.
- I plan to switch from the short positions in junior mining stocks or silver (whichever I’ll have at that moment) to long positions in junior mining stocks when gold / mining stocks move to their 2020 lows (approximately). While I’m probably not going to write about it at this stage yet, this is when some investors might consider getting back in with their long-term investing capital (or perhaps 1/3 or 1/2 thereof).
- I plan to return to short positions in junior mining stocks after a rebound – and the rebound could take gold from about $1,450 to about $1,550, and it could take the GDXJ from about $20 to about $24.
- I plan to exit all remaining short positions once gold shows substantial strength relative to the USD Index while the latter is still rallying. This may be the case with gold prices close to $1,400 and GDXJ close to $15 . This moment (when gold performs very strongly against the rallying USD and miners are strong relative to gold after its substantial decline) is likely to be the best entry point for long-term investments, in my view. This can also happen with gold close to $1,400, but at the moment it’s too early to say with certainty.
- The above is based on the information available today, and it might change in the following days/weeks.
You will find my general overview of the outlook for gold on the chart below:
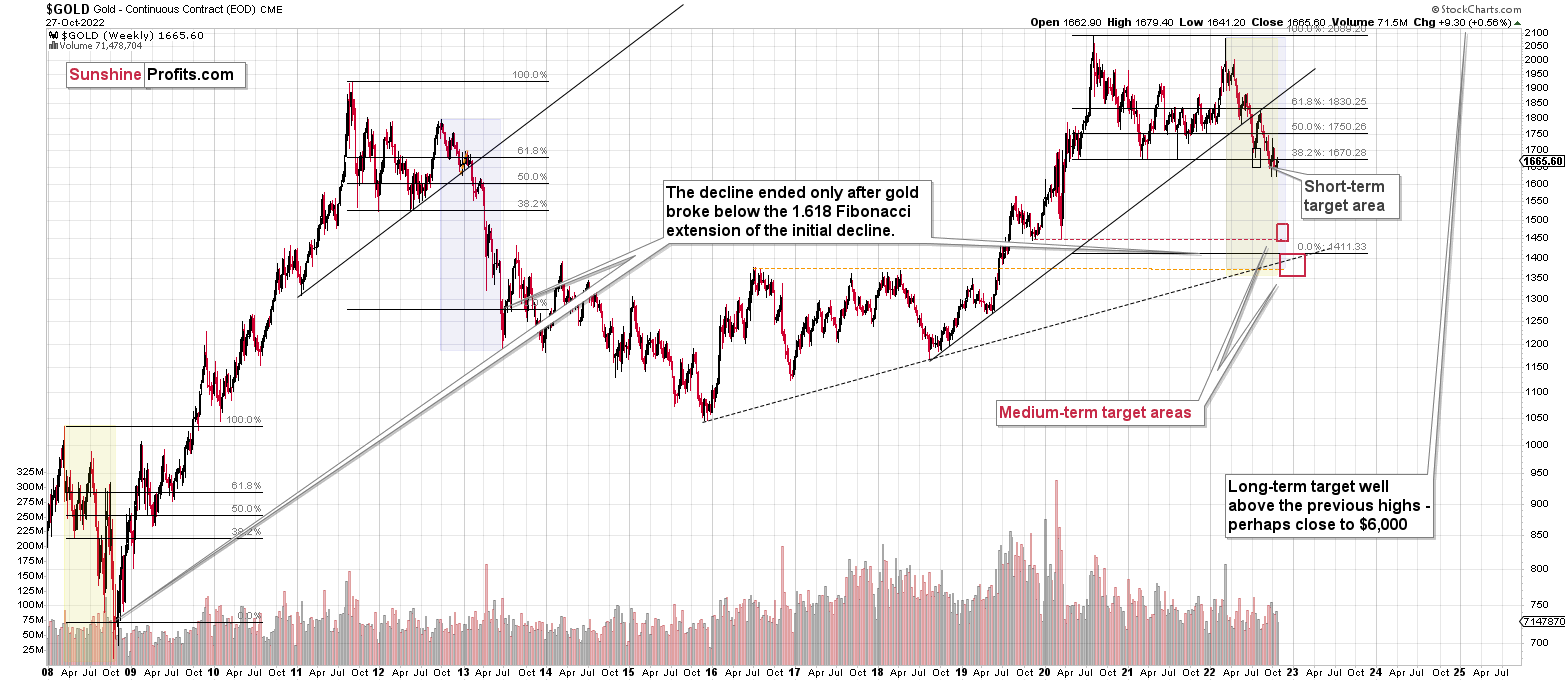
Please note that the above timing details are relatively broad and “for general overview only” – so that you know more or less what I think and how volatile I think the moves are likely to be – on an approximate basis. These time targets are not binding nor clear enough for me to think that they should be used for purchasing options, warrants, or similar instruments.
Summary
Summing up, it seems that the biggest part of the 2013-like decline is taking place right now, and – while I can’t make any promises regarding performance - it seems likely to me that our big profits are about to become huge and then ridiculously big in the relatively near future.
As I have written before, the recent upswing didn’t change anything. While the mining stocks appeared “strong” recently, it seems to me that it’s just a reflection of the temporary (in my view) strength in the general stock market. And as stocks decline, mining stocks – and especially junior mining stocks – are likely to truly slide.
Things might happen very fast in the coming days, and if I plan to make any adjustments, I’ll keep you informed. Still, if the targets that I’m mentioning in the “Trading” part of the summary are reached, I think that profits should be taken off the table without an additional confirmation from me. I will probably get on the long side of the market at that time, but I’ll send a confirmation if I decide to do so.
After the final sell-off (that takes gold to about $1,350-$1,500), I expect the precious metals to rally significantly. The final part of the decline might take as little as 1-5 weeks, so it's important to stay alert to any changes.
As always, we'll keep you – our subscribers – informed.
To summarize:
Trading capital (supplementary part of the portfolio; our opinion): Full speculative short positions (300% of the full position) in junior mining stocks are justified from the risk to reward point of view with the following binding exit profit-take price levels:
Mining stocks (price levels for the GDXJ ETF): binding profit-take exit price: $20.32; stop-loss: none (the volatility is too big to justify a stop-loss order in case of this particular trade)
Alternatively, if one seeks leverage, we’re providing the binding profit-take levels for the JDST (2x leveraged). The binding profit-take level for the JDST: $27.87; stop-loss for the JDST: none (the volatility is too big to justify a SL order in case of this particular trade).
For-your-information targets (our opinion; we continue to think that mining stocks are the preferred way of taking advantage of the upcoming price move, but if for whatever reason one wants / has to use silver or gold for this trade, we are providing the details anyway.):
Silver futures downside profit-take exit price: $12.32
SLV profit-take exit price: $11.32
ZSL profit-take exit price: $74.87
Gold futures downside profit-take exit price: $1,504
HGD.TO – alternative (Canadian) 2x inverse leveraged gold stocks ETF – the upside profit-take exit price: $18.47
HZD.TO – alternative (Canadian) 2x inverse leveraged silver ETF – the upside profit-take exit price: $46.87
Long-term capital (core part of the portfolio; our opinion): No positions (in other words: cash)
Insurance capital (core part of the portfolio; our opinion): Full position
Whether you’ve already subscribed or not, we encourage you to find out how to make the most of our alerts and read our replies to the most common alert-and-gold-trading-related-questions.
Please note that we describe the situation for the day that the alert is posted in the trading section. In other words, if we are writing about a speculative position, it means that it is up-to-date on the day it was posted. We are also featuring the initial target prices to decide whether keeping a position on a given day is in tune with your approach (some moves are too small for medium-term traders, and some might appear too big for day-traders).
Additionally, you might want to read why our stop-loss orders are usually relatively far from the current price.
Please note that a full position doesn't mean using all of the capital for a given trade. You will find details on our thoughts on gold portfolio structuring in the Key Insights section on our website.
As a reminder - "initial target price" means exactly that - an "initial" one. It's not a price level at which we suggest closing positions. If this becomes the case (as it did in the previous trade), we will refer to these levels as levels of exit orders (exactly as we've done previously). Stop-loss levels, however, are naturally not "initial", but something that, in our opinion, might be entered as an order.
Since it is impossible to synchronize target prices and stop-loss levels for all the ETFs and ETNs with the main markets that we provide these levels for (gold, silver and mining stocks - the GDX ETF), the stop-loss levels and target prices for other ETNs and ETF (among other: UGL, GLL, AGQ, ZSL, NUGT, DUST, JNUG, JDST) are provided as supplementary, and not as "final". This means that if a stop-loss or a target level is reached for any of the "additional instruments" (GLL for instance), but not for the "main instrument" (gold in this case), we will view positions in both gold and GLL as still open and the stop-loss for GLL would have to be moved lower. On the other hand, if gold moves to a stop-loss level but GLL doesn't, then we will view both positions (in gold and GLL) as closed. In other words, since it's not possible to be 100% certain that each related instrument moves to a given level when the underlying instrument does, we can't provide levels that would be binding. The levels that we do provide are our best estimate of the levels that will correspond to the levels in the underlying assets, but it will be the underlying assets that one will need to focus on regarding the signs pointing to closing a given position or keeping it open. We might adjust the levels in the "additional instruments" without adjusting the levels in the "main instruments", which will simply mean that we have improved our estimation of these levels, not that we changed our outlook on the markets. We are already working on a tool that would update these levels daily for the most popular ETFs, ETNs and individual mining stocks.
Our preferred ways to invest in and to trade gold along with the reasoning can be found in the how to buy gold section. Furthermore, our preferred ETFs and ETNs can be found in our Gold & Silver ETF Ranking.
As a reminder, Gold & Silver Trading Alerts are posted before or on each trading day (we usually post them before the opening bell, but we don't promise doing that each day). If there's anything urgent, we will send you an additional small alert before posting the main one.
Thank you.
Przemyslaw K. Radomski, CFA
Founder, Editor-in-chief

