

Briefly: in our opinion, full (250% of the regular size of the position) speculative short positions in gold, silver and mining stocks are justified from the risk/reward perspective at the moment of publishing this alert. We are moving the stop-loss orders lower, which means that we are effectively locking-in more profits, while simultaneously letting them grow further.
Just a few months ago silver was trading above $17 and many investors and analysts were convinced that the white metal was about to rally once again after several months of consolidation. We warned you that it wasn’t likely. We painted a very bearish picture for the silver prices and we were laughed at for saying that the white metal could even decline below $10.
Silver is almost halfway there and those who thought that the December 2015 price lows were the final bottom are likely to be very surprised. Perhaps as early as this week. Let’s see why and how big the surprise is likely to be (charts courtesy of http://stockcharts.com).
Days Before THE Breakdown
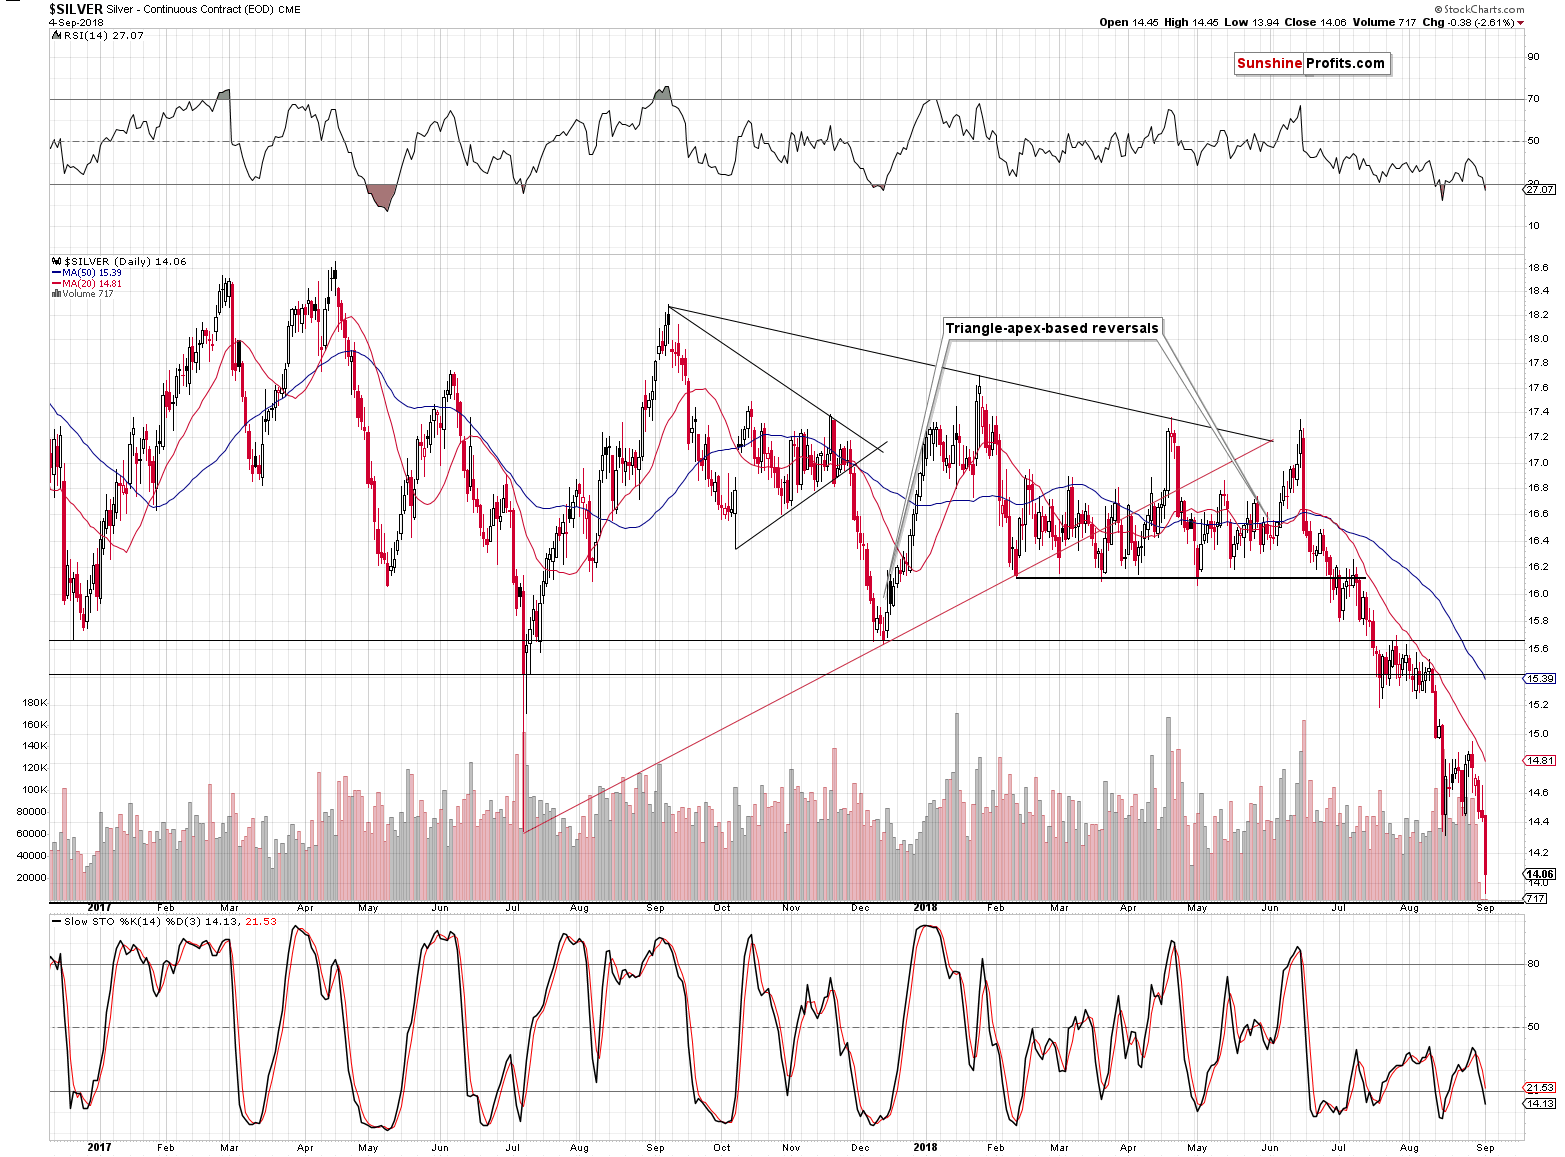
Before moving to THE breakdown, let’s take a look at the breakdown. Silver just moved below the mid-August and the July 2017 lows. The breakdown was big and clearly visible in terms of both intraday lows and closing prices. Silver even briefly moved below $14.
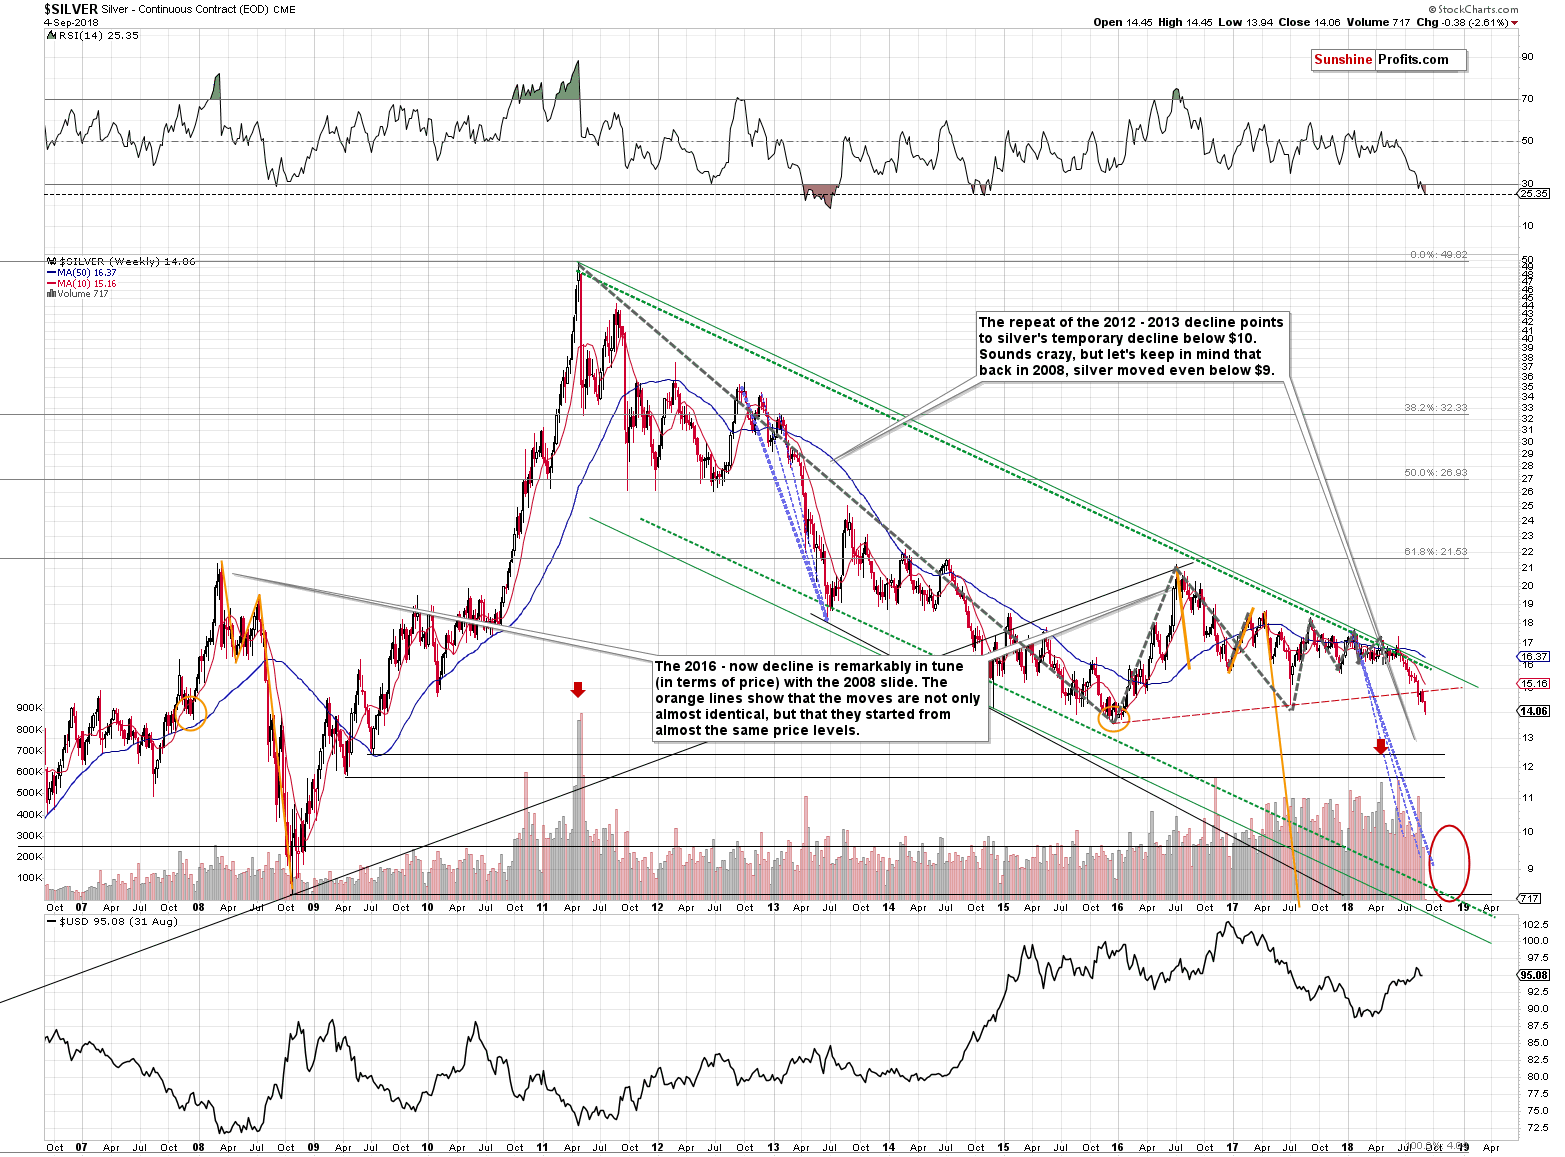
From the long-term point of view, it’s clear that something even bigger is taking place. Silver is declining after the earlier breakdown below the rising red support line and its verification. This is most likely just the start of the move, since no major support was reached (except for the round $14 level) and mining stocks seem to be in a freefall as well – just as they were in 2013.
How low can silver move? Since gold is likely to move to its December 2015 bottom relatively soon and silver is likely to underperform, silver is likely to move below its December 2015 bottom. In other to check how low silver could slide, let’s use the same technique that we used yesterday while determining the next major price target for gold.
Namely, we’re going to base the prediction on the way the flag patterns usually work. The moves that follow the flag patterns tend to be similar in size to the moves that precede them. Silver declined by about 17.52% (June top – mid-August bottom) before the pattern, so if it declines in a similar way (counting from the late August top), we’re likely to see silver at $14.95 * (1 – 17.52%) = $12.33 relatively soon. In other words, based on the recent flag pattern, silver is likely to slide well below the December 2015 bottom, likely to the mid-2009 bottom ($12.44). And you – our subscribers – have been prepared for this eventuality for more than a month.
Having said that, let’s take a look at gold.
Gold’s Flag Is Over
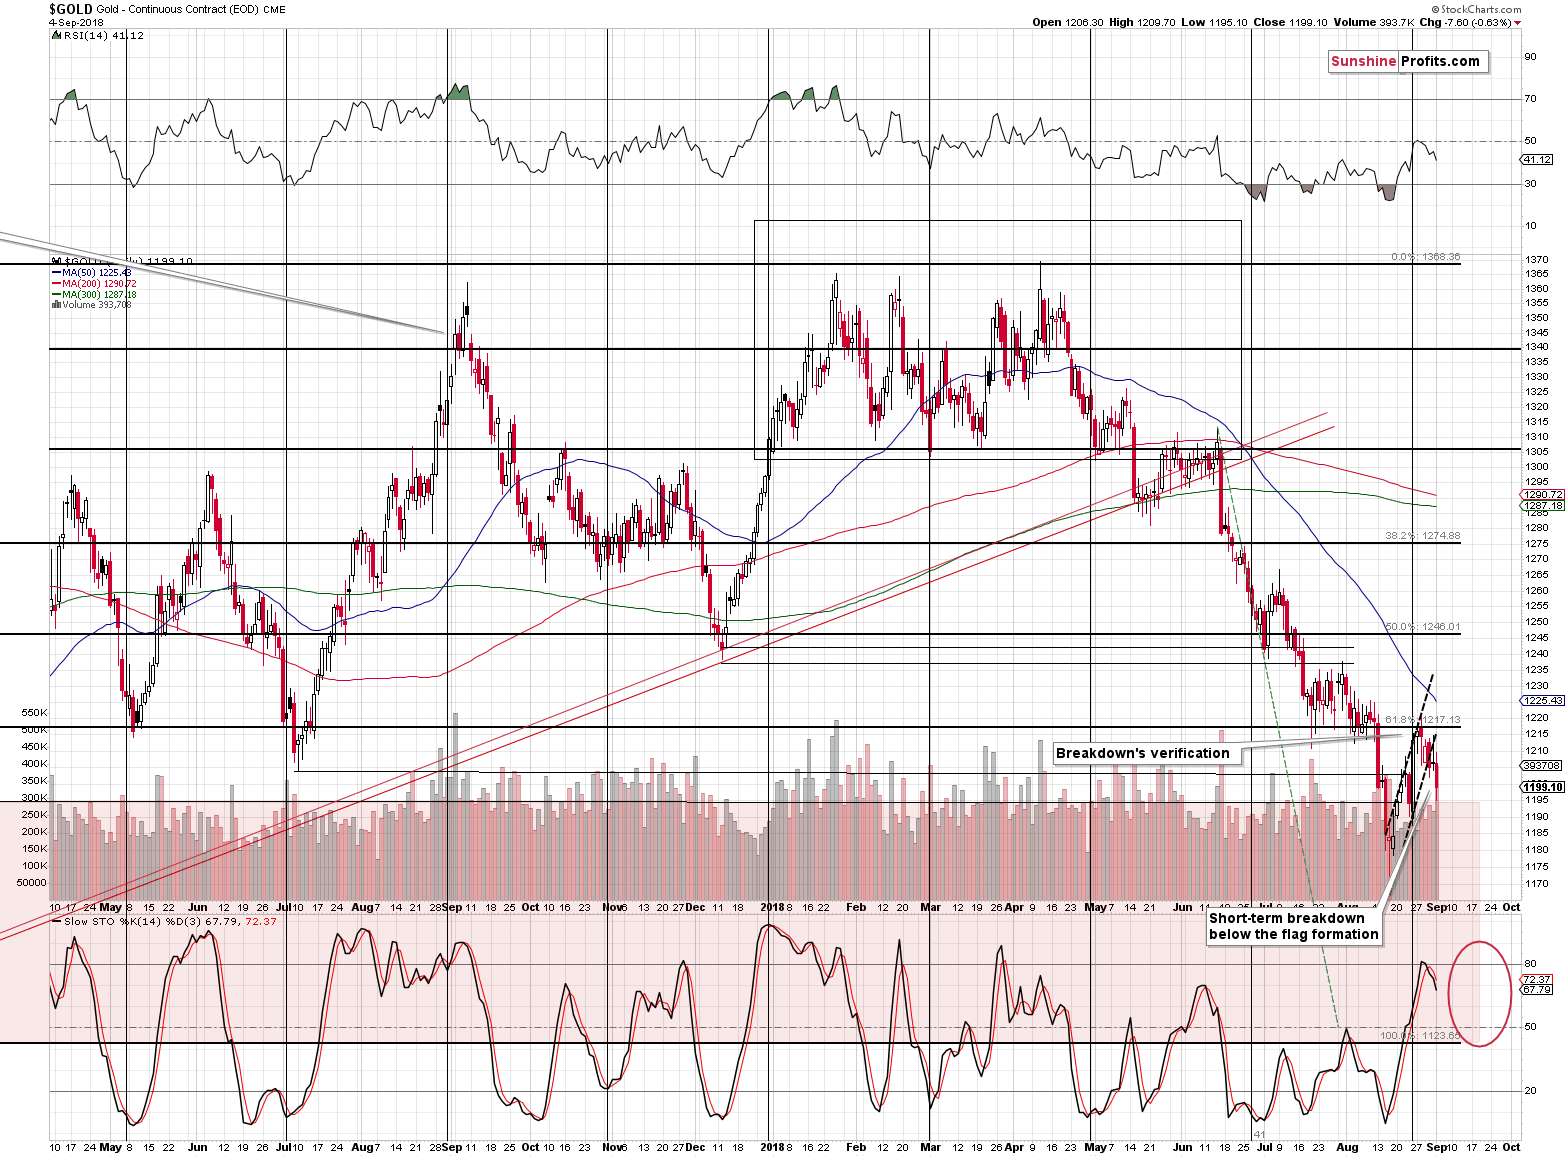
When we wrote about the price of the yellow precious metals yesterday, it was trading at $1,195, and it’s trading at $1,194 right now. Consequently, it seems that not much changed.
But that’s not the truth. The truth is that gold closed below the flag pattern and it continues to trade below it also today. Yesterday, it might have been the case that the breakdown was accidental, but it’s very unlikely based on what we’re seeing right now. Consequently, the outlook is now more bearish than it was about 24 hours ago.
There’s also something that we would like to add that’s visible from the long-term point of view.
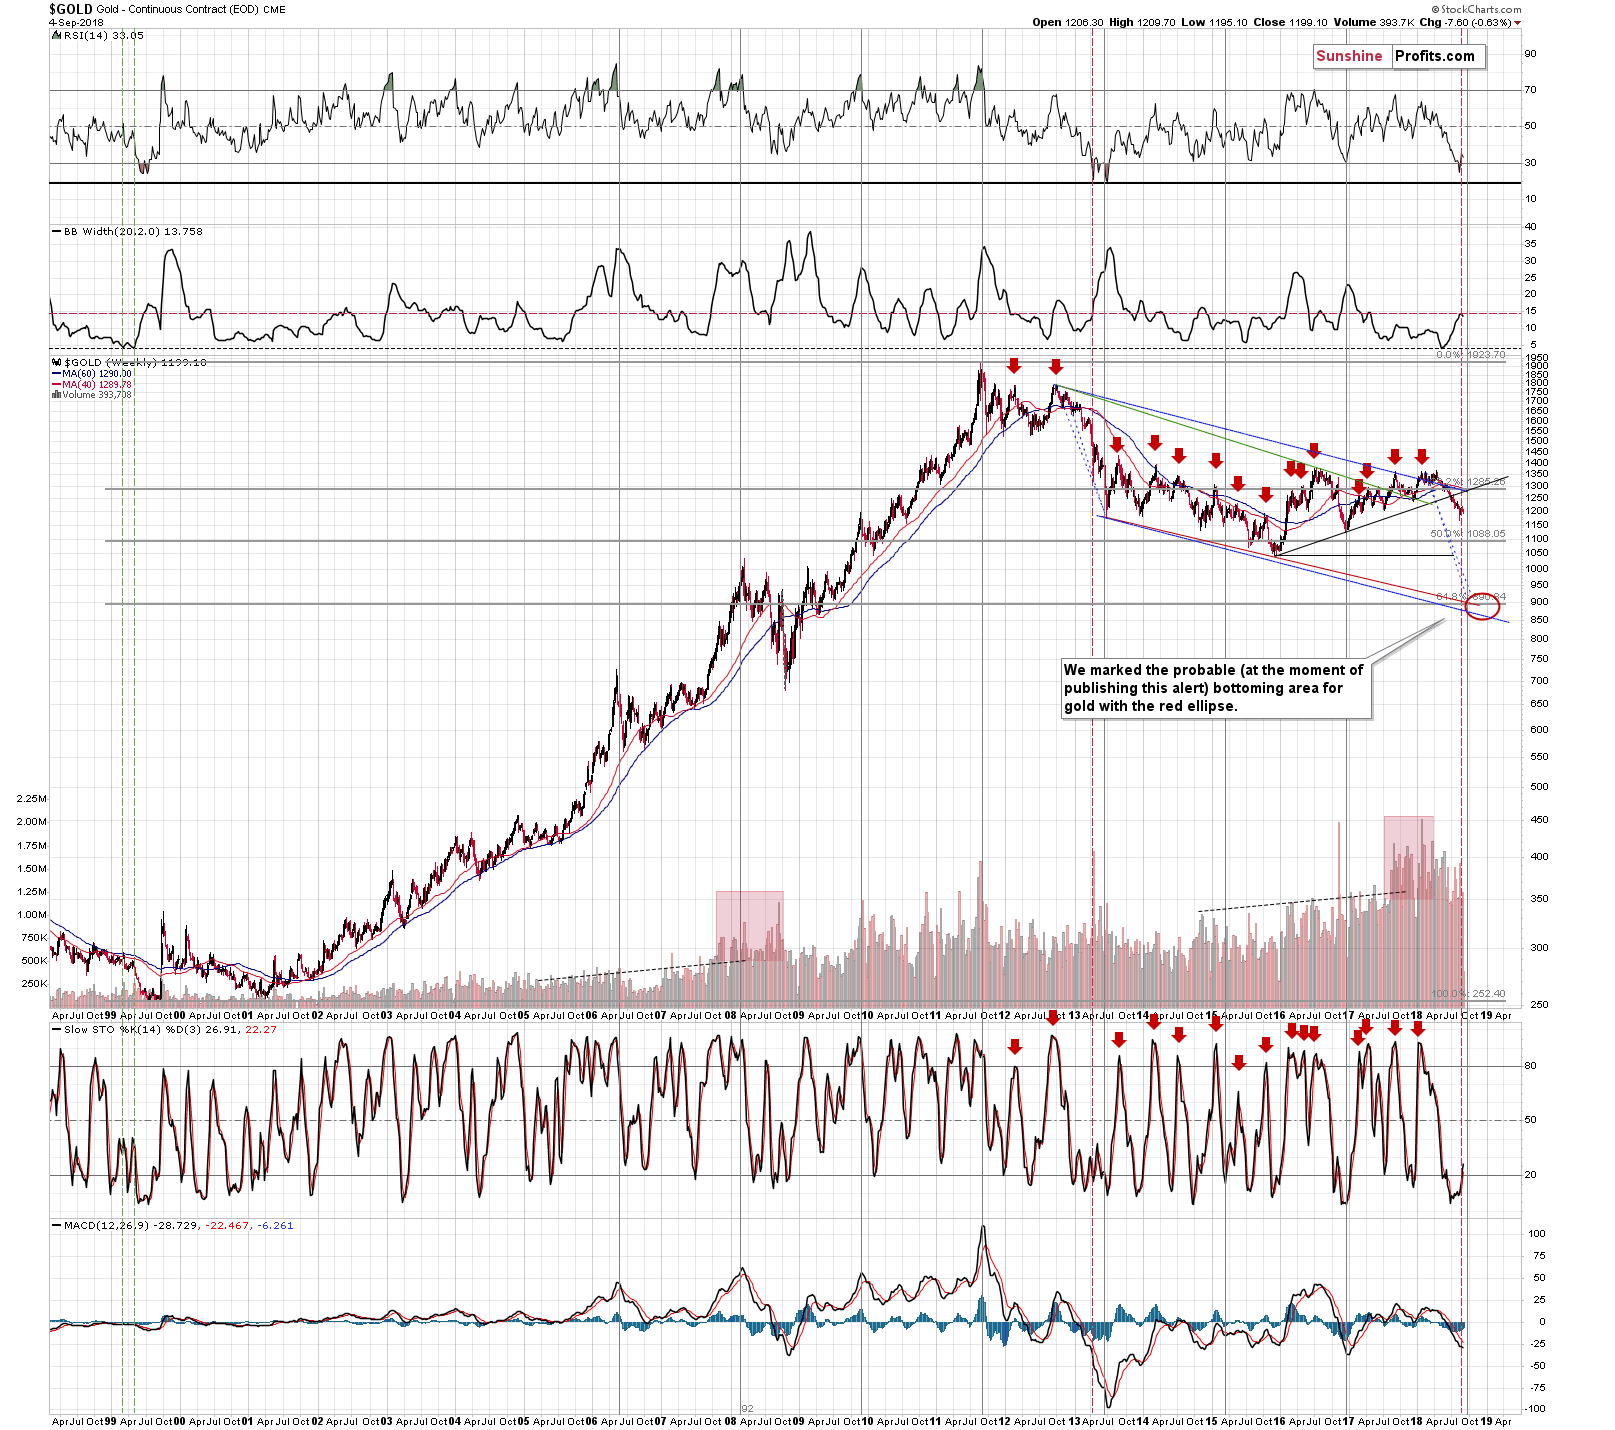
The rise in volatility. We are using the Bollinger Band's width as a proxy for volatility and it’s visible on the above chart as the indicator that’s second from the top. We marked the current volatility level with a horizontal, red, dashed line. We already explained it numerous times why the current decline is similar to the 2013 one, so instead of going through these reasons again, let’s focus on the implications.
The moment of 2013 when the volatility increased to the current level was right before the most volatile part of the decline. We marked both situations with vertical, red, dashed lines. The recent decline has been quite steady, just as what we had seen in late 2012 and early 2013. If history is to repeat itself – and it’s likely to – then we are right before a big plunge in the price of gold and in the rest of the precious metals sector.
Moreover, before moving to mining stocks, please note that we enlarged the bottoming area so that it also covers the months after October. Gold is sill likely to bottom in early October, but if it takes a few extra weeks, it will not invalidate our analysis.
Gold Stocks Downside Target
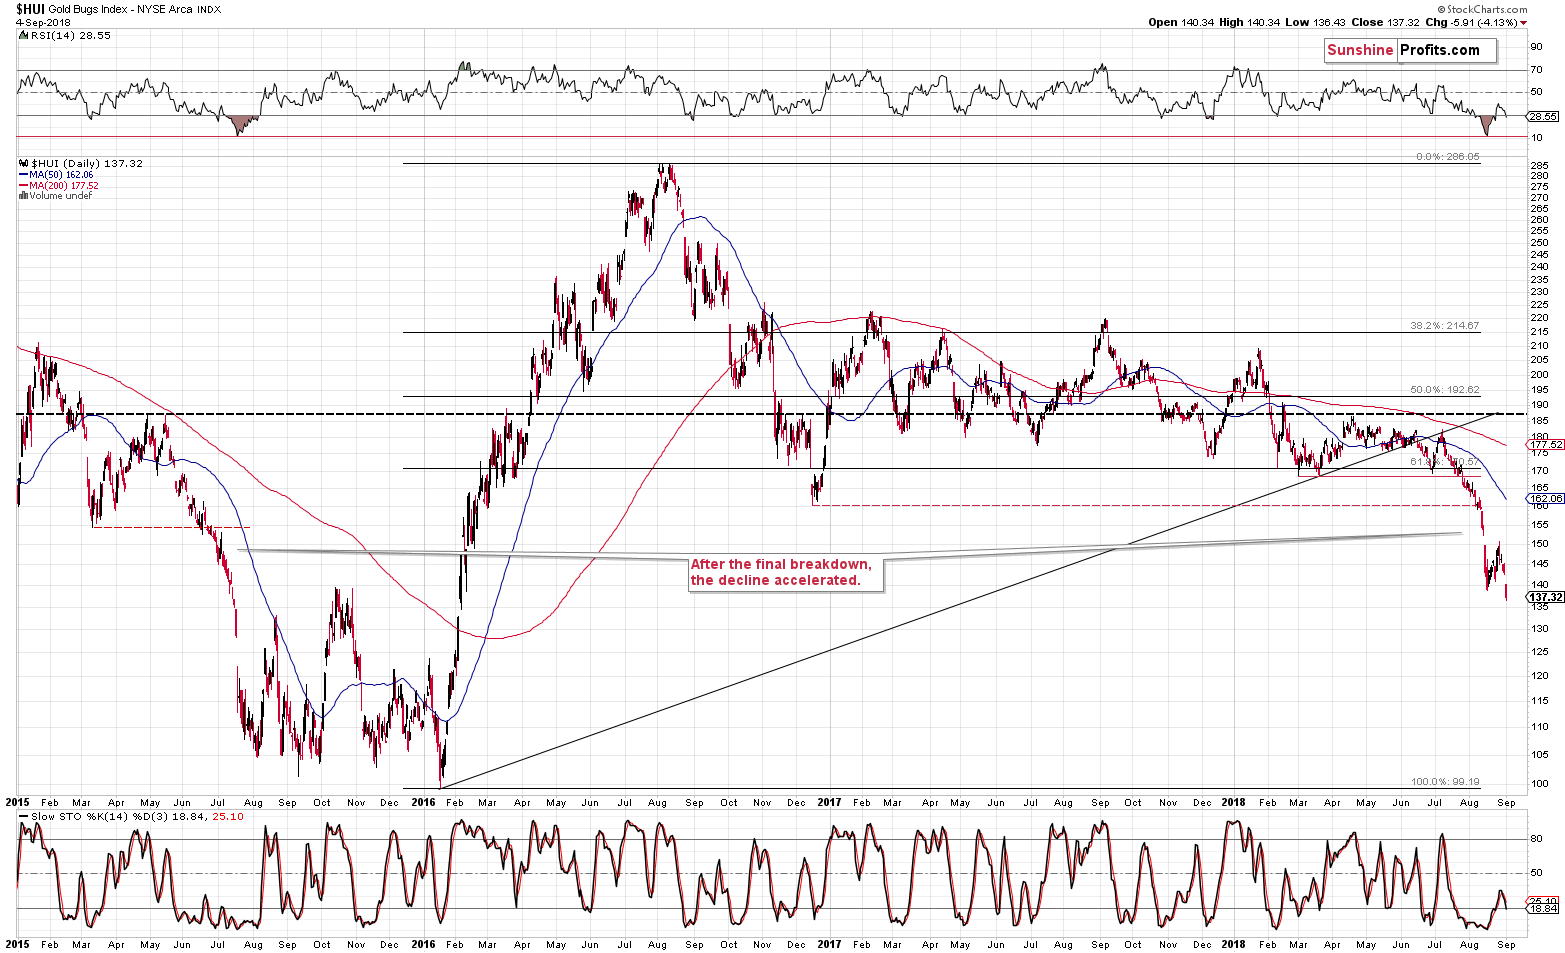
Gold stocks have broken to new 2018 lows and there is no strong support all the way down to the 2016 lows. Moreover, the move between 100 and higher prices in 2016 was very quick, which makes it likely that the decline will be very fast as well.
The downside target based on the repeat of the move that preceded the flag pattern provides us with a target that’s much lower than the current price, but not yet below the 2015 and 2016 lows. Here are the details:
The HUI declined by about 23.88% (July top – mid-August bottom) before the pattern, so if it declines in a similar way (counting from the late August top), we’re likely to see the HUI at 150.77 * (1 – 23.88%) = 114.77 relatively soon. In other words, based on the recent flag pattern, the HUI Index is likely to slide almost to the 2015 / 2016 bottoms. However, the proximity of the 100 level and the fact that it served as the final target makes us think that this is the real near-term target.
We don’t think that this is the final target for this decline, though.
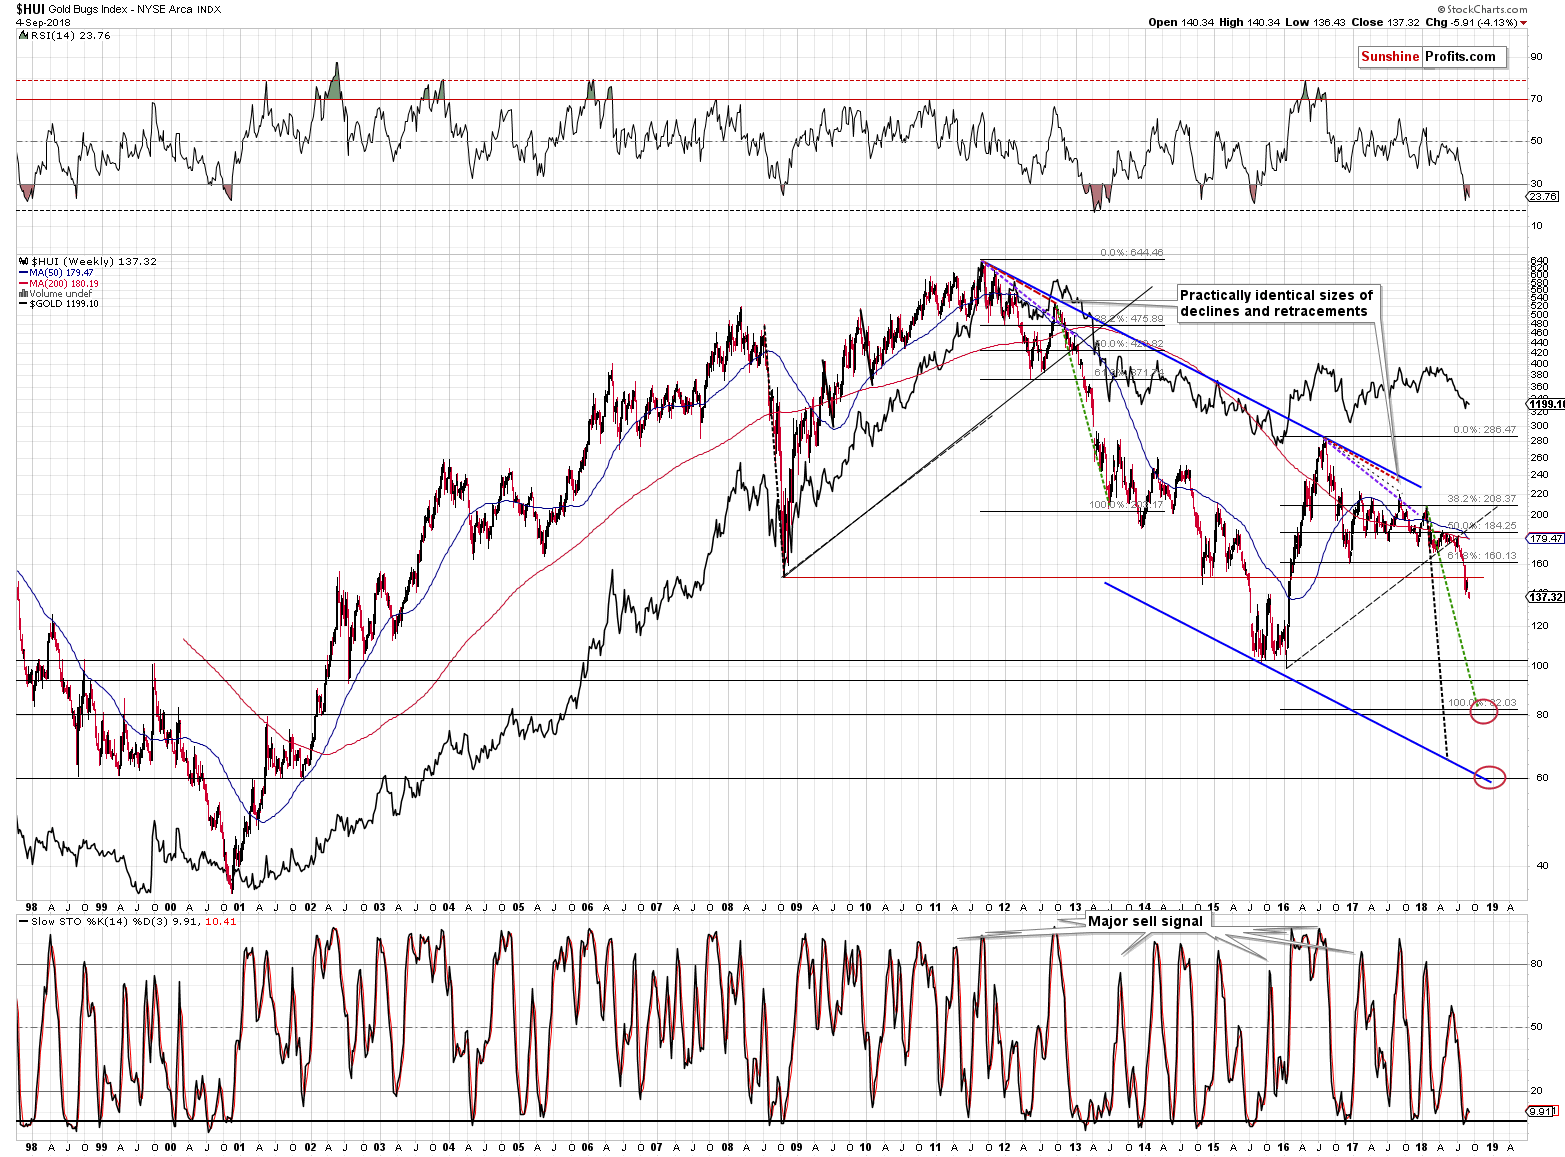
If gold is likely to move below its 2015 bottom and gold stocks are underperforming gold to a big extent, then they are likely to decline below their 2015 / 2016 bottoms as well.
On the above very-long-term chart we see that there are two index values that could stop the decline once the HUI breaks below 100. The upper target is 80 and the lower target is 60. Yes, we know, they are ridiculous. But just because a target is ridiculous, it doesn’t mean it’s wrong. Who would have thought that the HUI would drop to 150 in 2008 when it was trading above 500 just a few months earlier? The HUI’s value declined to less than 1/3 of the initial value. The most recent local top was a bit above 200. 200/3 is a bit less than 67, so a move to 60 here would be in tune with something that already took place almost exactly 10 years ago.
The 80 level is based on the analogy to the 2013 decline (note the green, dashed lines), the 2001 top and the early 2002 bottom (it served as resistance in 2000 as well). It’s also confirmed by the Fibonacci extension (the size of the previous decline multiplied by 1.618) that it is analogous to what happened in 2013. We marked the above with a classic Fibonacci retracement tool, but this time it is the “61.8% retracement” that is the input (the mid-2012 and late-2016 bottoms). The target in 2013 was just a bit above 200 and it’s now a bit above 80.
The 60 level is based on two 2001 bottoms, the 1998, and 1999 bottoms. Moreover, this level is indicated by the line that’s parallel to the line based on the 2011 and 2016 tops (most important tops of the past years) and it’s also more in tune with the analogy to the 2008 decline.
Which of these levels is more likely? The jury is still out, but we should be able to tell more once gold moves lower. For instance, if gold is at about $950 and the HUI is showing strength at about 90 or so, it will be clear that we should expect the final bottom to take place close to 80, not a big slide to 60.
USDX Update
As far as the situation in the USD Index is concerned, our yesterday’s comments remain up-to-date:
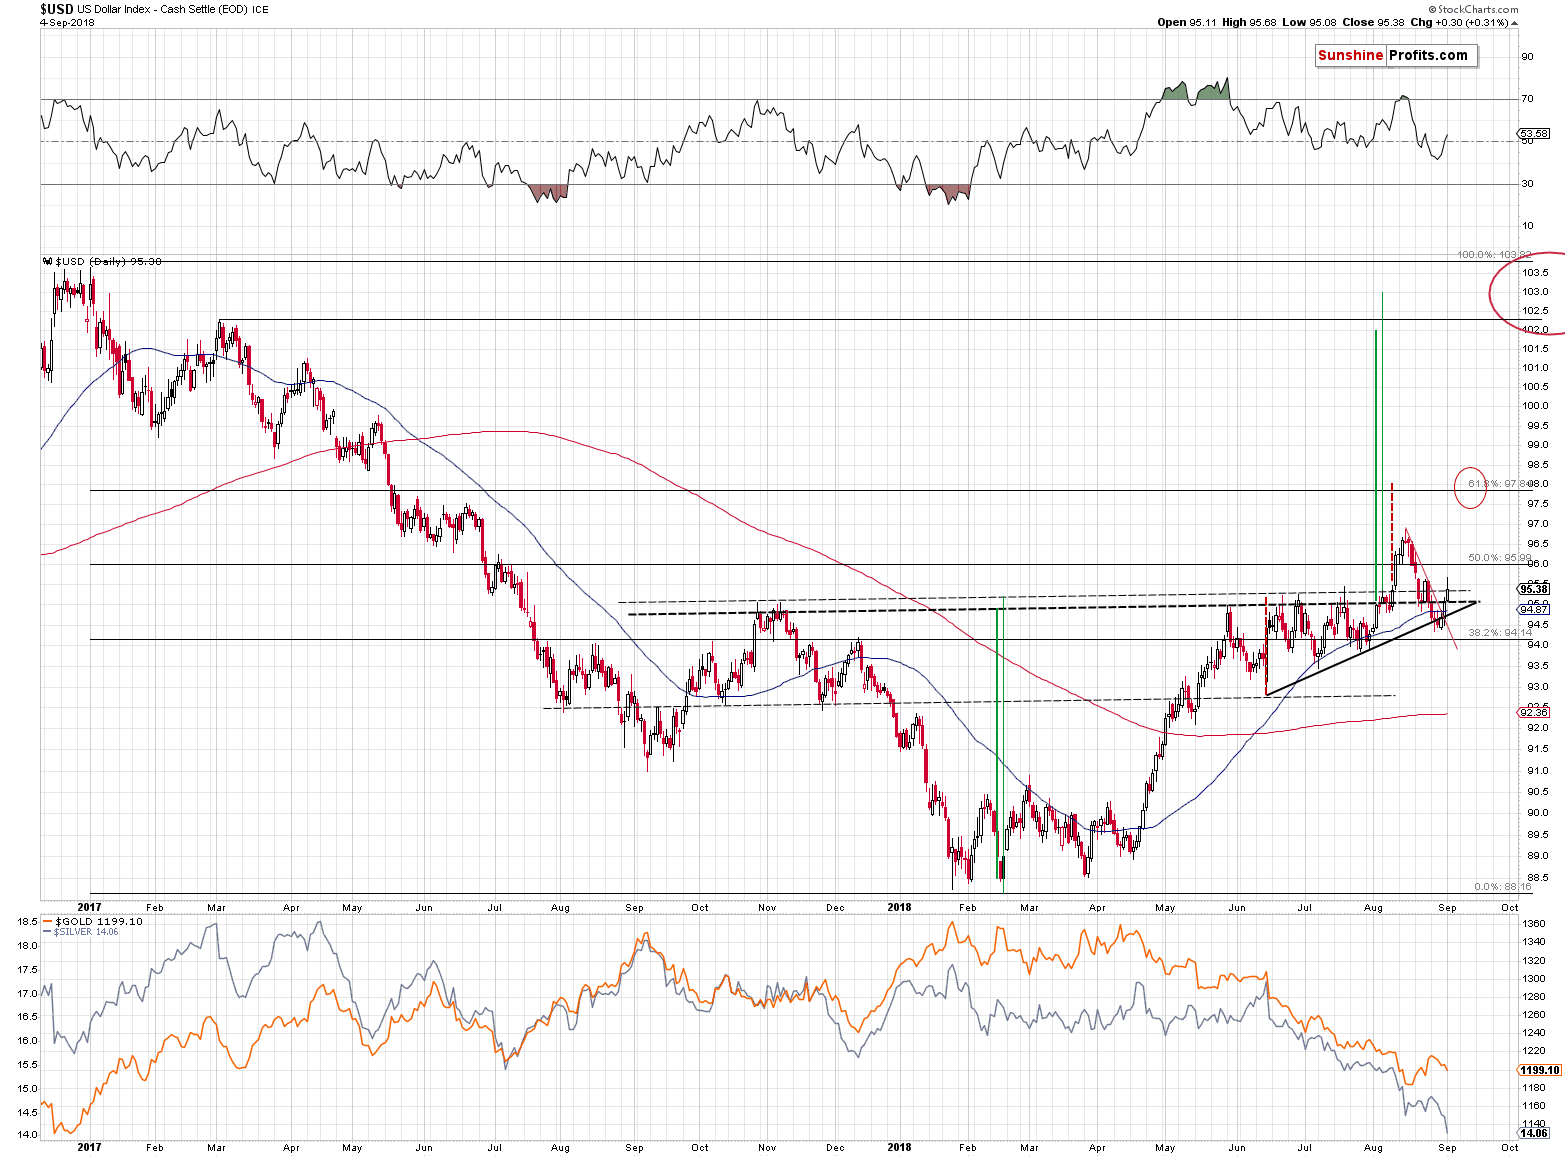
The objective fact is that the USD Index closed the week above 95, so from the weekly point of view there was no decline. Despite the early decline, overall, the USDX moved higher by 0.02 last week. And it never really invalidated the breakout above the neck level of the reverse head-and-shoulders pattern.
Moreover, from the very short-term point of view, we just saw a breakout above the declining red resistance line and the USD rally continues in today’s pre-market trading (95.55 at the moment of writing these words). The outlook for the USD Index remains very bullish, not only from the long-term point of view, but also due to medium- and short-term signals.
Before moving further, we would like to briefly discuss one thing that is often misunderstood when discussing the outlook for the USD Index. It is often said that the USD Index can’t rally, because of all the problems in the U.S. economy, the ballooning debt, etc. The problems are real, but they – alone – are not enough for the USD to either rally or decline.
“What?! You’re saying that the key fundamental information is irrelevant?!”
No. That’s not what we are saying. We are saying that the USD Index is… an index. Precisely, it’s an average of the currency exchange rates. The EUR/USD exchange rate has the biggest (over 50%) weight in the index and the USD/JPY exchange rate has the second biggest weight. This means that for the USD Index to rally, the dollar doesn’t have to be perfect. It just has to be a better option than the euro and the yen.
There is a saying that the currencies do not float, but sink at different rates (called inflation). If the non-USD currencies sink faster, the exchange rate mechanisms will cause the USD Index to rally.
The analysts that take a big magnifying glass when discussing what’s wrong with the U.S. economy, but that at the same time entirely ignore the situation in Europe and Japan are completely missing the point. The situation in the U.S. can be very bad, the debt could be astronomical, but if the situation is even worse in the other major economies (especially in the EU and in Japan), the USD Index is still likely to rally.
So, the next time someone tells you how bad the outlook for the USD Index is, don’t ask them why they think the situation in the US economy is bad. Ask them why they think things are so much better for the EU and Japan. Getting “huh?” as a reply is a good indication that you might want to consider different sources of information.
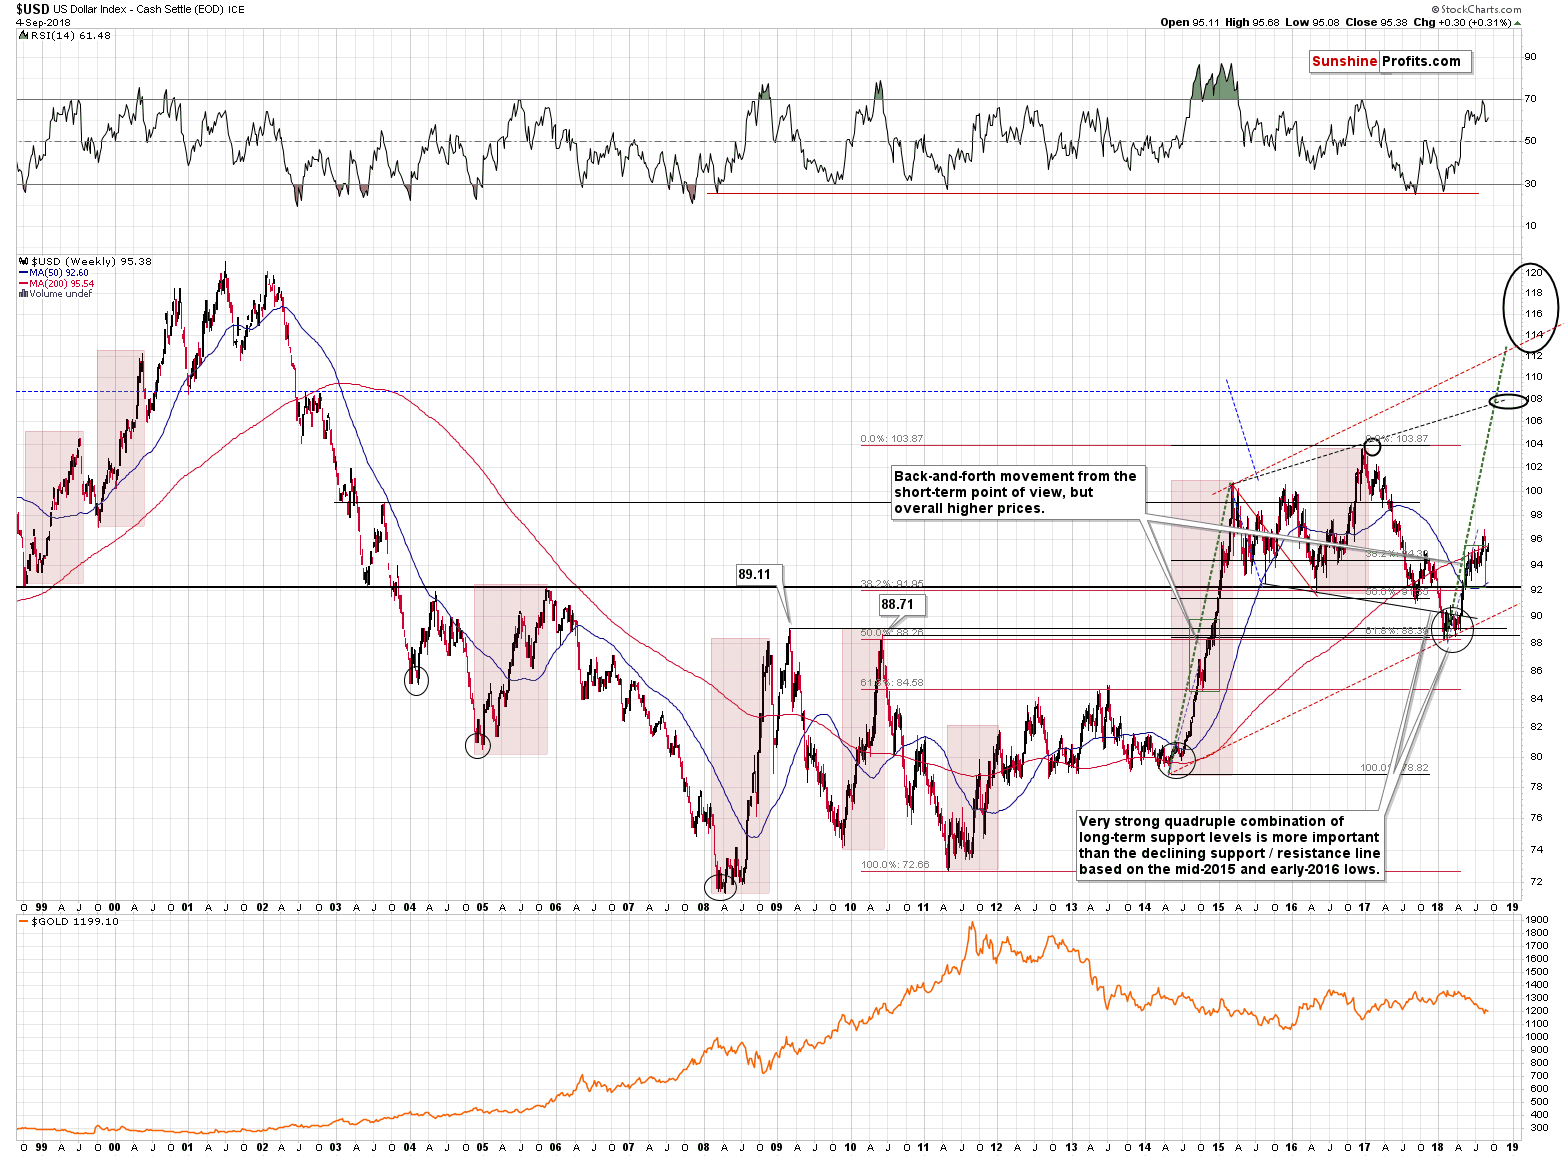
In today’s analysis, we would also like to remind you about the big picture. The USD Index is likely repeating its previous big rallies. Based on the shape of the rally so far, it’s repeating the 2008, 2010, and 2014-2015 rallies. There were some corrections along the way, but on average the USD moved higher without bigger declines. That’s exactly what’s taking place right now and if history is to repeat itself, we should expect the USD Index to move at least to the 2016-2017 highs, but more likely to about 108 the level. The 112 – 120 range is not out of the question either.
Either way, the outlook is very bullish for the next several weeks and the implications are very bearish for the PM sector.
Possible Price Target Combinations
As you’ve read this week, there are near-term and final price targets for gold, silver and mining stocks and it’s quite likely that they will correspond to each other. In fact, seeing the targets confirmed is one of the things we’ll be looking at when determining what to do with our investment (none so far) and trading (very profitable, short) positions.
The first combination of targets is $1,050 (or so) for gold, $12.50 (or so) for silver, and 100 (again, approximately) for the HUI Index. The above corresponds to about $13 in the GDX, but we’ll be looking at the HUI as the target is clearer in its case.
The second combination of targets is $890 in gold, $8.9 in silver (or at about $8.5 at the 2008 bottom), and the HUI at either close to 60 or 80.
If we see at least one of the targets being reached but others are not, we will look at ratios and the USD Index for guidance. The long-term indicators should be useful as well. The gold to silver ratio at 100 will be an important signal, so if gold moves to $1,050 and silver moves to $10.5 or so, we might also switch to long positions and enter the precious metals market with the long-term investment capital. Yet, it’s too early to say that with certainty – our action will depend on other factors as well. For instance, on the position of the HUI Index and the USD Index, the strength in the former relative to gold and the strength of gold relative to the moves in the USDX.
Important Analyses
Before summarizing, we would like to emphasize that we have recently posted several analyses that are very important and that one should keep in mind, especially in the next several weeks. If you haven’t had the chance of reading them previously, we encourage you to do so today:
- Dear Gold Investor - Letters from 2013 - Analogy to 2013, which should make it easier to trade the upcoming sizable upswing (if enough factors point to it, that is) and to enter the market close to the final bottom.
- Gold to Soar Above $6,000 - discussion of gold’s long-term upside target of $6,000.
- Preparing for THE Bottom in Gold: Part 6 – What to Buy - extremely important analysis of the portfolio structure for the next huge, multi-year rally in the precious metals.
- Preparing for THE Bottom in Gold: Part 7 – Buy-and-hold on Steroids – description of a strategy dedicated to significantly boosting one’s long-term investment returns while staying invested in the PM sector.
- Gold’s Downside Target, Upcoming Rebound, and Miners’ Buy Plan - details regarding the shape of the following price moves, a buying plan for mining stocks, and a brief discussion of the final price targets for the current decline.
- Gold: What Happened vs. What Changed – discussion of the latest extreme readings from gold’s CoT report
- Key Factors for Gold & Silver Investors - discussion of key, long-term factors that support the bearish outlook for PMs. We are often asked what makes us so bearish – this article is a reply to this question.
Summary
Summing up, it’s very likely that the pause in the precious metals market is over and the next big move down is already underway. The move is likely to be sharp and the profits on the current short position are likely to change from being huge to being enormous and then finally to being ridiculous.
Since we have seen more bearish signals and it has become even more likely that the decline will continue, we think it’s a good idea to move the stop-loss orders lower and effectively lock in a bigger part or our profits, while simultaneously allowing them to increase further.
As always, we’ll keep you – our subscribers – informed.
Trading capital (supplementary part of the portfolio; our opinion): Full short positions (250% of the full position) in gold, silver and mining stocks are justified from the risk/reward perspective with the following stop-loss orders and exit profit-take price levels:
- Gold: profit-take exit price: $1,062; stop-loss: $1,226; initial target price for the DGLD ETN: $82.96; stop-loss for the DGLD ETN $53.67
- Silver: profit-take exit price: $12.72; stop-loss: $15.16; initial target price for the DSLV ETN: $46.97; stop-loss for the DSLV ETN $31.37
- Mining stocks (price levels for the GDX ETF): profit-take exit price: $13.12; stop-loss: $19.61; initial target price for the DUST ETF: $80.97; stop-loss for the DUST ETF $33.37
Note: the above is a specific preparation for a possible sudden price drop, it does not reflect the most likely outcome. You will find a more detailed explanation in our August 1 Alert. In case one wants to bet on junior mining stocks’ prices (we do not suggest doing so – we think senior mining stocks are more predictable in the case of short-term trades – if one wants to do it anyway, we provide the details), here are the stop-loss details and target prices:
- GDXJ ETF: profit-take exit price: $17.52; stop-loss: $29.43
- JDST ETF: initial target price: $154.97 stop-loss: $64.88
Long-term capital (core part of the portfolio; our opinion): No positions (in other words: cash)
Insurance capital (core part of the portfolio; our opinion): Full position
Important Details for New Subscribers
Whether you already subscribed or not, we encourage you to find out how to make the most of our alerts and read our replies to the most common alert-and-gold-trading-related-questions.
Please note that the in the trading section we describe the situation for the day that the alert is posted. In other words, it we are writing about a speculative position, it means that it is up-to-date on the day it was posted. We are also featuring the initial target prices, so that you can decide whether keeping a position on a given day is something that is in tune with your approach (some moves are too small for medium-term traders and some might appear too big for day-traders).
Plus, you might want to read why our stop-loss orders are usually relatively far from the current price.
Please note that a full position doesn’t mean using all of the capital for a given trade. You will find details on our thoughts on gold portfolio structuring in the Key Insights section on our website.
As a reminder – “initial target price” means exactly that – an “initial” one, it’s not a price level at which we suggest closing positions. If this becomes the case (like it did in the previous trade) we will refer to these levels as levels of exit orders (exactly as we’ve done previously). Stop-loss levels, however, are naturally not “initial”, but something that, in our opinion, might be entered as an order.
Since it is impossible to synchronize target prices and stop-loss levels for all the ETFs and ETNs with the main markets that we provide these levels for (gold, silver and mining stocks – the GDX ETF), the stop-loss levels and target prices for other ETNs and ETF (among other: UGLD, DGLD, USLV, DSLV, NUGT, DUST, JNUG, JDST) are provided as supplementary, and not as “final”. This means that if a stop-loss or a target level is reached for any of the “additional instruments” (DGLD for instance), but not for the “main instrument” (gold in this case), we will view positions in both gold and DGLD as still open and the stop-loss for DGLD would have to be moved lower. On the other hand, if gold moves to a stop-loss level but DGLD doesn’t, then we will view both positions (in gold and DGLD) as closed. In other words, since it’s not possible to be 100% certain that each related instrument moves to a given level when the underlying instrument does, we can’t provide levels that would be binding. The levels that we do provide are our best estimate of the levels that will correspond to the levels in the underlying assets, but it will be the underlying assets that one will need to focus on regarding the signs pointing to closing a given position or keeping it open. We might adjust the levels in the “additional instruments” without adjusting the levels in the “main instruments”, which will simply mean that we have improved our estimation of these levels, not that we changed our outlook on the markets. We are already working on a tool that would update these levels on a daily basis for the most popular ETFs, ETNs and individual mining stocks.
Our preferred ways to invest in and to trade gold along with the reasoning can be found in the how to buy gold section. Additionally, our preferred ETFs and ETNs can be found in our Gold & Silver ETF Ranking.
As a reminder, Gold & Silver Trading Alerts are posted before or on each trading day (we usually post them before the opening bell, but we don't promise doing that each day). If there's anything urgent, we will send you an additional small alert before posting the main one.
=====
Latest Free Trading Alerts:
98.4 percent. That are the market odds of the September Fed hike. But what will happen later? In this edition of the GNM, we dig into the recent FOMC minutes to answer this question. Read our article and find out!
Gold Should Prepare for Further Fed Hikes
=====
Hand-picked precious-metals-related links:
PRECIOUS-Gold edges higher as dollar rally takes a breather
India's Aug gold imports double, hit 15-month high as prices drop -GFMS
US Mint Gold Coins sales sink in August
=====
In other news:
Wall Street Analysts Split on How to Trade ‘Overvalued’ Dollar
Emerging markets and equities reel as dollar flexes muscles
No Relief in Sight for Emerging Markets as Rand Leads Sell-Off
JP Morgan's top quant warns next crisis to have flash crashes and social unrest not seen in 50 years
U.K. Would Vote Against Brexit in Second Referendum, Study Says
Copper price takes another beating
Saudi Arabia is said to aim to keep crude in $70 to $80 band
=====
Thank you.
Sincerely,
Przemyslaw Radomski, CFA
Founder, Editor-in-chief, Gold & Silver Fund Manager
Gold & Silver Trading Alerts
Forex Trading Alerts
Oil Investment Updates
Oil Trading Alerts

