

Briefly: In our opinion, full (150% of the regular full position) speculative short positions in gold, silver and mining stocks are justified from the risk/reward perspective at the moment of publishing this alert.
Every now and then we see some kind of anomaly in the precious metals market. Sometimes it’s particularly useful and sometimes it’s just something random. Yesterday was one of those days where something didn’t seem right. The USD Index rallied, silver declined, mining stocks declined and yet, gold closed the session higher. What can we infer from this uncommon event?
Unfortunately, not much. It was just one day when gold behaved in this way, so at this time we have no reasons to believe that gold’s one-metal rally was anything important. One thing that was visible in the gold market and that wasn’t visible in other parts of the precious metals market was the breakout above the triangle pattern. Consequently, yesterday’s strength might have simply been a consequence of the breakout and we already described it yesterday. We wrote that we could see an upswing, but we don’t think it will be anything major, for instance a move to the October high. So, in a way, nothing changed even though the relative moves during yesterday’s session might have raised many eyebrows.
Let’s move to the charts (chart courtesy of http://stockcharts.com).
In yesterday’s alert, we wrote the following:
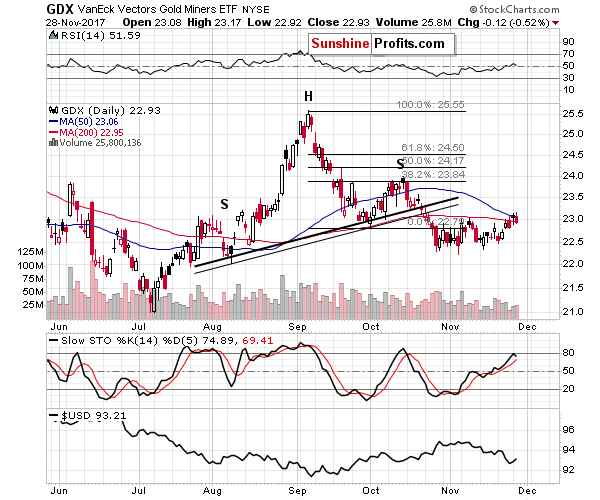
Mining stocks rallied on relatively low volume, which is a bearish sign in general. Another thing is that the Stochastic moved to the 80 level, which indicates topping action (just like it was the case in June and October). Finally, mining stocks moved to the 50-day moving average, without breaking above it. The latter could easily serve as the key resistance - that was more or less the case in June and October (just like it was the case with Stochastic).
Miners declined yesterday on volume that was slightly higher than what we had seen during Monday’s upswing and the implications are bearish. The same goes for the Stochastic indicator that just reversed after touching the 80 level.
Our comments on the HUI Index remain up-to-date as well:
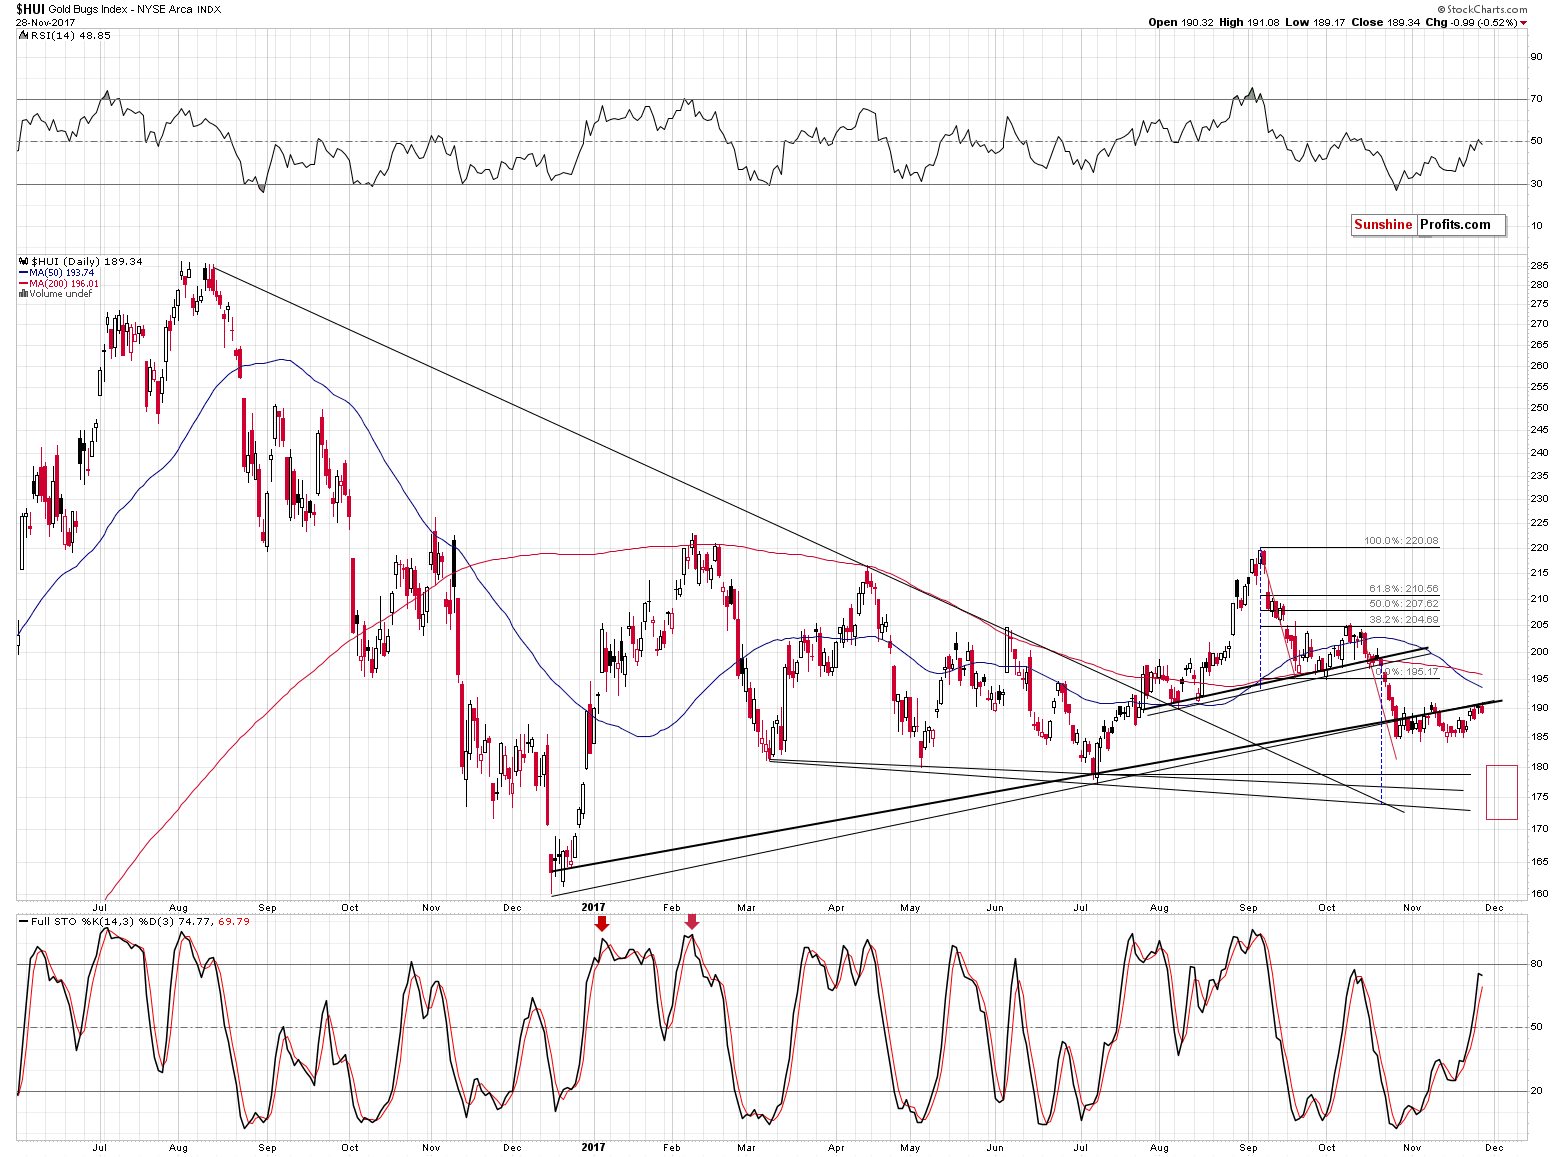
The above HUI Index chart shows that last week’s rally didn’t change anything – it was yet another move to the previously broken lines, which once again proved to be strong resistance.
At the same time the RSI and Stochastic moved visibly higher, which suggests that the monthly pause managed to cool down the investors’ emotions and that makes room for another downswing. The RSI level close to 50 was quite often seen at local tops during bigger declines (especially in 2016), which serves as another bearish sign.
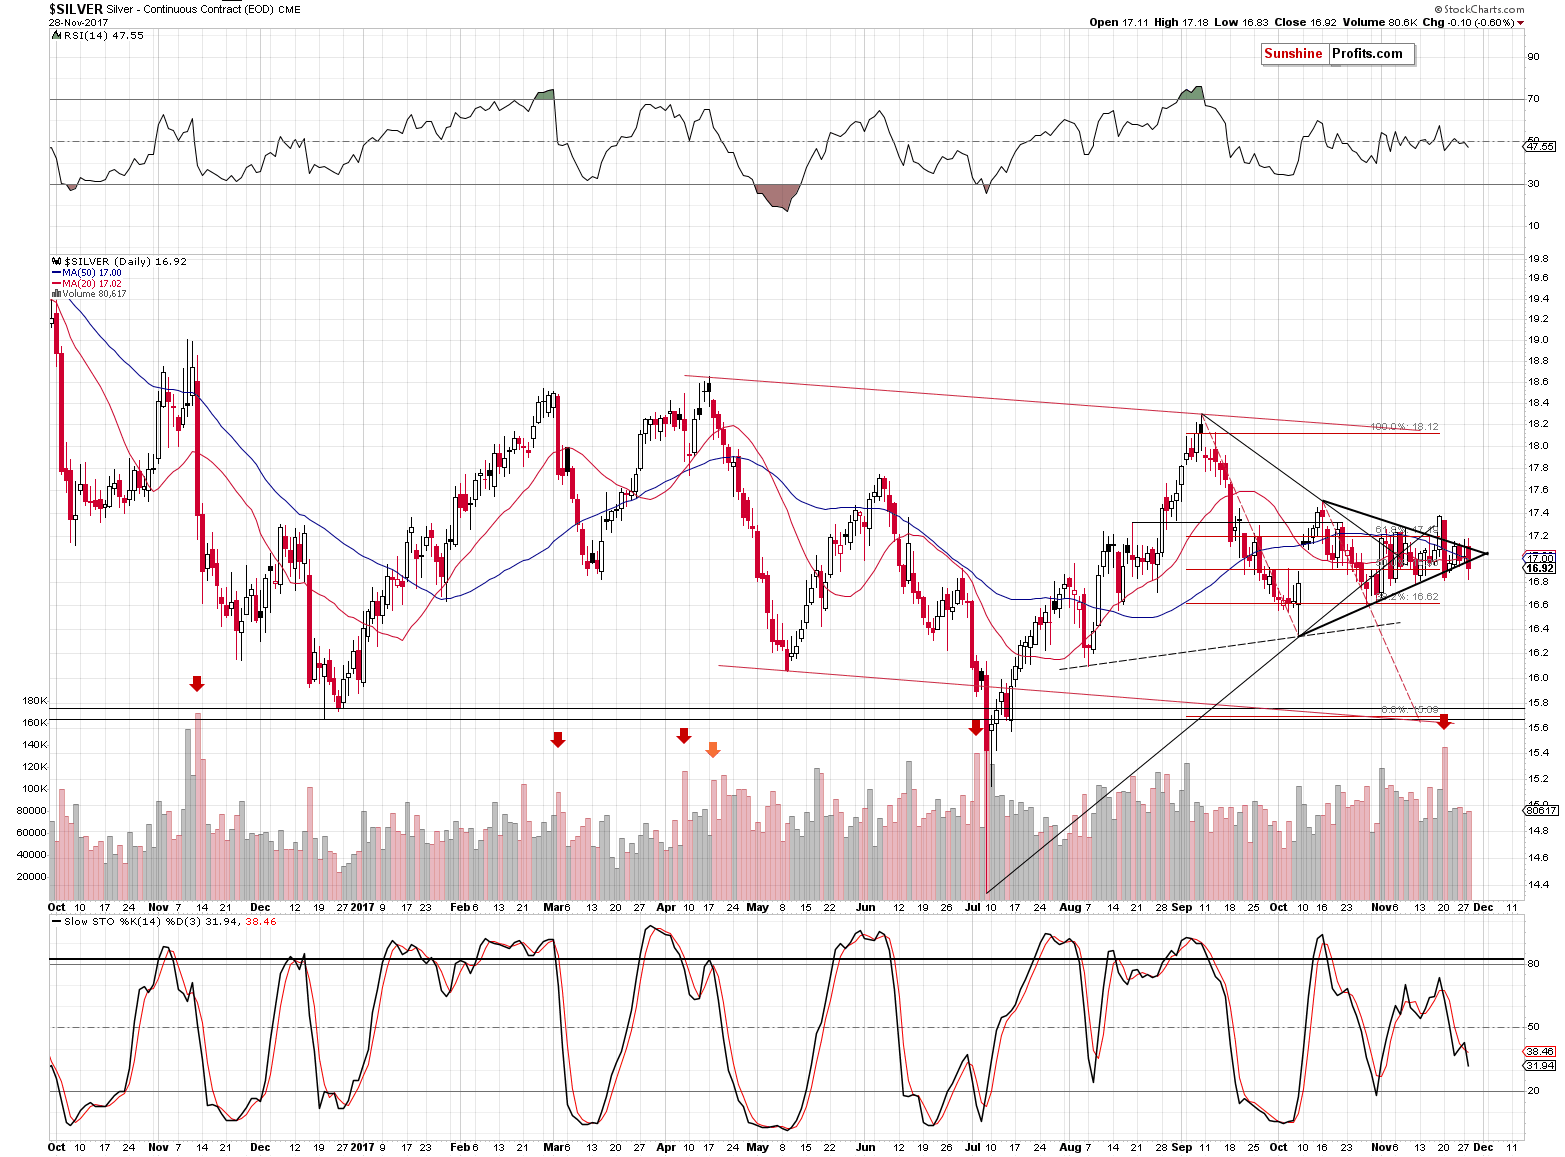
Interestingly, while gold moved higher, silver moved lower and closed the day a bit below the lower border of the declining trend channel after moving visibly below it. At the moment of writing these words, silver is trading at $16.84, so it seems to be completing the breakdown.
Still, let’s keep in mind that just like the mid-November breakout was invalidated, the current breakdown could be invalidated as well, so a quick, but unimportant upswing should not surprise us.
In yesterday’s alert, we wrote the following:
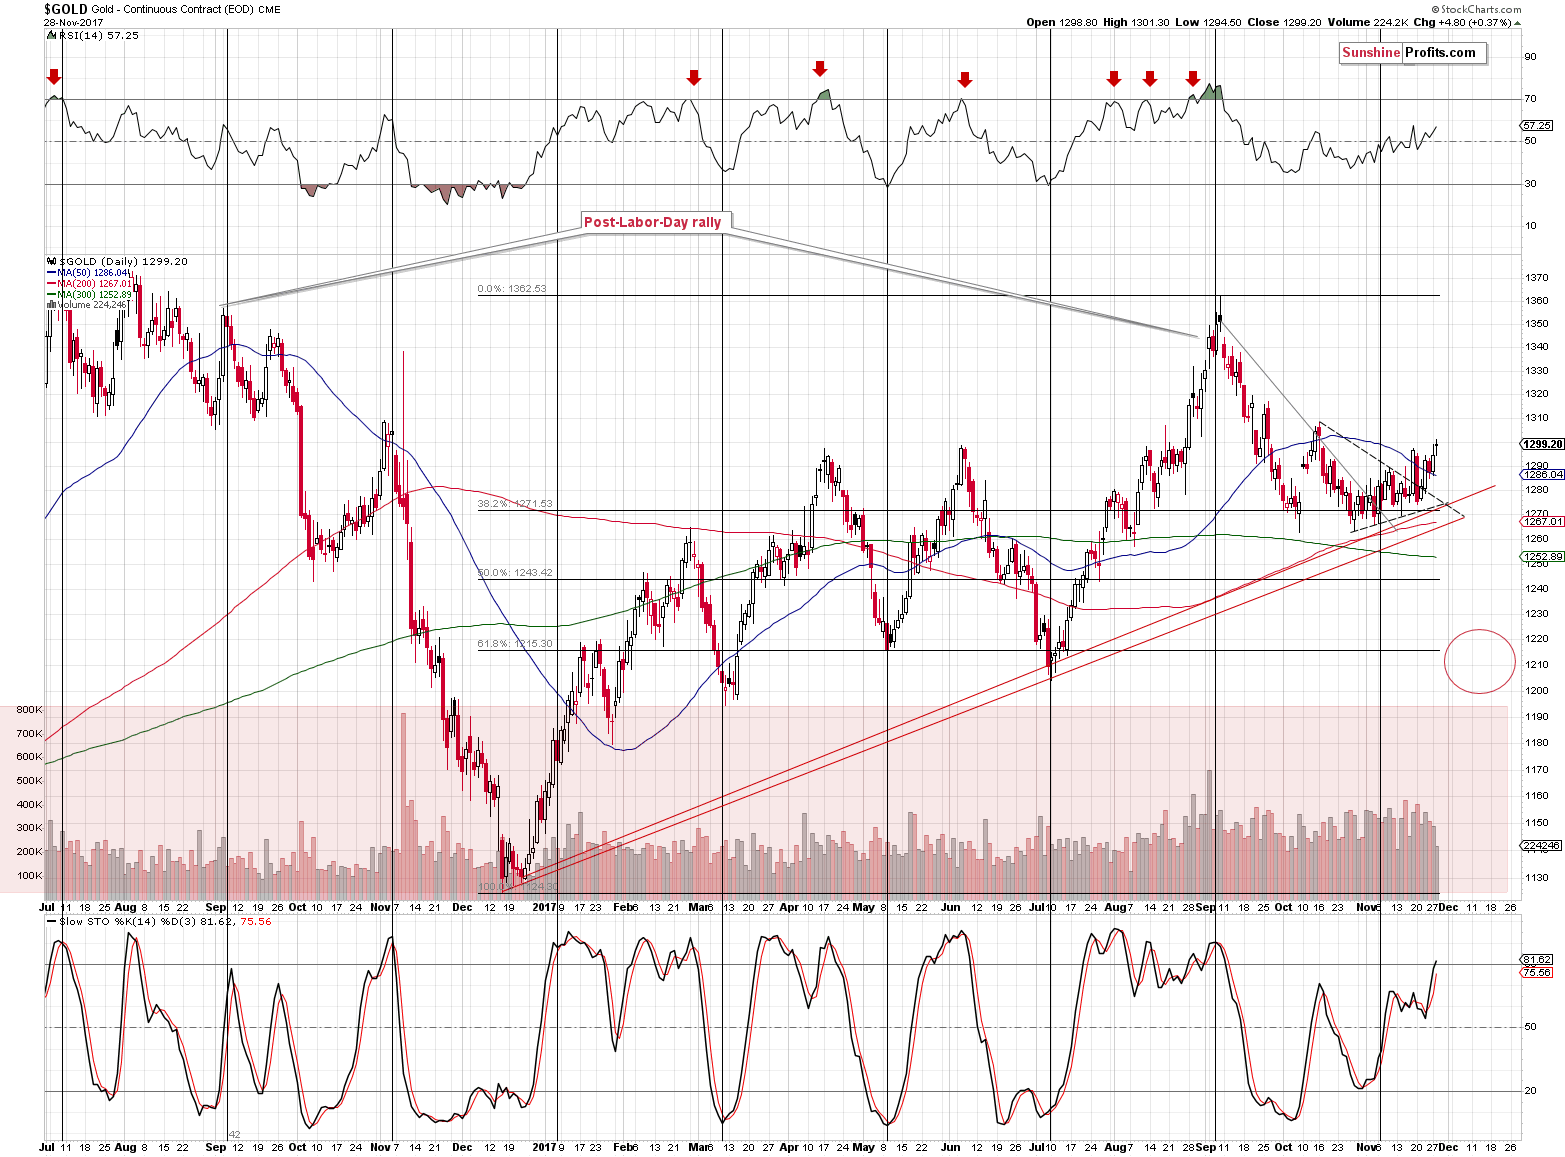
Gold moved higher on declining volume yesterday, but overall it continues to move back and forth below the $1,300 level. Its move above the 50-day moving average and then 2 closes above are somewhat similar to the October top. The Stochastic and RSI levels are similar as well. The above is a weak, but still, bearish sign. Even though Stochastic is at similar levels, we can see that the current reading is higher. In a way, even though the price of gold is lower, the above means that gold is closer to being overbought now, than it was in October.
On a bullish note, gold confirmed the breakout above the triangle pattern, which could result in a short-term rally. Still, we don’t expect the upswing to take gold much higher – the October high seems to be a likely target if gold’s rally continues. Again, that’s a big if, as based i.a. on the 61.8% Fibonacci retracement in the USD, the latter could rally immediately and gold could decline immediately as a result.
While Monday’s volume during the upswing was relatively low, the volume that we saw yesterday was very low. This, plus the fact that both silver and mining stocks declined, suggests that gold’s rally was most likely accidental – not an indication of a looming rally.
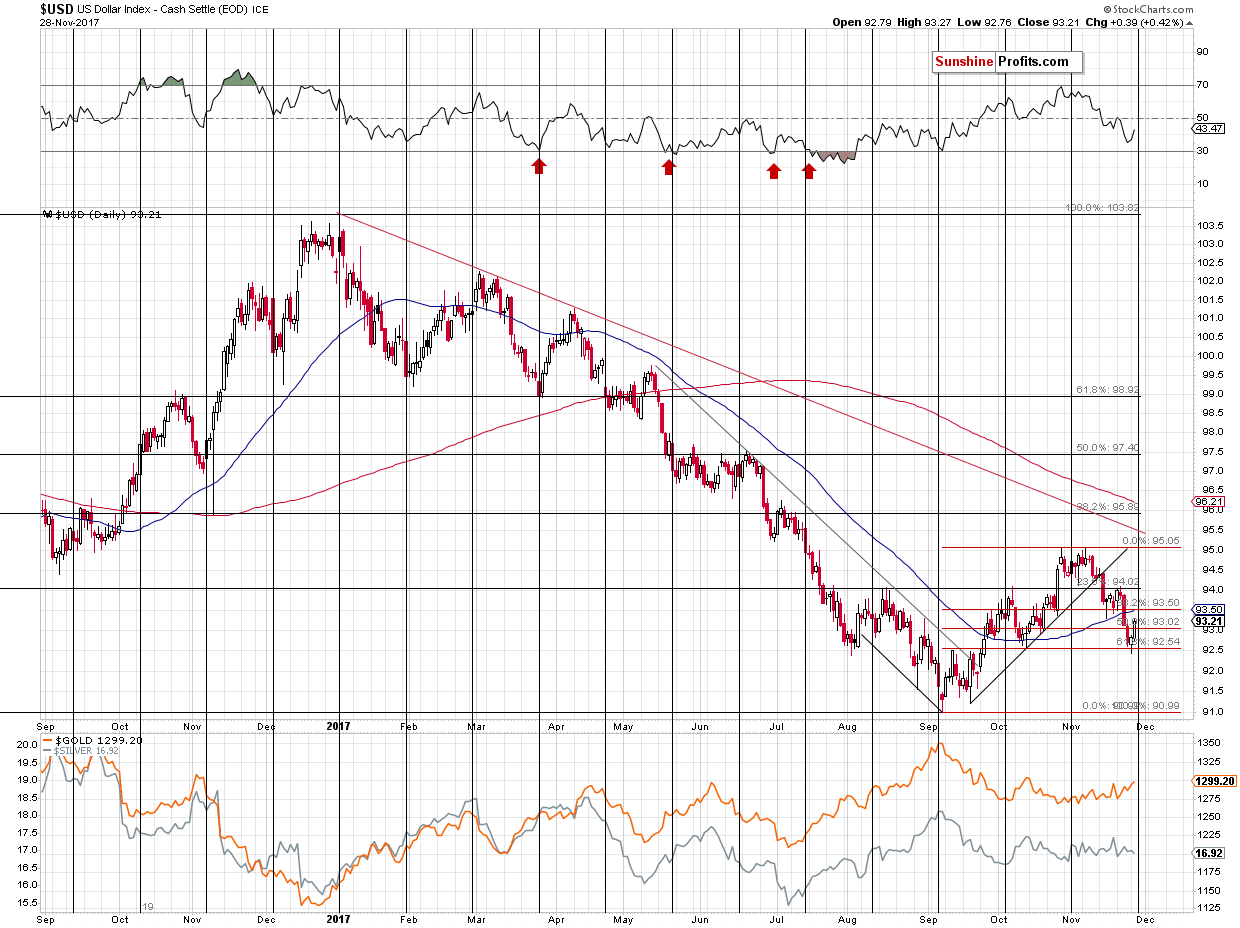
In Monday’s alert, we wrote about a possible move below the 61.8% Fibonacci retracement level and a subsequent invalidation – that’s exactly what we saw during Monday’s session. Yesterday’s session further confirmed that the local bottom might be in.
The Monday reversal took place quite close to the cyclical turning point, which further increases the odds that the bottom is really in. Based on the analogy in terms of time to the previous corrections in the early parts of major rallies in the USD, this is likely.
Summing up, gold’s rally that we saw yesterday is either inconsequential, if we focus on its relative performance to the rest of the precious metals market, or actually bearish, if we focus on it on a stand-alone basis and compare it to the size of the volume. Moreover, let’s not forget that even though the USD Index declined visibly in the past weeks, mining stocks were unable to invalidate the breakdown below the rising resistance line and the implications remain bearish. There are many signs pointing to a big move lower in the coming weeks and it seems that any short-term strength will be reversed sooner rather than later, especially if the decline in the USD Index is already over. The odds for the latter increased based on yesterday’s rally in the index.
Naturally, the medium-term outlook remains bearish, especially that the analogy to the 2012-2013 decline remains in place and the previously discussed long-term signals remain in place: gold’s huge monthly volume, the analogy in the HUI Index, the analogy between the two most recent series of interest rate hikes, and the RSI signal from gold priced in the Japanese yen.
To summarize:
Trading capital (supplementary part of the portfolio; our opinion): Short positions (150% of the full position) in gold, silver and mining stocks are justified from the risk/reward perspective with the following stop-loss orders and exit price levels / profit-take orders:
- Gold: exit price: $1,218; stop-loss: $1,366; exit price for the DGLD ETN: $51.98; stop-loss for the DGLD ETN $38.74
- Silver: exit price: $15.82; stop-loss: $19.22; exit price for the DSLV ETN: $28.88; stop-loss for the DSLV ETN $17.93
- Mining stocks (price levels for the GDX ETF): exit price: $21.23; stop-loss: $26.34; exit price for the DUST ETF: $29.97; stop-loss for the DUST ETF $21.37
In case one wants to bet on junior mining stocks' prices (we do not suggest doing so – we think senior mining stocks are more predictable in the case of short-term trades – if one wants to do it anyway, we provide the details), here are the stop-loss details and exit prices:
- GDXJ ETF: exit price: $30.28; stop-loss: $45.31
- JDST ETF: exit price: $66.27; stop-loss: $43.12
Long-term capital (core part of the portfolio; our opinion): No positions (in other words: cash)
Insurance capital (core part of the portfolio; our opinion): Full position
Important Details for New Subscribers
Whether you already subscribed or not, we encourage you to find out how to make the most of our alerts and read our replies to the most common alert-and-gold-trading-related-questions.
Please note that the in the trading section we describe the situation for the day that the alert is posted. In other words, it we are writing about a speculative position, it means that it is up-to-date on the day it was posted. We are also featuring the initial target prices, so that you can decide whether keeping a position on a given day is something that is in tune with your approach (some moves are too small for medium-term traders and some might appear too big for day-traders).
Plus, you might want to read why our stop-loss orders are usually relatively far from the current price.
Please note that a full position doesn’t mean using all of the capital for a given trade. You will find details on our thoughts on gold portfolio structuring in the Key Insights section on our website.
As a reminder – “initial target price” means exactly that – an “initial” one, it’s not a price level at which we suggest closing positions. If this becomes the case (like it did in the previous trade) we will refer to these levels as levels of exit orders (exactly as we’ve done previously). Stop-loss levels, however, are naturally not “initial”, but something that, in our opinion, might be entered as an order.
Since it is impossible to synchronize target prices and stop-loss levels for all the ETFs and ETNs with the main markets that we provide these levels for (gold, silver and mining stocks – the GDX ETF), the stop-loss levels and target prices for other ETNs and ETF (among other: UGLD, DGLD, USLV, DSLV, NUGT, DUST, JNUG, JDST) are provided as supplementary, and not as “final”. This means that if a stop-loss or a target level is reached for any of the “additional instruments” (DGLD for instance), but not for the “main instrument” (gold in this case), we will view positions in both gold and DGLD as still open and the stop-loss for DGLD would have to be moved lower. On the other hand, if gold moves to a stop-loss level but DGLD doesn’t, then we will view both positions (in gold and DGLD) as closed. In other words, since it’s not possible to be 100% certain that each related instrument moves to a given level when the underlying instrument does, we can’t provide levels that would be binding. The levels that we do provide are our best estimate of the levels that will correspond to the levels in the underlying assets, but it will be the underlying assets that one will need to focus on regarding the signs pointing to closing a given position or keeping it open. We might adjust the levels in the “additional instruments” without adjusting the levels in the “main instruments”, which will simply mean that we have improved our estimation of these levels, not that we changed our outlook on the markets. We are already working on a tool that would update these levels on a daily basis for the most popular ETFs, ETNs and individual mining stocks.
Our preferred ways to invest in and to trade gold along with the reasoning can be found in the how to buy gold section. Additionally, our preferred ETFs and ETNs can be found in our Gold & Silver ETF Ranking.
As a reminder, Gold & Silver Trading Alerts are posted before or on each trading day (we usually post them before the opening bell, but we don't promise doing that each day). If there's anything urgent, we will send you an additional small alert before posting the main one.
=====
Latest Free Trading Alerts:
President Trump will reshape the Federal Reserve. What does it mean for the gold market?
=====
Hand-picked precious-metals-related links:
PRECIOUS-Gold price firms on softer dollar but narrow range holds
Goldman Sachs among bidders for Scotiabank's metals unit - sources
Gold Trader to Tell Jury Inside Story of Turkish Corruption
=====
In other news:
Goldman Warns Highest Valuations Since 1900 Mean Pain Is Coming
Tax bill hopes pull futures higher
US markets looking 'overstretched' and could trigger a sharp reversal, ECB vice president says
Bitcoin tops $10,000, marks 10-fold increase in 2017
Bitcoin and the Fear of Missing Out
North Korea says 'breakthrough' puts U.S. mainland within range of nuclear weapons
North Korea's ICBM test is 'tip of the iceberg' on what's to come, says defense expert
Oil slips on OPEC deal uncertainty and rising U.S. inventories
=====
Thank you.
Sincerely,
Przemyslaw Radomski, CFA
Founder, Editor-in-chief, Gold & Silver Fund Manager
Gold & Silver Trading Alerts
Forex Trading Alerts
Oil Investment Updates
Oil Trading Alerts

