

Briefly: in our opinion, full (300% of the regular position size) speculative short positions in mining stocks are justified from the risk/reward point of view at the moment of publishing this Alert.
The markets are waiting for the Jackson Hole comments (most likely for what Powell says), so it’s not surprising that we’ve seen no real action so far today. We didn’t see it yesterday either, which means that practically everything that I wrote yesterday remains up-to-date. If you haven’t read my yesterday’s analysis, I encourage you to read it today. The technical part of today’s issue will be mostly dedicated to the intraday changes that we’ve seen so far today.
Let’s start with the USD Index.
In short, the U.S. currency moved slightly higher after (probably) bottoming at its rising red support line. Consequently, what I wrote previously remains up-to-date:
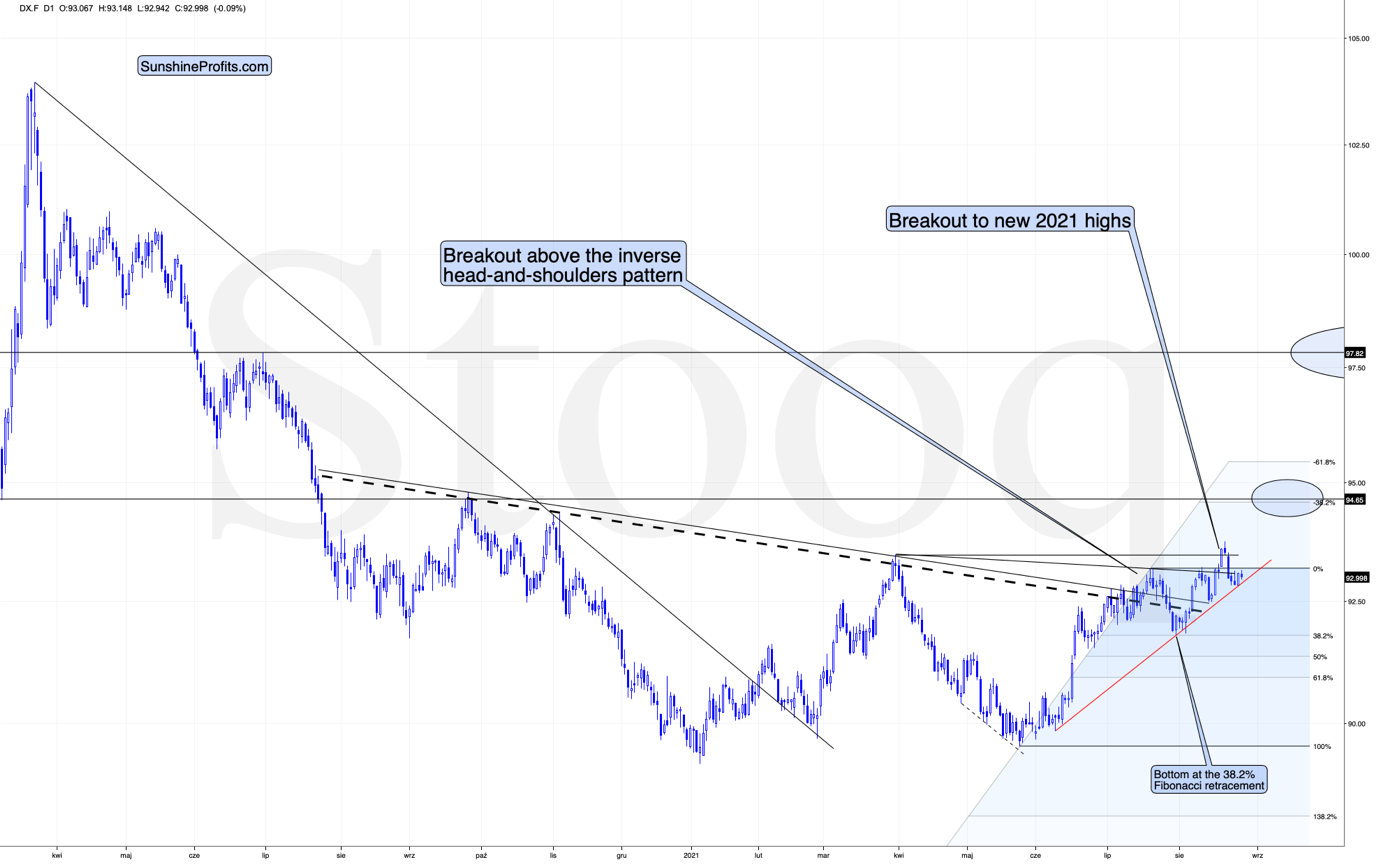
The USD Index invalidated the breakout to new 2021 highs, but it didn't invalidate the previous inverse head-and-shoulders pattern, so the downside seems very limited.
There’s a rising short-term support line based on the June and July lows that currently “says” that the USD Index is unlikely to fall below ~92.75. At the moment of writing these words, the USD Index is trading at about 93.07, so it’s very close to above-mentioned level.
And even if the USDX declines below it, there’s support at about 92.5 provided by the neck level of the previously confirmed inverse head-and-shoulders pattern. This means that the USDX is unlikely to decline below this level, and this in turn means that the downside seems to be limited to about 0.6 index point. That’s not a lot.
Remember when the USD Index previously invalidated the breakout above the inverse H&S pattern? I wrote then that it could decline to the nearest support level provided – then – by the 38.2% Fibonacci retracement. Now the nearest support is provided by the rising support line at about 92.75.
This doesn’t mean that gold will necessarily rally from here or that the rally will be substantial. On the lower part of the above chart, you can see that gold moved to its declining resistance line, which means that it could decline right away.
The USD Index didn’t move to the above-mentioned rising support line, but it was very close to it. The USD Index has been relatively flat so far today, but gold is already down, so it seems that even if the USD Index bottoms slightly lower, it might not take gold to new short-term highs.
Having said that, let’s move to gold.
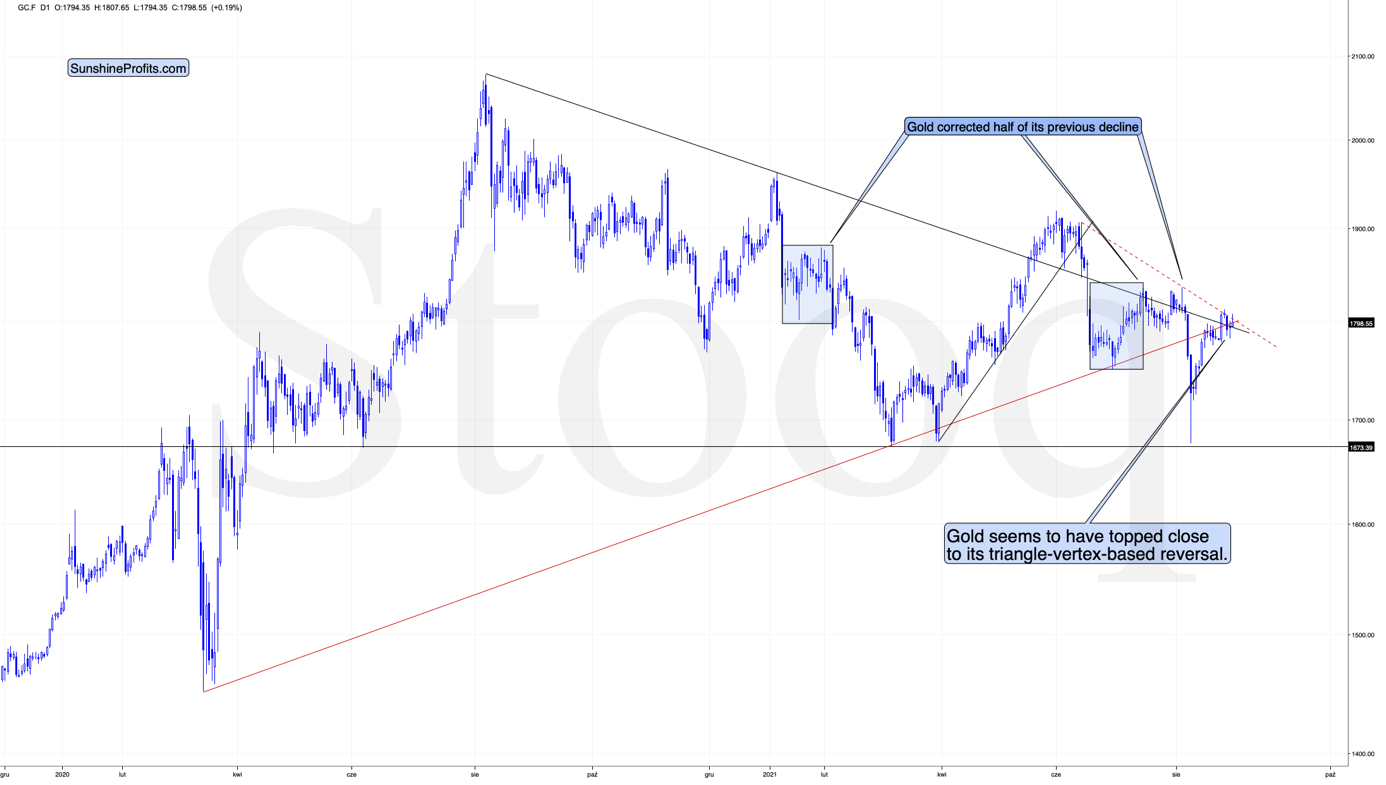
Gold moved higher initially today, and then it moved back down. That was another attempt to rally above the declining short-term red resistance line. An attempt that failed.
Remember how gold rallied on an intraday basis on June 14 and on August 4? It was after a short-term rally and a consolidation that later proved to be a local top. Exactly the same is likely right now – what we just saw is probably a local top, and today’s pre-market upswing might have been the final “goodbye kiss” to the declining resistance line and the $1,800 level in general.
Now, things could change during today’s session, as the markets might be prone to sudden, erratic movements, but that’s normal before events the market views as important. And Powell’s Jackson Hole speech is such an event. Please don’t pay particular attention to these price moves – they are likely to be just noise.
In particular, please don’t trust any breakout or strength that we might see in silver today.
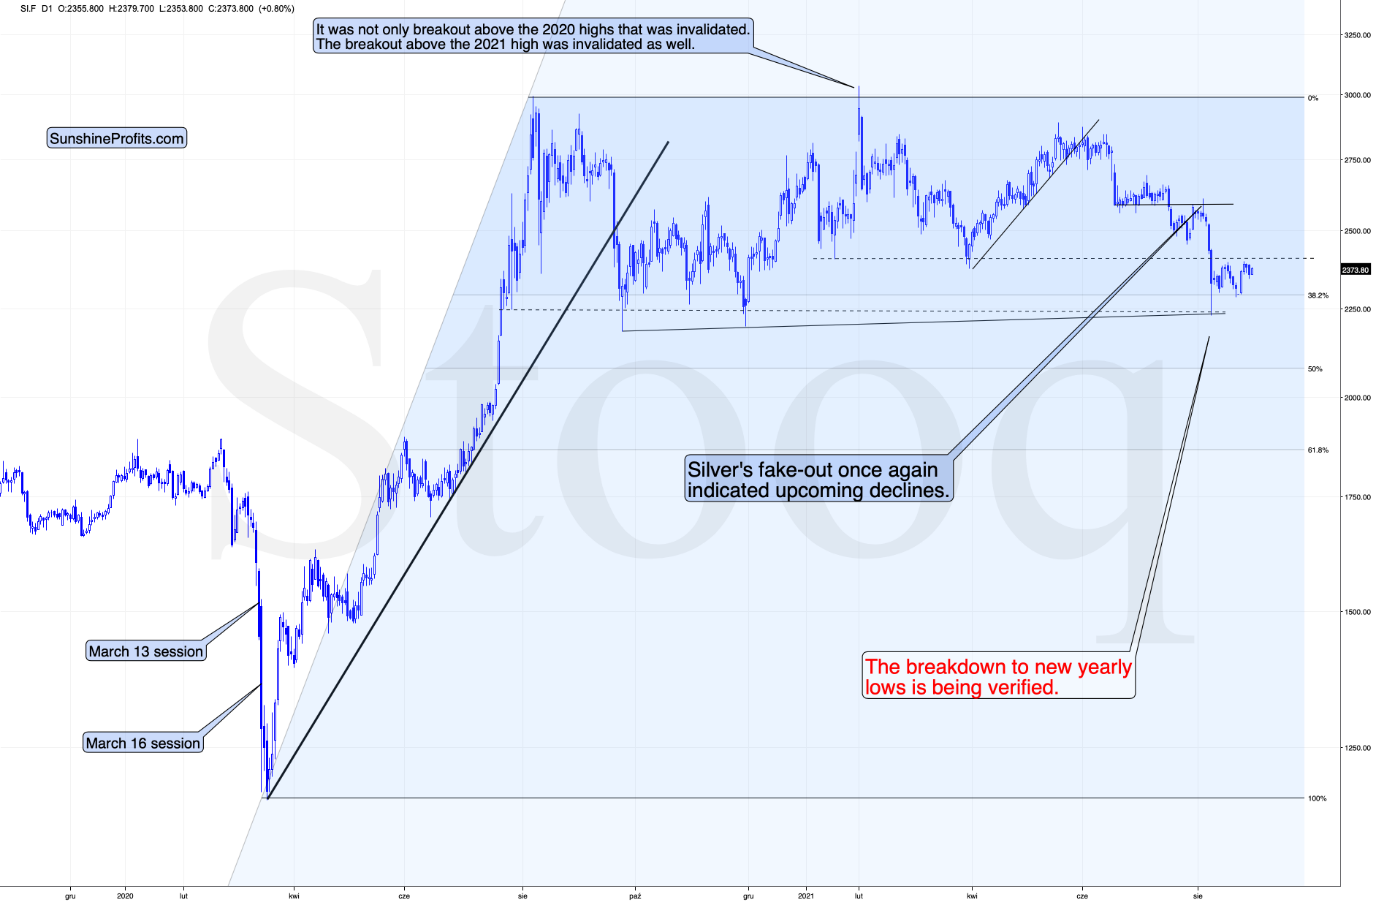
The white metal is known (at least to those who follow my analyses) for its tendency to stage fake rallies and fake breakouts just before big declines. So, we might see one today, similarly to how we saw a fake rally/breakout on August 4.
On the other hand, please note that such a performance of silver doesn’t have to take place. The markets could slide without it. If we see this short-term outperformance of silver and a fake breakout, it will just be a confirmation of the bearish trend, but if we don’t see it, the bearish trend won’t be invalidated.
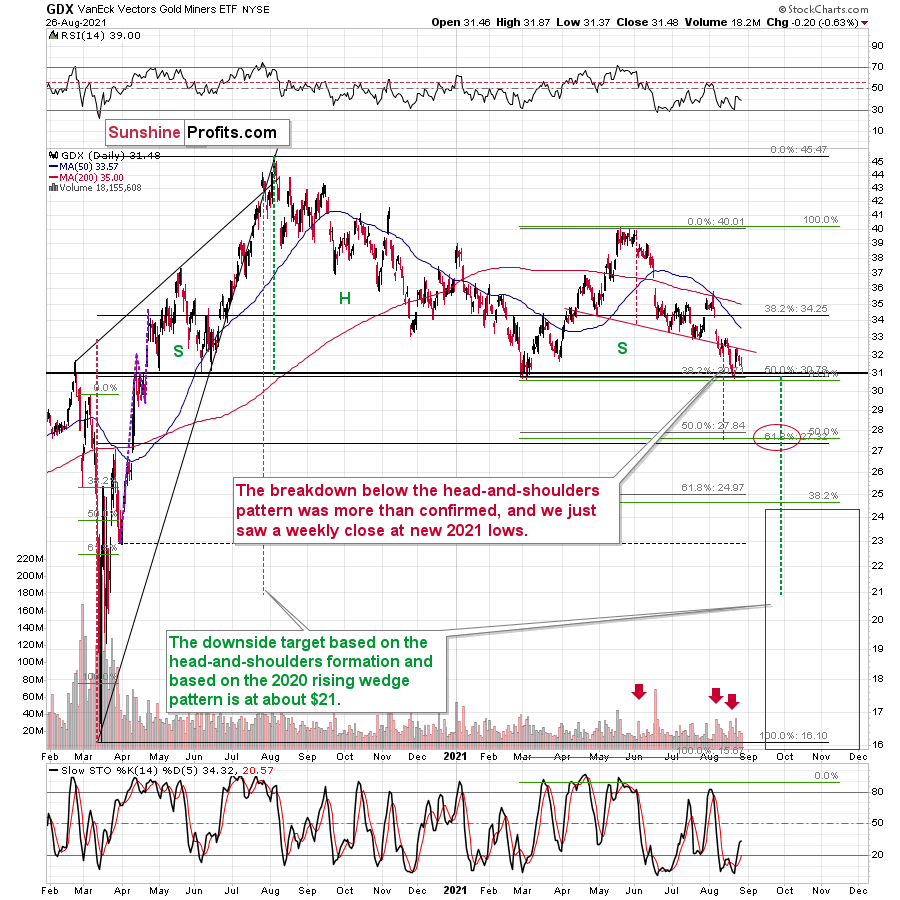
Please note that while gold is trading close to its August highs, gold stocks are trading close to their previous lows. If anyone had any doubts regarding the status of mining stocks’ strength, they should no longer hesitate.
The key thing present on the above chart is the fact that the breakdown below the yearly+ head-and-shoulders pattern was confirmed by several daily closes below the neck level of the pattern, and also by a move back to this level that was then followed by a decline. That’s as bearish as this formation gets. Based on this, the GDX ETF is likely to fall to ~$28, and it seems that we won’t have to wait for this decline much longer.
Having said that, let’s take a look at the markets from a more fundamental angle.
Fuel to the Fire
With Jerome Powell, Chairman of the U.S. Federal Reserve (Fed), scheduled to speak at the annual Jackson Hole Economic Symposium on Aug. 27, the Delta variant has clearly paved a dovish pathway. However, could the magician actually reveal his secret? Well, as a not-so-subtle hint of what’s to come (whether today or over the next few months), Fed hawks were out in full force on Aug. 26. Speaking with CNBC, Dallas Fed President Robert Kaplan said that “what we’re seeing in these [lower-income] communities is inflation affects them disproportionately. I think at the Fed we have to take that very seriously.”
And what does this mean for his taper timeline?
 Source: CNBC
Likewise, Kansas City Fed President Esther George also told CNBC on Aug. 26 that “I would be ready to talk about taper sooner rather than later.”
“When you look at the job gains we saw last month, the month before, you look at the level of inflation right now, I think it would suggest that the level of accommodation we’re providing right now is probably not needed in this scenario.”
Even more hawkish, she actually downplayed the economic impact of the Delta variant:
“Both the anecdotes I hear from our contacts in the region and the data so far do not show a material change in the outlook.”
Upping the ante, St. Louis Fed President James Bullard led the hawkish brigade on Aug. 26. Also, speaking with CNBC, Bullard said that “we do have a new framework we did say that we would allow inflation to run above target for some time, but not this much above target.”
“I think that there is worry that we’re doing more damage than helping with the asset purchases because there is an incipient housing bubble in the U.S. The median house price, at least the number I saw, was approaching $400,000,” he said. “We got into a lot of trouble in the mid-2000s by being too complacent about housing prices, so I think we want to be very careful on that this time around.”
And not only does Bullard want the taper to begin immediately, but he’s advocating for net-zero asset purchases by the end of Q1 2022.
Please see below:
 Source: CNBC
S&P 500 – A Correction Coming?
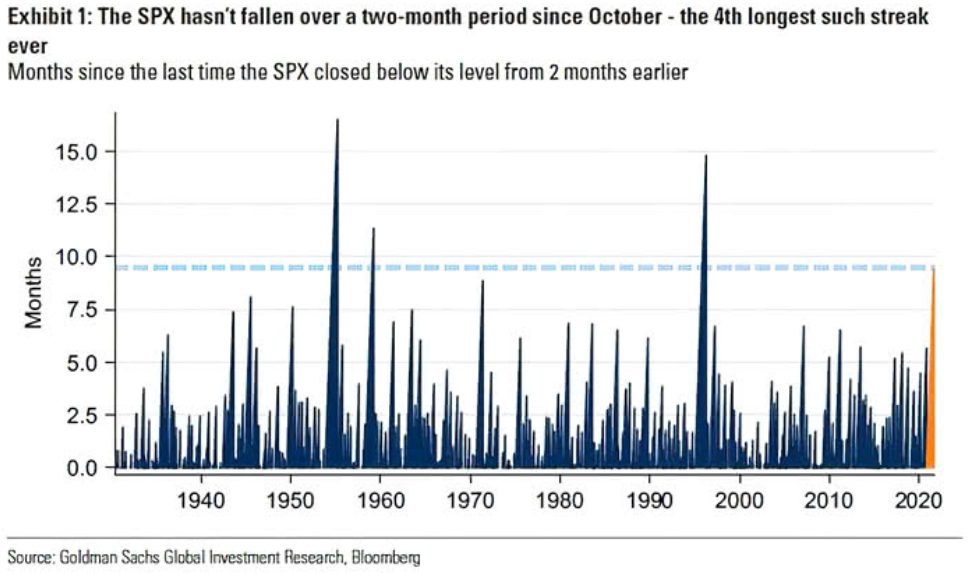
Furthermore, as the taper drama unfolded on Aug. 26, equity investors responded with expected disdain and the negativity ushered the USD Index back above 93. More importantly, though, with the gold price exhibiting strong negative correlations with the U.S. dollar, a profound correction of the S&P 500 could capsize the PMs. To explain, while the general stock market suffered another bout of volatility, the S&P 500 hasn’t recorded a two-month decline in nearly 10 months. For context, it’s the fourth-longest streak on record.
Please see below:
Moreover, the Institute for Supply Management’s (ISM) manufacturing PMI is highly correlated with the S&P 500. And with the former falling from its recent high and poised to turn lower in the coming months, the S&P 500 may find itself running out of upside catalysts.
Please see below:
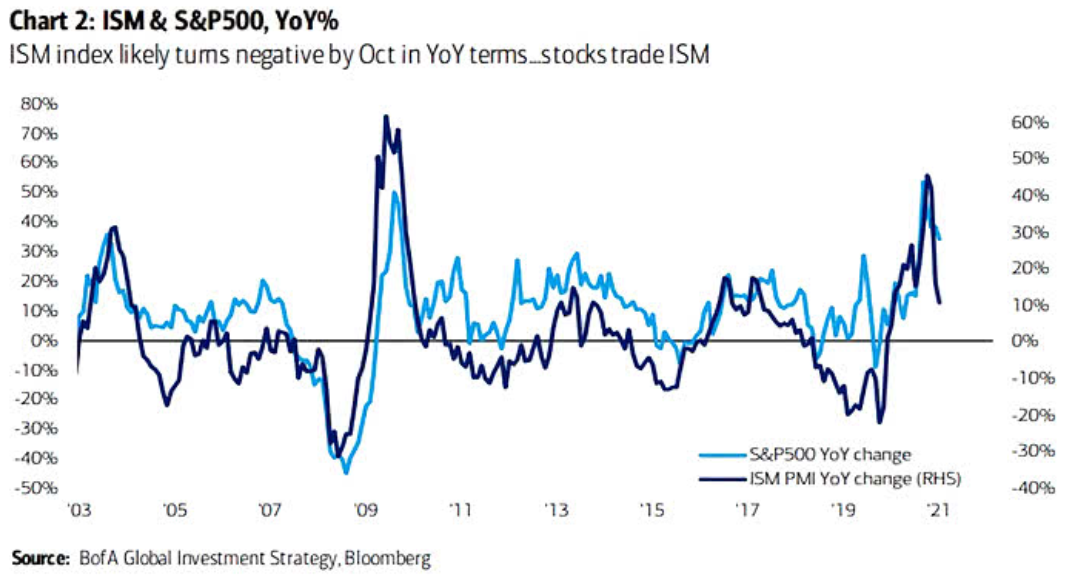
To explain, the dark blue line above tracks the year-over-year (YoY) percentage change in the ISM’s manufacturing PMI, while the light blue line above tracks the YoY percentage change in the S&P 500. If you analyze the right side of the chart, you can see that the former’s decline has already outpaced the latter’s. And with Bank of America predicting that the ISM’s manufacturing PMI (in YoY terms) will turn negative by October, the S&P 500 may follow in its footsteps.
Adding to Wall Street’s trepidation, Morgan Stanley also expects a profound correction. Chief equity strategist Michael Wilson told clients on Aug. 20 that unprecedented fiscal spending fueled “a hotter but shorter cycle” and that a reversion to the mean could hammer the S&P 500 in the coming months.
He wrote:
“With Congress expeditiously providing record amounts of fiscal stimulus last year, the table was set for a major consumer stand against the downturn. Fast forward 16 months and it's fair to say the US consumer has not disappointed. But, after a year of remarkable resilience from the US consumer, it begs the question: ‘Is it sustainable?’ While there is little doubt about the US consumers' willingness to spend, the other key variable to consider is their ability to spend.”
Please see below:
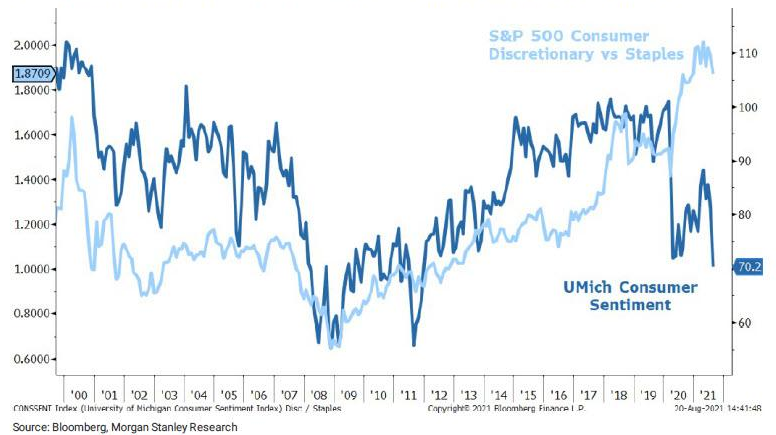
To explain, the dark blue line above tracks the University of Michigan’s Consumer Sentiment Index (CSI), while the light blue line above tracks the S&P 500’s consumer discretionary/consumer staples ratio. When the light blue line is rising, it means that consumer discretionary companies (cyclicals) are outperforming staples (risk on). Conversely, when the light blue line is falling, it means that consumer staples companies (defensives) are outperforming consumer discretionary (risk off). If you analyze the right side of the chart, you can see that the light blue line has already rolled over. And with the dark blue line now at a 2021 low, the ratio has plenty of catching up to do. Moreover, with the cyclical basket home to some of the S&P 500’s most expensive stocks outside of the technology sector, an unwinding of the excess could have a profound impact on the USD Index, and therefore, the performance of the PMs.
As further evidence, with investors throwing caution to the wind, the S&P 500 is running low on capital.
Please see below:
 Source: Bank of America
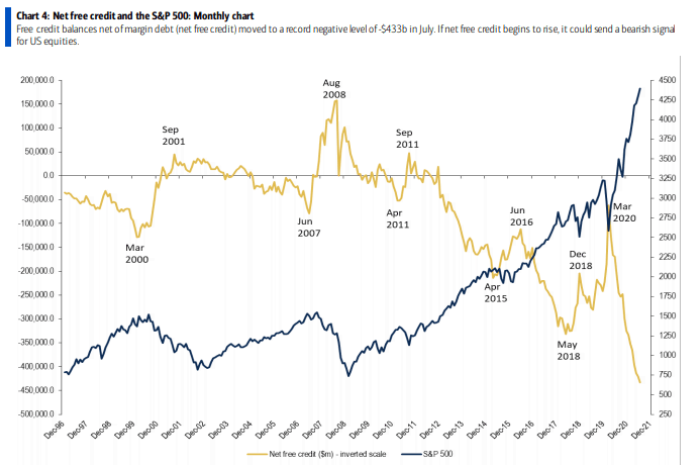
To explain, the dark blue line above tracks the S&P 500, while the gold line above tracks the net free credit balances held in investors’ cash and margin accounts (data from FINRA). In a nutshell: it’s the amount of purchasing power (cash and debt) that investors can use to buy more stocks. If you analyze the relationship, you can see that historical lows in investors’ net free credit balances often coincide with historical peaks in the S&P 500. More importantly, though, if you analyze the right side of the chart, you can see that investors’ net free credit balances are easily at an all-time low. As a result, with the bulls all in and little dry powder available to accelerate the momentum, the S&P 500’s pain could turn into the USD Index’s gain.
Volatile Times Ahead
Finally, with the Cboe Volatility Index (VIX) – which measures the expected volatility in the S&P 500 over the next 30 days – surging by more than 12% on Aug. 26, seasonal signals imply that uncertainty could reign supreme over the next few months.
Please see below:
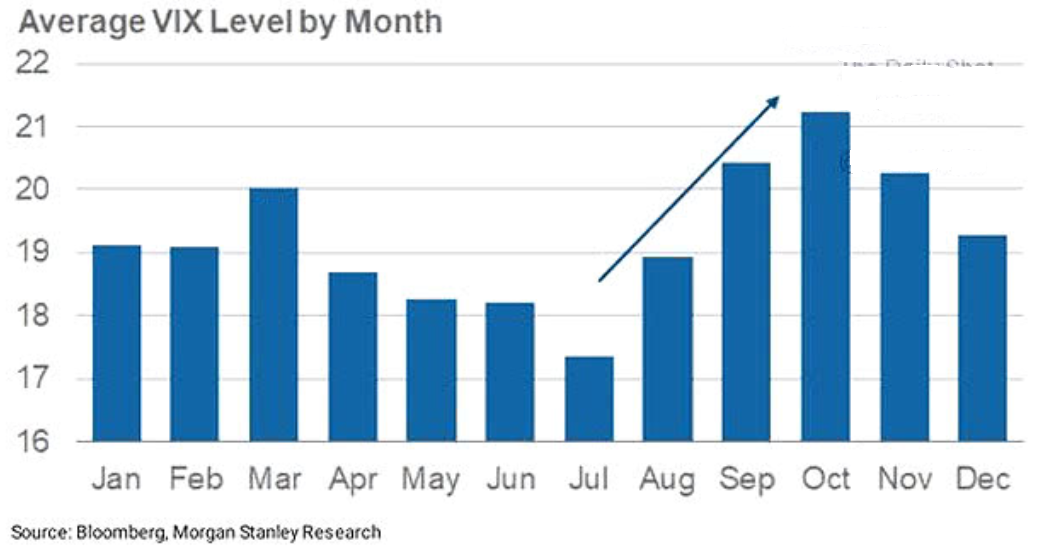
To explain, the blue bars above track the average value for the VIX during each month of the year. If you analyze the arrow in the middle, you can see that VIX spikes often occur in August, September and October. And with this year’s edition coinciding with the Fed’s taper timeline and investors’ all-time high exposure to stocks, the U.S. dollar could be in high demand if (when) volatility erupts.
In conclusion, the PMs suffered another pullback on Aug. 26 and their medium-term downtrends remain intact. And while Powell’s presser may result in ‘PMs up, USD Index down’, the short-term sugars highs often have very short shelf lives. Moreover, with the Fed’s taper timeline poised to reach its climax in the coming months and the uproar likely to upend the S&P 500, the USD Index’s medium-term fundamentals remain robust. As a result, the PMs are unlikely to find a true bottom until these developments subside.
Overview of the Upcoming Part of the Decline
- The corrective upswing in gold is over, and the big decline seems to be already underway.
- It seems that the first stop for gold will be close to its previous 2021 lows, slightly below $1,700. Then it will likely correct a bit, but it’s unclear if I want to exit or reverse the current short position based on that – it depends on the number and the nature of the bullish indications that we get at that time.
- After the above-mentioned correction, we’re likely to see a powerful slide, perhaps close to the 2020 low ($1,450 - $1,500).
- If we see a situation where miners slide in a meaningful and volatile way while silver doesn’t (it just declines moderately), I plan to switch from short positions in miners to short positions in silver. At this time, it’s too early to say at what price levels this could take place, and if we get this kind of opportunity at all – perhaps with gold close to $1,600.
- I plan to exit all remaining short positions when gold shows substantial strength relative to the USD Index while the latter is still rallying. This might take place with gold close to $1,350 - $1,400. I expect silver to fall the hardest in the final part of the move. This moment (when gold performs very strongly against the rallying USD and miners are strong relative to gold after its substantial decline) is likely to be the best entry point for long-term investments, in my view. This might also happen with gold close to $1,375, but it’s too early to say with certainty at this time. I expect the final bottom to take place near the end of the year, perhaps in mid-December.
- As a confirmation for the above, I will use the (upcoming or perhaps we have already seen it?) top in the general stock market as the starting point for the three-month countdown. The reason is that after the 1929 top, gold miners declined for about three months after the general stock market started to slide. We also saw some confirmations of this theory based on the analogy to 2008. All in all, the precious metals sector is likely to bottom about three months after the general stock market tops.
- The above is based on the information available today, and it might change in the following days/weeks.
You will find my general overview of the outlook for gold on the chart below:
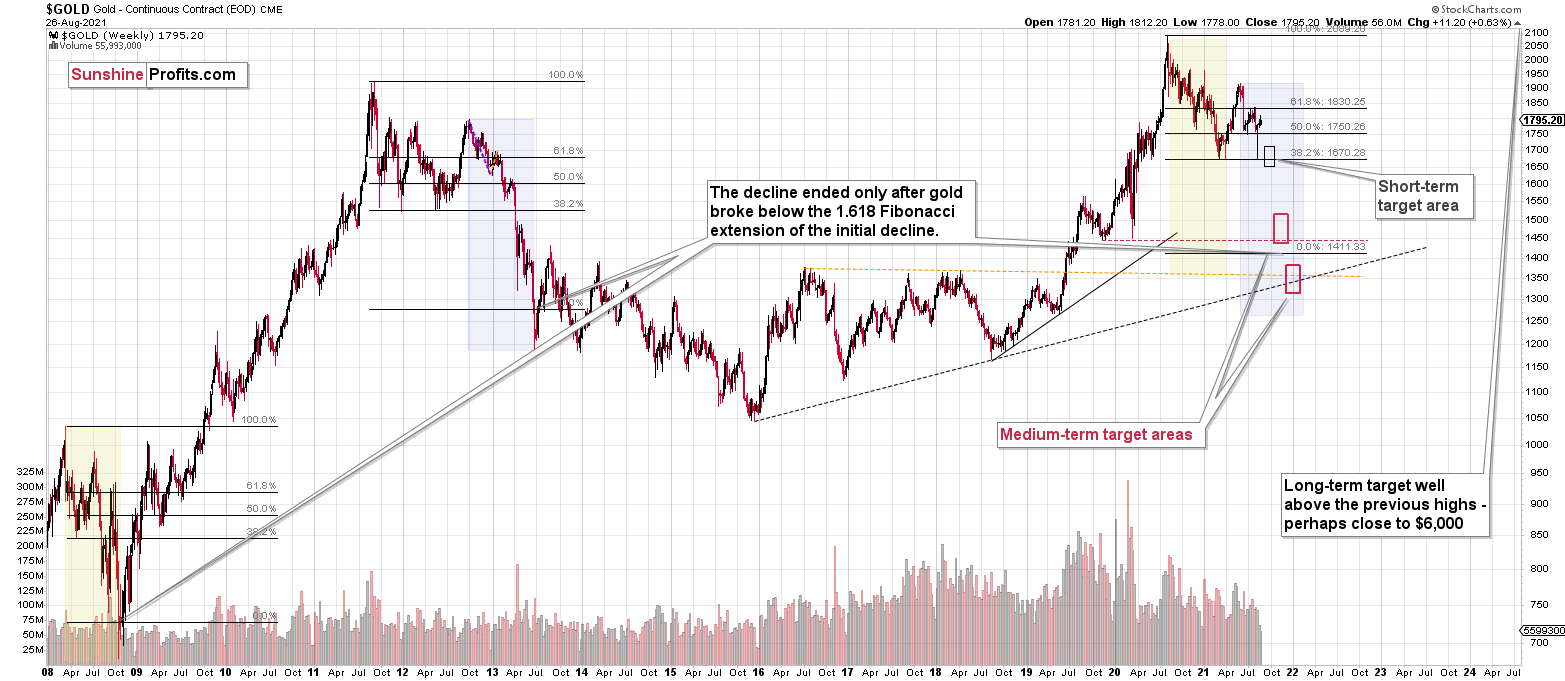
Please note that the above timing details are relatively broad and “for general overview only” – so that you know more or less what I think and how volatile I think the moves are likely to be – on an approximate basis. These time targets are not binding or clear enough for me to think that they should be used for purchasing options, warrants or similar instruments.
Could You Do Me a Favor?
We’re about to enter the video world, including (but likely not limited to) YouTube. And it’s going to happen in a few ways.
One of them is that the authors of the analyses (for example, yours truly) are going to provide (either regularly or not) vlogs along with written texts. These vlogs will be short videos in which the author discusses 1-3 of the most interesting and/or important points for the day. Communication is not just about the text, but also about the body language and tone of voice. While there won’t be much body language visible on those short videos, the face and the tone of voice of the author could provide extra information and meaning to the key points, and thus extra value.
Initially, these vlogs will probably be available along with the text analysis for a given day (with some exceptions, but we’ll get to that later), and at some point in the future, we will probably be able to provide you with those vlogs even before the analysis itself. The analysis requires more work before it’s posted – the text has to be written and then proofread / edited for clarity. Links to videos could be provided earlier, as only a few key charts are required to make the recording. The videos will be just a few minutes long, and they will be “raw” = unedited. This means that you will likely get the key details much earlier than it’s the case with the text analyses. This might be a nice feature for some and a critical feature for others, depending on the timezone that they live in.
…And most likely (unless something major happens), you’ll see the first example of the above-mentioned vlogs tomorrow, as I plan to discuss some of the issues from Monday’s flagship analysis earlier, on video.
The second and third way in which we plan to enter the video world is with interviews and debates. You more or less know how both of them work, so I won’t go into details. I will hint, though, that we plan to take a bit different approach toward them than what you can see elsewhere. For now, let’s just say that we plan to both: provide more freedom to the authors in what they want to say, but on the other hand, we will also be freer to ask questions that might be somewhat more difficult to answer.
So far, we’ve been discussing those ideas internally, but, ultimately, it’s not us who need to see value in what we’re going to do — it’s you. We’re doing this for you, after all. Consequently, I would like to ask for your help in making the above – to put it simply – great.
- What do you think about these three video-related ideas in general?
- What do you think about the vlogs as an addition to the text analysis, and the possibility that they could be made available to you even before the text analysis?
- What topics would you like us to cover in the interviews and/or during the debates? Are there specific questions that come to your mind at this point?
- Who would you like us to interview?
I would really, really, really love to hear what you think about the above – it would be of immense help if you shared your thoughts on that matter, and I will be very grateful for your feedback. So, what do you think? Please let us know by providing your comments in our contact form. Thank you very, very, very much.
Summary
To summarize, even though we might see some erratic movement during today’s session (in particular, we can’t rule out a sudden upswing in silver later today), the medium- and short-term outlooks for the precious metals sector remain down. The breakdown to new yearly lows in the HUI Index and to new yearly highs in the USD Index serve as profound confirmations that a huge downswing in the precious metals sector is underway and that its biggest part is likely just ahead. Regardless of the recent upswing in the PMs and miners.
It seems that our profits from the short positions are going to become truly epic in the following weeks.
After the sell-off (that takes gold to about $1,350 - $1,500), I expect the precious metals to rally significantly. The final part of the decline might take as little as 1-5 weeks, so it's important to stay alert to any changes.
Most importantly, please stay healthy and safe. We made a lot of money last March and this March, and it seems that we’re about to make much more on the upcoming decline, but you have to be healthy to enjoy the results.
As always, we'll keep you - our subscribers - informed.
By the way, we’re currently providing you with the possibility to extend your subscription by a year, two years or even three years with a special 20% discount. This discount can be applied right away, without the need to wait for your next renewal – if you choose to secure your premium access and complete the payment upfront. The boring time in the PMs is definitely over, and the time to pay close attention to the market is here. Naturally, it’s your capital, and the choice is up to you, but it seems that it might be a good idea to secure more premium access now while saving 20% at the same time. Our support team will be happy to assist you in the above-described upgrade at preferential terms – if you’d like to proceed, please contact us.
To summarize:
Trading capital (supplementary part of the portfolio; our opinion): Full speculative short positions (300% of the full position) in mining stocks are justified from the risk to reward point of view with the following binding exit profit-take price levels:
Mining stocks (price levels for the GDXJ ETF): binding profit-take exit price: $35.73; stop-loss: none (the volatility is too big to justify a stop-loss order in case of this particular trade)
Alternatively, if one seeks leverage, we’re providing the binding profit-take levels for the JDST (2x leveraged) and GDXD (3x leveraged – which is not suggested for most traders/investors due to the significant leverage). The binding profit-take level for the JDST: $16.96; stop-loss for the JDST: none (the volatility is too big to justify a SL order in case of this particular trade); binding profit-take level for the GDXD: $35.46; stop-loss for the GDXD: none (the volatility is too big to justify a SL order in case of this particular trade).
For-your-information targets (our opinion; we continue to think that mining stocks are the preferred way of taking advantage of the upcoming price move, but if for whatever reason one wants / has to use silver or gold for this trade, we are providing the details anyway.):
Silver futures upside profit-take exit price: unclear at this time - initially, it might be a good idea to exit, when gold moves to $1,683
Gold futures upside profit-take exit price: $1,683
HGD.TO – alternative (Canadian) inverse 2x leveraged gold stocks ETF – the upside profit-take exit price: $11.38
Long-term capital (core part of the portfolio; our opinion): No positions (in other words: cash
Insurance capital (core part of the portfolio; our opinion): Full position
Whether you already subscribed or not, we encourage you to find out how to make the most of our alerts and read our replies to the most common alert-and-gold-trading-related-questions.
Please note that we describe the situation for the day that the alert is posted in the trading section. In other words, if we are writing about a speculative position, it means that it is up-to-date on the day it was posted. We are also featuring the initial target prices to decide whether keeping a position on a given day is in tune with your approach (some moves are too small for medium-term traders, and some might appear too big for day-traders).
Additionally, you might want to read why our stop-loss orders are usually relatively far from the current price.
Please note that a full position doesn't mean using all of the capital for a given trade. You will find details on our thoughts on gold portfolio structuring in the Key Insights section on our website.
As a reminder - "initial target price" means exactly that - an "initial" one. It's not a price level at which we suggest closing positions. If this becomes the case (like it did in the previous trade), we will refer to these levels as levels of exit orders (exactly as we've done previously). Stop-loss levels, however, are naturally not "initial", but something that, in our opinion, might be entered as an order.
Since it is impossible to synchronize target prices and stop-loss levels for all the ETFs and ETNs with the main markets that we provide these levels for (gold, silver and mining stocks - the GDX ETF), the stop-loss levels and target prices for other ETNs and ETF (among other: UGL, GLL, AGQ, ZSL, NUGT, DUST, JNUG, JDST) are provided as supplementary, and not as "final". This means that if a stop-loss or a target level is reached for any of the "additional instruments" (GLL for instance), but not for the "main instrument" (gold in this case), we will view positions in both gold and GLL as still open and the stop-loss for GLL would have to be moved lower. On the other hand, if gold moves to a stop-loss level but GLL doesn't, then we will view both positions (in gold and GLL) as closed. In other words, since it's not possible to be 100% certain that each related instrument moves to a given level when the underlying instrument does, we can't provide levels that would be binding. The levels that we do provide are our best estimate of the levels that will correspond to the levels in the underlying assets, but it will be the underlying assets that one will need to focus on regarding the signs pointing to closing a given position or keeping it open. We might adjust the levels in the "additional instruments" without adjusting the levels in the "main instruments", which will simply mean that we have improved our estimation of these levels, not that we changed our outlook on the markets. We are already working on a tool that would update these levels daily for the most popular ETFs, ETNs and individual mining stocks.
Our preferred ways to invest in and to trade gold along with the reasoning can be found in the how to buy gold section. Furthermore, our preferred ETFs and ETNs can be found in our Gold & Silver ETF Ranking.
As a reminder, Gold & Silver Trading Alerts are posted before or on each trading day (we usually post them before the opening bell, but we don't promise doing that each day). If there's anything urgent, we will send you an additional small alert before posting the main one.
Thank you.
Przemyslaw Radomski, CFA
Founder, Editor-in-chief

