

Briefly: in our opinion, full (300% of the regular position size) speculative short positions in mining stocks are justified from the risk/reward point of view at the moment of publishing this Alert.
I previously wrote that gold had likely topped even if the USD Index was to decline a bit more. And, well, gold declined regardless of the USD’s small decline. What does this tell us? It says that the medium-term decline in the precious metals sector remains on schedule, and what we witnessed recently was nothing more than a counter-trend pause.
Let’s start today’s journey through charts with the USD Index and a quote from the previous analyses.
I previously commented on the above chart in the following way:
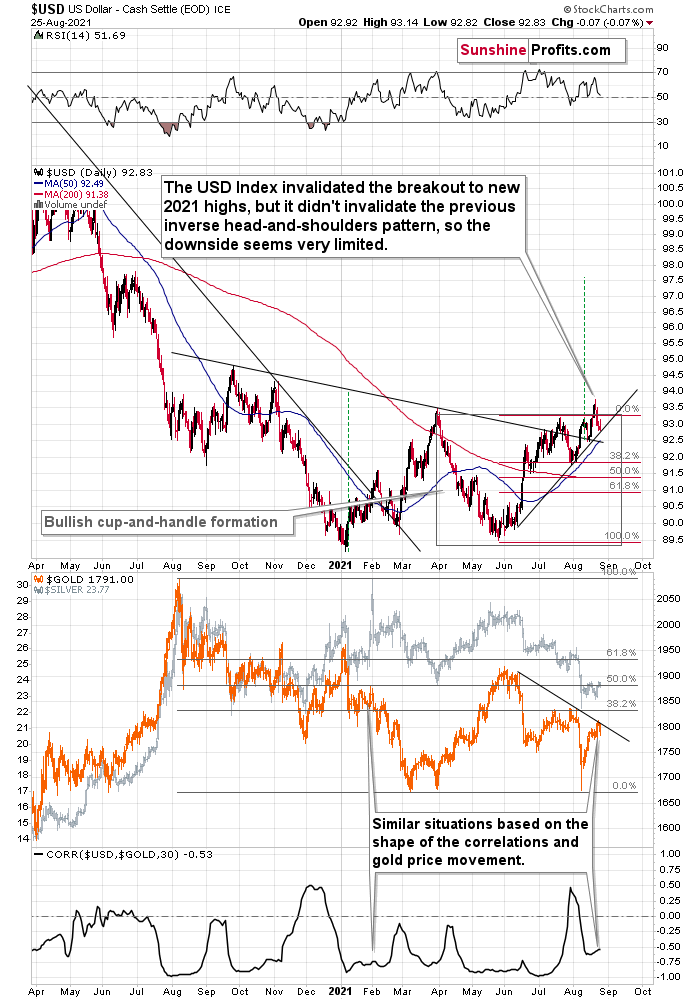
The USD Index invalidated the breakout to new 2021 highs, but it didn't invalidate the previous inverse head-and-shoulders pattern, so the downside seems very limited.
There’s a rising short-term support line based on the June and July lows that currently “says” that the USD Index is unlikely to fall below ~92.75. At the moment of writing these words, the USD Index is trading at about 93.07, so it’s very close to above-mentioned level.
And even if the USDX declines below it, there’s support at about 92.5 provided by the neck level of the previously confirmed inverse head-and-shoulders pattern. This means that the USDX is unlikely to decline below this level, and this in turn means that the downside seems to be limited to about 0.6 index point. That’s not a lot.
Remember when the USD Index previously invalidated the breakout above the inverse H&S pattern? I wrote then that it could decline to the nearest support level provided – then – by the 38.2% Fibonacci retracement. Now the nearest support is provided by the rising support line at about 92.75.
This doesn’t mean that gold will necessarily rally from here or that the rally will be substantial. On the lower part of the above chart, you can see that gold moved to its declining resistance line, which means that it could decline right away.
The USD Index didn’t move to the above-mentioned rising support line, but it was very close to it. The USD Index has been relatively flat so far today, but gold is already down, so it seems that even if the USD Index bottoms slightly lower, it might not take gold to new short-term highs.
Now I’m Not Doing It!
Based on today’s pre-market trading, it seems that we can view the rising support line as having been reached, and thus we can expect the upswing to continue.
Please note that the USD Index was down yesterday by 0.07, which is not a lot, but enough to make gold rally… if gold wanted to rally, that is.
But gold didn’t really want to rally, so it didn’t. Gold appears to have completed its counter-trend upswing, and it seems that it’s ready for another downswing.
Moreover, gold was down yesterday, and it’s down in today’s pre-market trading as well.
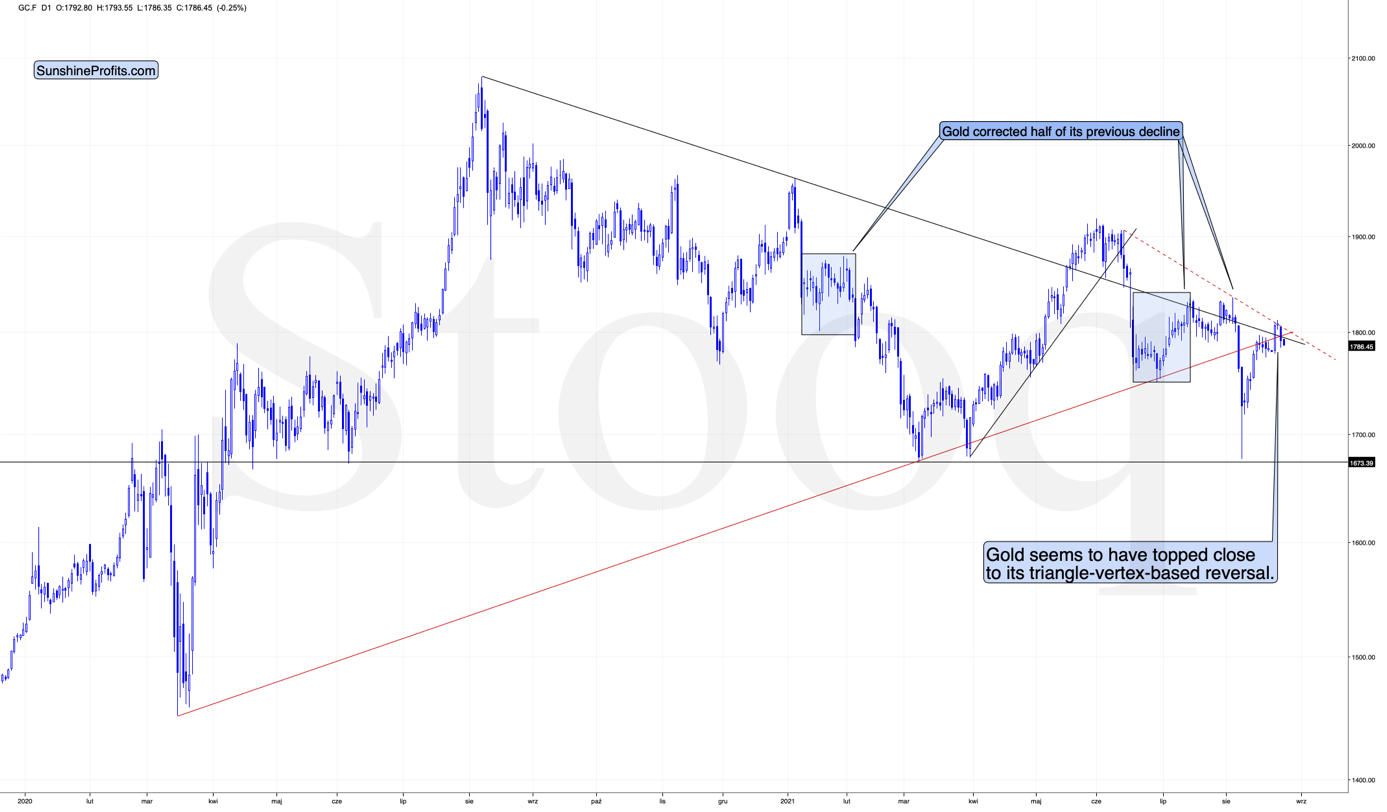
On Tuesday, based on Monday’s rally, I wrote the following:
The combination of the resistance line being reached with the fact that gold did that right on its reversal day indicated by the triangle’s vertex makes it even more likely that gold will reverse its course shortly.
We can see the same thing – gold moving to its resistance line – also when we look at its performance through its most popular proxy – the GLD ETF.
In this case, we can compare where gold rallied to where the mining stocks (the GDX ETF) rallied. And while the GLD moved to its declining resistance line, the GDX ETF was not even close to its analogous dashed declining resistance line.
Instead, the GDX ETF moved back to its previously broken neckline of the head and shoulders pattern and closed slightly below it.
This is more important than comparing the GDX’s closing price to its previous yearly low — it closed slightly above it.
Here’s the chart I described above:
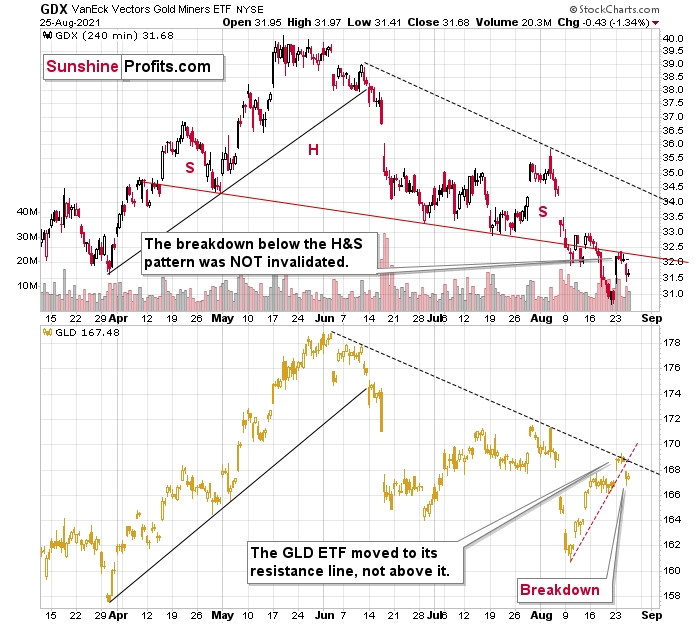
As you can see, that’s more or less what happened. Gold reversed course at the turning point and the declining resistance line, while mining stocks simply verified the breakdown below their April – August head and shoulders pattern. What’s more, the GLD ETF already broke below its rising red support line. That’s almost as bearish as it gets. Almost, because the breakdown in gold is not yet confirmed. Still, since gold underperformed the USDX in the last few days, it seems that the breakdown is valid.
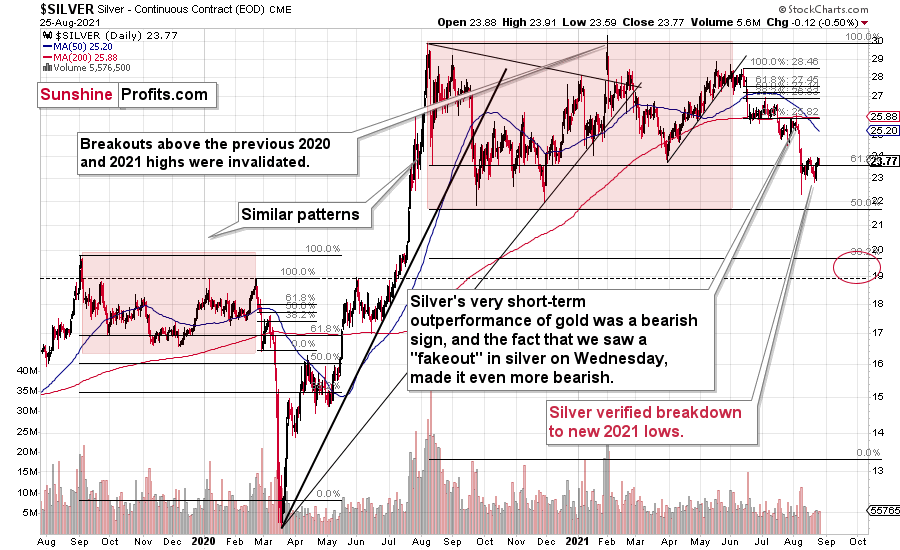
Silver moved a bit lower recently, but it’s still relatively close to its most recent short-term high. It didn’t invalidate the breakdown below its previous 2021 lows, but I would like to warn you that silver might attempt to stage a fake breakout before sliding. We saw this kind of performance in early August, and we can (but don’t have to) see it once again. So, if silver rallies here while gold and miners don’t, it will most likely not be a bullish signal but rather a bearish confirmation.
All in all, it seems that the precious metals sector is ready for another sizable decline.
Having said that, let’s take a look at the markets from a more fundamental angle.
Preparing for Powell
With Jerome Powell, Chairman of the U.S. Federal Reserve (Fed), taking center stage on Aug. 27, the Jackson Hole Economic Symposium could make-or-break investors’ near-term optimism. On one hand, the disruptions from the Delta variant provide Powell with a clear pathway to remain dovish for longer. As such, the consensus expects a snoozer of an event.
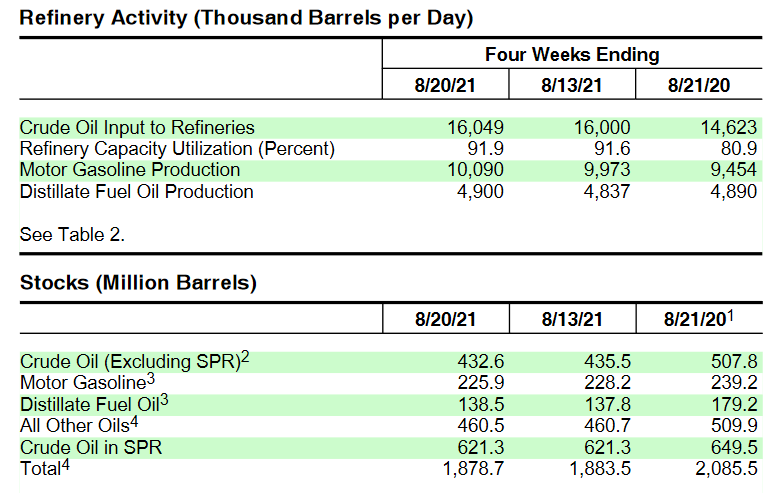
On the other hand, while Powell’s patience will likely be on full display, the U.S. economy is forging ahead amid the Delta surge. And with the latest coronavirus strain likely already past its peak, renewed economic momentum should keep the pressure on Powell in the coming months. Case in point: the U.S. Energy Information Administration (EIA) revealed on Aug. 25 that U.S. crude inventories declined by 3.0 million barrels week-over-week (WoW), while motor gasoline inventories decreased by 2.2 million barrels. Similarly, crude oil input to refineries actually increased WoW and refiners’ capacity utilization rose from 91.6% to 91.9%.
(Speaking of oil, I encourage you to check out one of the latest analyses that we posted on crude oil – about proxies that one can use to profit from it; also, here’s a more recent technical analysis of this market, if you’re interested.)
The bottom line? With fuel demand a leading indicator of mobility, U.S. citizens haven’t hunkered down amid the Delta’s spread.
Please see below:
 Source: EIA
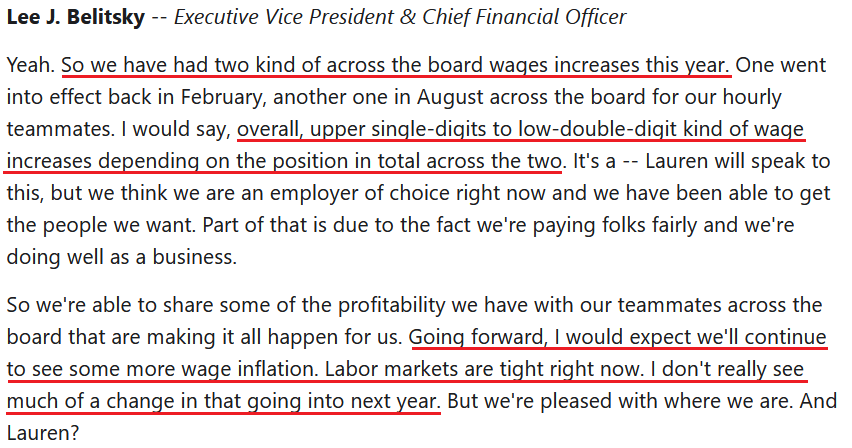
In addition, Dick's Sporting Goods – an American sports gear, equipment, apparel and footwear retailer – crushed Wall Street’s second-quarter earnings estimates on Aug. 25, and the management raised their full-year guidance as well. CEO Lauren R. Hobart said that “consumer demand, as we've talked about, is still very, very strong. So that keeps us excited about the holiday season.” And right on cue, the inflationary merry-go-round turned once again. “We've taken certain price increases primarily in hardlines categories over the course of the year this year,” said CFO Lee J. Belitsky…. We were able to pass through selective price increases to cover higher supply chain and input costs and saw a favorable sales mix.”
And what about wage inflation?
 Source: Dick's Sporting Goods/The Motley Fool
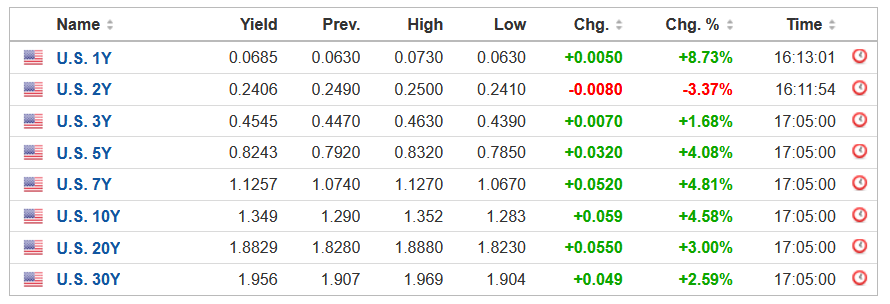
Moreover, while the wheels are in motion, U.S. Treasury yields resumed their climb on Aug. 25. And with gold mining stocks suffering another sharp drawdown even while the USD Index remains idle, the double-edged sword poses significant problems for the PMs. For example, when the USD Index languished at the beginning of 2021, surging U.S. Treasury yields hammered the PMs. Conversely, when U.S. Treasury yields suffered mightily in June, a resurgent USD Index made its presence felt. As a result, with the PMs demonstrating strong negative correlations with both variables, rising U.S. Treasury yields have once again spoiled the PMs’ party.
Please see below:
 Source: Investing.com
Reliable USD Fundamentals
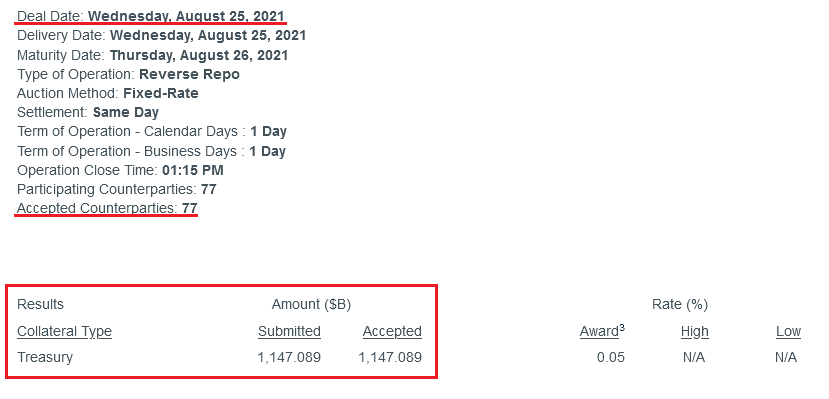
As for the USD Index, while the dollar awaits the results of Powell’s presser, the greenback’s relative fundamentals remain robust. For example, with the Fed’s daily reverse repurchase agreements hitting another all-time high on Aug. 25, 77 counterparties siphoned more than $1.147 trillion out of the U.S. financial system.
Please see below:
 Source: New York Fed
To explain, a reverse repurchase agreement (repo) occurs when an institution offloads cash to the FED in exchange for a Treasury security (on an overnight or short-term basis). And with U.S. financial institutions currently flooded with excess liquidity, they’re shipping cash to the FED at an alarming rate. And while I’ve been warning for months that the activity is the fundamental equivalent of a taper – due to the lower supply of U.S. dollars (which is bullish for the USD Index) – the psychological effect is not the same. However, as we await a formal announcement from the Fed, the U.S. dollar’s fundamental foundation remains quite strong.
As further evidence, while non-commercial (speculative) futures traders have slightly trimmed their net-long positions, asset managers and leveraged funds’ allocation to the U.S. dollar continue to make new 2021 highs.
Please see below:
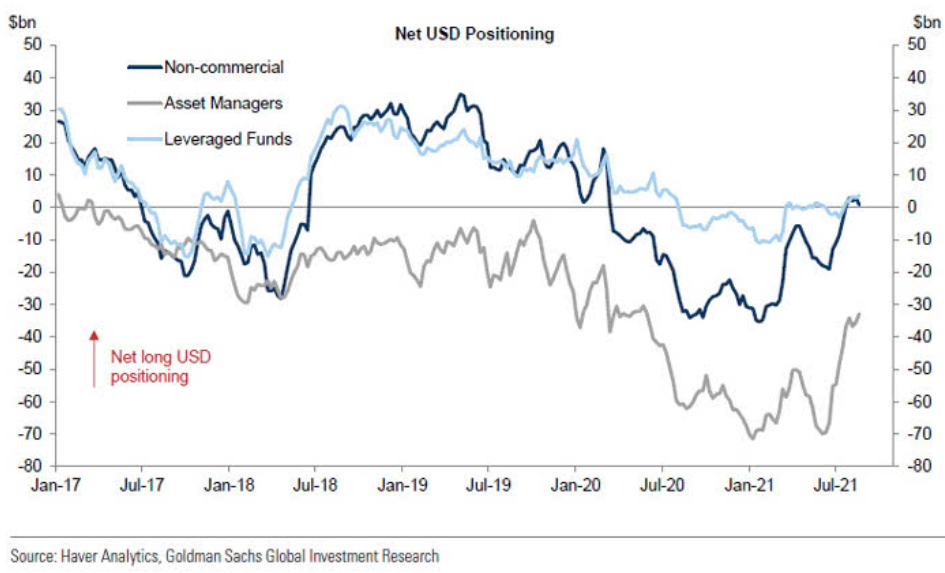
To explain, the dark blue, gray and light blue lines above represent net-long positions of non-commercial (speculative) futures traders, asset managers and leveraged funds. When the lines are falling, it means that the trio have reduced their net-long positions and are expecting a weaker U.S. dollar. Conversely, when the lines are rising, it means that the trio have increased their net-long positions and are expecting a stronger U.S. dollar. And if you analyze the right side of the chart, you can see that the latter two upped their bullish bets last week. As a result, a continuation of the theme will likely negatively impact the PMs’ medium-term performance.
Likewise, not only are U.S. growth expectations drastically outperforming the Eurozone – remember, the EUR/USD accounts for nearly 58% of the movement of the USD Index – but U.S. growth expectations are also outperforming the regions’ G9 peers.
Please see below:
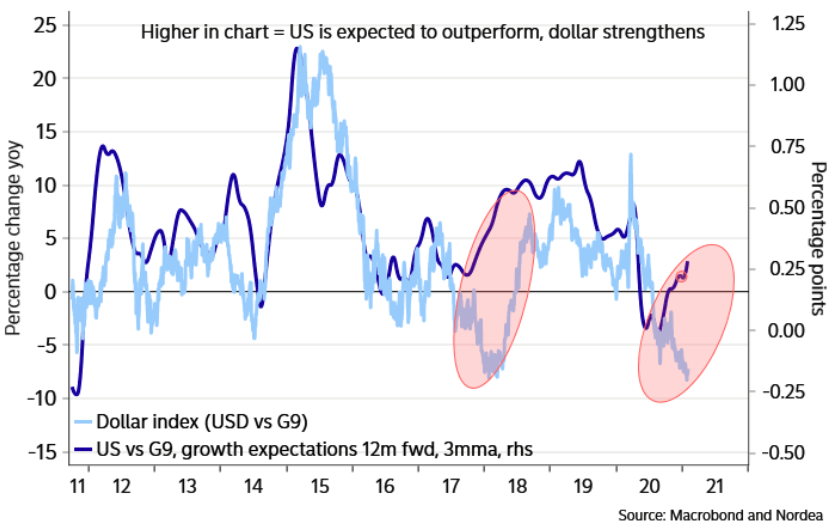
To explain, the light blue line above tracks the year-over-year (YoY) percentage change in the USD Index, while the dark blue line above tracks the spread between the U.S. and G9 countries’ relative growth expectations. As you can see, the USD Index tends to rise when U.S. growth prospects outperform G9 countries and tends to fall when G9 countries’ growth prospects outperform the U.S. More importantly, though, when a material divergence materialized in 2017-2018, the USD Index shot sharply higher and violently closed the gap. And with a similar gap present on the right side of the chart, another convergence could severely impact the PMs.
Soaring Hawks
On top of that, while Jackson Hole may not produce any fireworks, the coming months should elicit plenty of drama. Case in point: with a hawkish Fed now the consensus, officials’ internal division rivals the 2013 taper tantrum.
Please see below:
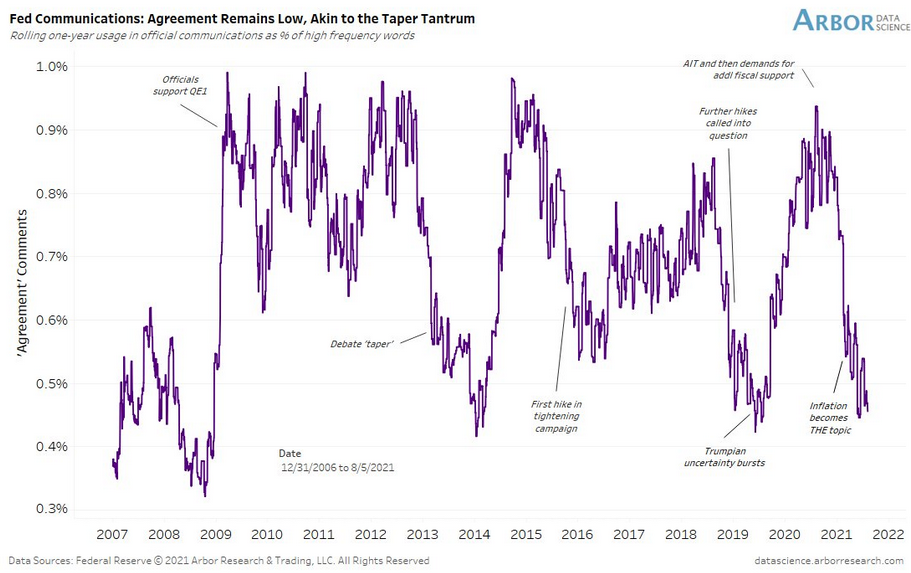
To explain, Arbor Data Science tracked Fed officials’ “words of agreement” during various speaking arrangements. When the purple line is rising, it means that Fed officials all support the same narrative. Conversely, when the purple line is falling, it means that FED officials are sending conflicting signals. If you focus your attention on the right side of the chart, you can see that divergent rhetoric is now at its highest level since the taper tantrum in 2013 (that’s yet another point for the extremely bearish 2013-now analogy) and when the Fed reversed course in 2019 following a barrage of interest rate hikes (depicted by the purple lines being extremely low). As a result, with prior dispersions preceding material shifts in monetary policy, the Delta variant is unlikely to change the medium-term trend.
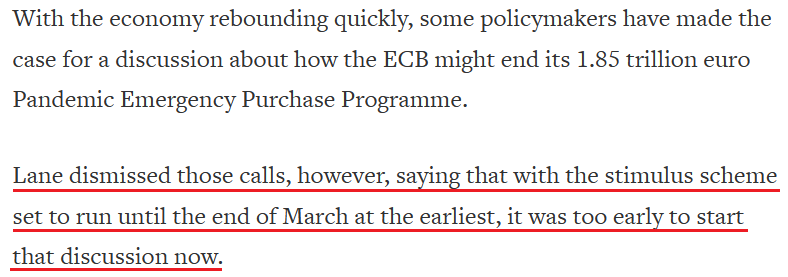
Finally, with the EUR/USD the most important currency pair influencing the USD Index, the European Central Bank’s (ECB) behavior is extremely important. And with the doves owning the day on Aug. 25, ECB Chief Economist Philip Lane said:
“Regardless of when PEPP might end, that’s not the end of the ECB’s role in terms of QE. This is why we don’t need a huge lead time to think about it. We already know what we’re doing until March, which is maintaining favorable financing conditions, so we have time this autumn to work out what comes next.”
And what does this mean for a prospective taper announcement?
 Source: Reuters
The bottom line? While I’ve been warning for months that the Fed and the ECB are worlds apart, again, the latter is poised to remain dovish for longer. And with the EUR/USD accounting for nearly 58% of the movement of the USD Index, how can the dollar index die if the euro can’t fly?
In conclusion, the PMs went from euphoria through caution to pessimism in the span of three days. And while Powell could talk down the U.S. dollar and uplift the PMs during his speech on Aug. 27, history has shown that the short-term sugar highs fade rather quickly. Moreover, with strong fundamentals underpinning assets that are negatively correlated with the PMs – like the USD Index and U.S. Treasury yields – the GDXJ ETF is unlikely to gain any real traction if the current trends persist (instead, it’s likely to tumble, further increasing our profits on the short positions in it). As a result, while we remain strong believers in the PMs’ long-term potential, their medium-term outlooks remain quite treacherous.
Overview of the Upcoming Part of the Decline
- The corrective upswing in gold is over, and the big decline seems to be already underway.
- It seems that the first stop for gold will be close to its previous 2021 lows, slightly below $1,700. Then it will likely correct a bit, but it’s unclear if I want to exit or reverse the current short position based on that – it depends on the number and the nature of the bullish indications that we get at that time.
- After the above-mentioned correction, we’re likely to see a powerful slide, perhaps close to the 2020 low ($1,450 - $1,500).
- If we see a situation where miners slide in a meaningful and volatile way while silver doesn’t (it just declines moderately), I plan to switch from short positions in miners to short positions in silver. At this time, it’s too early to say at what price levels this could take place, and if we get this kind of opportunity at all – perhaps with gold close to $1,600.
- I plan to exit all remaining short positions when gold shows substantial strength relative to the USD Index while the latter is still rallying. This might take place with gold close to $1,350 - $1,400. I expect silver to fall the hardest in the final part of the move. This moment (when gold performs very strongly against the rallying USD and miners are strong relative to gold after its substantial decline) is likely to be the best entry point for long-term investments, in my view. This might also happen with gold close to $1,375, but it’s too early to say with certainty at this time. I expect the final bottom to take place near the end of the year, perhaps in mid-December.
- As a confirmation for the above, I will use the (upcoming or perhaps we have already seen it?) top in the general stock market as the starting point for the three-month countdown. The reason is that after the 1929 top, gold miners declined for about three months after the general stock market started to slide. We also saw some confirmations of this theory based on the analogy to 2008. All in all, the precious metals sector is likely to bottom about three months after the general stock market tops.
- The above is based on the information available today, and it might change in the following days/weeks.
Please note that the above timing details are relatively broad and “for general overview only” – so that you know more or less what I think and how volatile I think the moves are likely to be – on an approximate basis. These time targets are not binding or clear enough for me to think that they should be used for purchasing options, warrants or similar instruments.
Letters to the Editor
Q: PR, First, I would like to thank you again for your reports, your attention to detail and interdependence of market components. My question: could you help with clarification on the short-term exit with gold at $1683 - "Gold futures upside profit-take exit price: $1,683". Will you go long on gold briefly and then reverse to a short position during the short-term bounce? How much of an increase of gold’s value is possible before reentering the short position?
A: Thanks for the compliments – I appreciate them a lot. With regard to the sentence that you’re quoting, I just removed the “upside” word from it to avoid confusion. To further clarify: I don’t hold a short position in gold – I hold a short position in junior mining stocks (and not in gold, nor in silver). I’m using the JDST for this trade myself (which does not mean that you should also use it, as your requirements regarding leverage might be different). I’m featuring the ideas regarding potential short positions in gold and silver simply because it was requested, as some people can’t or don’t want to short the junior mining stocks for whatever reason.
Having said that, I don’t have a clearly defined plan to go long gold once I close the short position in the junior mining stocks and take profits from this trade, or when gold reaches its previous 2021 lows. It’s a big “maybe”. If we get a combination of multiple bullish indications at the same time, I might go long, after all. But if it’s just moderately bullish, I’ll probably not get into a long position. And if the situation is neutral or just somewhat bullish, I might stick to the short position entirely and not adjust it at all. Why?
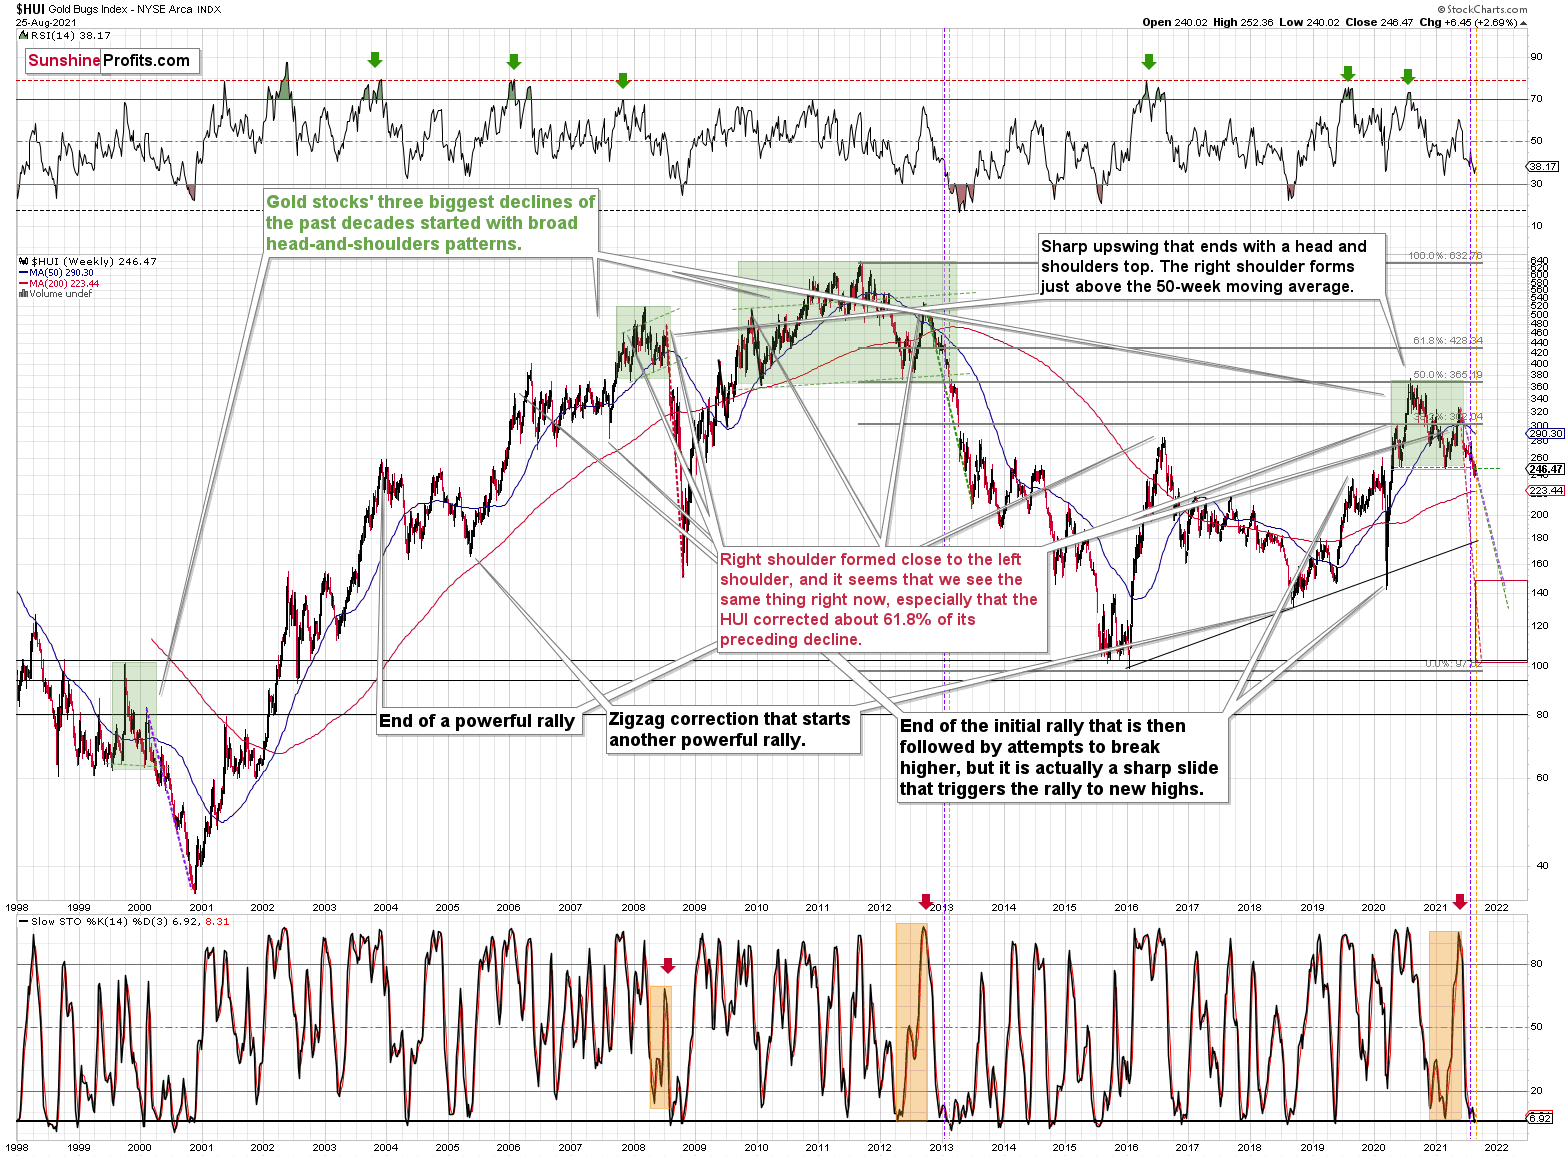
Can you see the sizable upswings during the 2013 slide in the HUI Index? You can’t because they were so tiny. Instead, you see an enormous decline that it would have been great to profit from. We’re in a situation that’s very similar to 2013 in many ways, so the first priority here – in my view – is not to miss the enormous profits from the enormous slide. If we miss a small (compared to the entire move lower) counter-trend rally, it won’t really matter much. But if we miss just one key day of the decline, we might regret it.
So, again, going long when gold moves to its previous 2021 lows is a “maybe” and not a “clear plan”.
There’s also the possibility that I will choose to short bitcoin instead of (or along with) going long PMs when the latter are likely to correct.
Q: Thanks for your analysis, it stands out to me at the moment (as usual). Maybe I made a good decision to listen to a qualified market professional rather than to the noise out there. I was struggling to understand your analysis initially, but now it’s a smooth ride. Apart from short-, medium- and long-term analysis, which helps me a lot, I would like to see your support and resistance zones to better manage my risk. Could you publish a chart showing where the price is headed in short, medium and long term? The levels for gold will help me a lot to manage my trade better - both upside and downside.
A: Thanks, I’m very happy to see that you’re enjoying my analyses.
It will be difficult to provide you with all possible support / resistance levels, as there are so many, and because I might look at other markets (or their relationships with each other – their relative performance) for indications to open/close trading positions. However, here’s a chart providing my short-term, medium-term and long-term targets for gold.
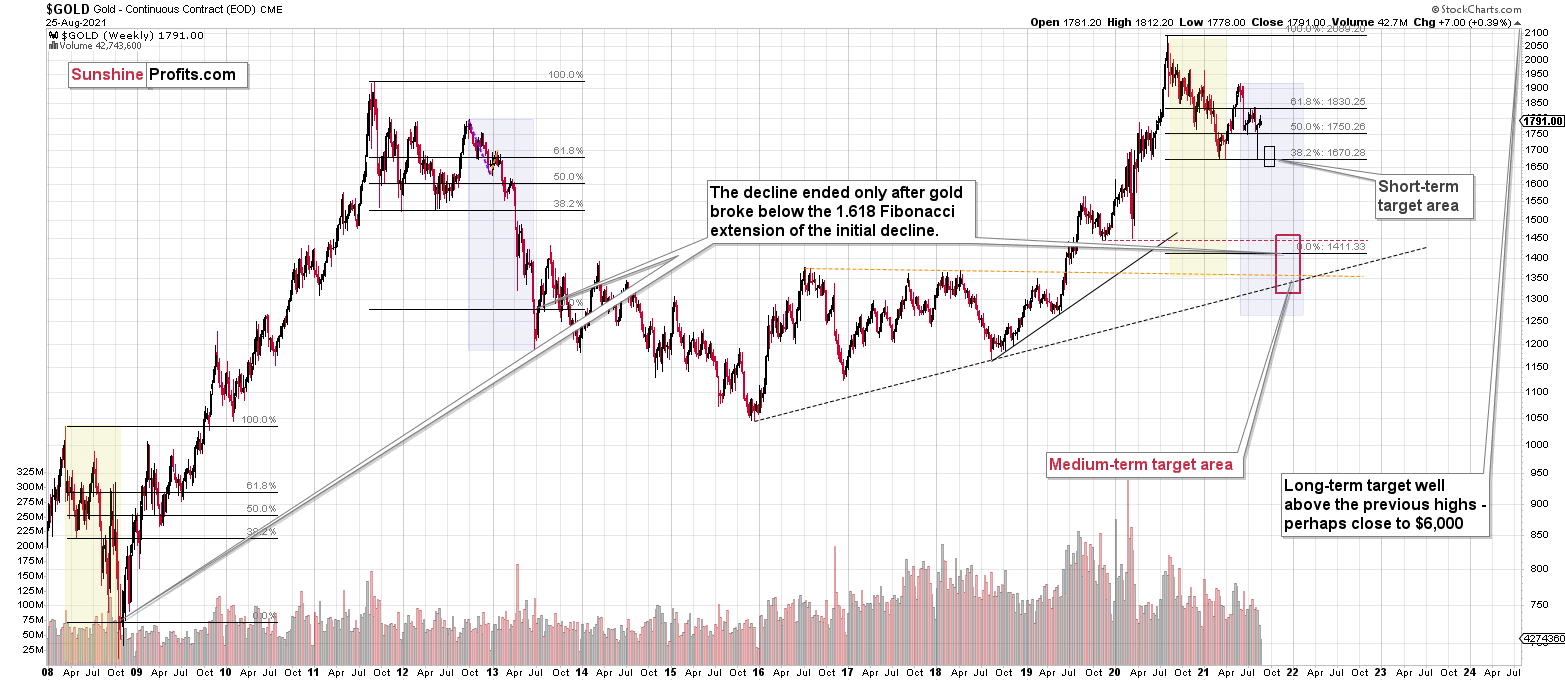
In the short term, I think that gold is going to fall to its 2021 lows and then bounce. After the (not so significant) rebound, it’s likely to fall more profoundly to the target marked with red.
It is quite possible that gold will first decline to its 2020 lows, then correct in a relatively volatile manner and then decline once again – to its true bottom, close to the $1,350 level.
Please note that the above-mentioned performance would be in tune with what happened in 2013 and 2008. In both cases, there was a volatile comeback right before the very final part of the decline. And – what’s particularly interesting – in both cases gold didn’t form the final bottom until it declined below the 1.618 Fibonacci extension based on its first sizable decline. This extension points to ~$1,411, so if the history is to repeat itself, gold will need to decline below that level. And the nearest strong support is at about $1,350.
Please note that I’ve updated the “Overview of the Upcoming Part of the Decline” section based on the above.
Q: PR, I appreciate the candor in your analysis and the rationale for your opinions.
Two questions:
1) This was asked by another subscriber, but do you anticipate adjusting your take-profit price of the JDST? For a number of months, the target was about $36, then your target changed to $15.96, and now it’s $16.96. Under what circumstances would you move the target price higher, and if you were to, would it be to the $36 target?
2) The slow stochastic graphs for the HUI, GDX, and, when you include it, the GDXJ, appear to be at different inflexion points. Do they have to be consistent for you to solidify your position of either a move up or down?
Thanks again for your patience in answering.
A: Thank you, I’m happy to provide my answers and help you take advantage of this opportunity.
- The current take-profit level for the JDST (and GDXJ) is based just on the upcoming move to the previous 2021 lows in gold. When this part of the decline is over and we take (already big) profits off the table, it’s a tough call (currently) to say if I will immediately re-enter the short position, wait a bit, or go long PMs. It depends, and I discussed it more thoroughly in the first of today’s replies. In all three of the above-mentioned cases, though, I expect to return to the short position in the junior mining stocks after the rebound/pause. The price target might once again be about $36 in the case of the JDST, or it might be lower, or it might be even higher. IF the GDXJ declined from here to $20 (approximately matching its 2020 low) over the next 60 trading days, and it did so by declining the same percentage amount each trading day, then the JDST would be likely to rally to about $52.5. But that’s very imprecise because the way we get there will likely not be evenly distributed (the daily declines won’t be identical in all likelihood). Moreover, if we’re lucky and we get a day when miners truly plunge while silver declines just a little, then we’ll likely exit the short positions in the miners and enter short positions in silver, as at that moment silver will most likely offer greater downside potential. In this case, we would not participate in the final part of miners’ downswing, but in the final part of silver’s downswing.
- The stochastic indicators can be very different on the charts that I feature because I’m using charts based on different candlesticks. Most of them are based on daily candlesticks, but some are based on weekly candlesticks, some on monthly ones, and some are based on more short-term candlesticks, like today’s GDX and GLD chart that’s based on 4-hour candlesticks. If a given signal from a given indicator is confirmed by more aligned markets, it does become stronger. However, I’m looking at many more indications, and I’m applying many more techniques than just the stochastic indicators. And if the indicator doesn’t work from a given perspective, it’s best to ignore its indications – simple as that. So, I wouldn’t say that it would be enough to change the outlook for anything if I got the same kind of indication from all versions of the stochastic indicator.. Other factors need to be taken into account as well.
Summary
To summarize, the medium- and short-term outlooks for the precious metals sector remain down. The breakdown to new yearly lows in the HUI Index and to new yearly highs in the USD Index serve as profound confirmations that a huge downswing in the precious metals sector is underway and that its biggest part is likely just ahead. Regardless of the recent upswing in the PMs and miners.
It seems that our profits from the short positions are going to become truly epic in the following weeks.
After the sell-off (that takes gold to about $1,350 - $1,500), I expect the precious metals to rally significantly. The final part of the decline might take as little as 1-5 weeks, so it's important to stay alert to any changes.
Most importantly, please stay healthy and safe. We made a lot of money last March and this March, and it seems that we’re about to make much more on the upcoming decline, but you have to be healthy to enjoy the results.
As always, we'll keep you - our subscribers - informed.
By the way, we’re currently providing you with the possibility to extend your subscription by a year, two years or even three years with a special 20% discount. This discount can be applied right away, without the need to wait for your next renewal – if you choose to secure your premium access and complete the payment upfront. The boring time in the PMs is definitely over, and the time to pay close attention to the market is here. Naturally, it’s your capital, and the choice is up to you, but it seems that it might be a good idea to secure more premium access now while saving 20% at the same time. Our support team will be happy to assist you in the above-described upgrade at preferential terms – if you’d like to proceed, please contact us.
To summarize:
Trading capital (supplementary part of the portfolio; our opinion): Full speculative short positions (300% of the full position) in mining stocks are justified from the risk to reward point of view with the following binding exit profit-take price levels:
Mining stocks (price levels for the GDXJ ETF): binding profit-take exit price: $35.73; stop-loss: none (the volatility is too big to justify a stop-loss order in case of this particular trade)
Alternatively, if one seeks leverage, we’re providing the binding profit-take levels for the JDST (2x leveraged) and GDXD (3x leveraged – which is not suggested for most traders/investors due to the significant leverage). The binding profit-take level for the JDST: $16.96; stop-loss for the JDST: none (the volatility is too big to justify a SL order in case of this particular trade); binding profit-take level for the GDXD: $35.46; stop-loss for the GDXD: none (the volatility is too big to justify a SL order in case of this particular trade).
For-your-information targets (our opinion; we continue to think that mining stocks are the preferred way of taking advantage of the upcoming price move, but if for whatever reason one wants / has to use silver or gold for this trade, we are providing the details anyway.):
Silver futures upside profit-take exit price: unclear at this time - initially, it might be a good idea to exit, when gold moves to $1,683
Gold futures upside profit-take exit price: $1,683
HGD.TO – alternative (Canadian) inverse 2x leveraged gold stocks ETF – the upside profit-take exit price: $11.38
Long-term capital (core part of the portfolio; our opinion): No positions (in other words: cash
Insurance capital (core part of the portfolio; our opinion): Full position
Whether you already subscribed or not, we encourage you to find out how to make the most of our alerts and read our replies to the most common alert-and-gold-trading-related-questions.
Please note that we describe the situation for the day that the alert is posted in the trading section. In other words, if we are writing about a speculative position, it means that it is up-to-date on the day it was posted. We are also featuring the initial target prices to decide whether keeping a position on a given day is in tune with your approach (some moves are too small for medium-term traders, and some might appear too big for day-traders).
Additionally, you might want to read why our stop-loss orders are usually relatively far from the current price.
Please note that a full position doesn't mean using all of the capital for a given trade. You will find details on our thoughts on gold portfolio structuring in the Key Insights section on our website.
As a reminder - "initial target price" means exactly that - an "initial" one. It's not a price level at which we suggest closing positions. If this becomes the case (like it did in the previous trade), we will refer to these levels as levels of exit orders (exactly as we've done previously). Stop-loss levels, however, are naturally not "initial", but something that, in our opinion, might be entered as an order.
Since it is impossible to synchronize target prices and stop-loss levels for all the ETFs and ETNs with the main markets that we provide these levels for (gold, silver and mining stocks - the GDX ETF), the stop-loss levels and target prices for other ETNs and ETF (among other: UGL, GLL, AGQ, ZSL, NUGT, DUST, JNUG, JDST) are provided as supplementary, and not as "final". This means that if a stop-loss or a target level is reached for any of the "additional instruments" (GLL for instance), but not for the "main instrument" (gold in this case), we will view positions in both gold and GLL as still open and the stop-loss for GLL would have to be moved lower. On the other hand, if gold moves to a stop-loss level but GLL doesn't, then we will view both positions (in gold and GLL) as closed. In other words, since it's not possible to be 100% certain that each related instrument moves to a given level when the underlying instrument does, we can't provide levels that would be binding. The levels that we do provide are our best estimate of the levels that will correspond to the levels in the underlying assets, but it will be the underlying assets that one will need to focus on regarding the signs pointing to closing a given position or keeping it open. We might adjust the levels in the "additional instruments" without adjusting the levels in the "main instruments", which will simply mean that we have improved our estimation of these levels, not that we changed our outlook on the markets. We are already working on a tool that would update these levels daily for the most popular ETFs, ETNs and individual mining stocks.
Our preferred ways to invest in and to trade gold along with the reasoning can be found in the how to buy gold section. Furthermore, our preferred ETFs and ETNs can be found in our Gold & Silver ETF Ranking.
As a reminder, Gold & Silver Trading Alerts are posted before or on each trading day (we usually post them before the opening bell, but we don't promise doing that each day). If there's anything urgent, we will send you an additional small alert before posting the main one.
Thank you.
Przemyslaw Radomski, CFA
Founder, Editor-in-chief

