

Briefly: in our opinion, full (300% of the regular position size) speculative short positions in mining stocks are justified from the risk/reward point of view at the moment of publishing this Alert.
Gold & silver reversed yesterday (Mar. 2) and the GDX rallied after bottoming right in my previous target area, but it’s still unclear if the bottom is in.
Let’s check what’s happening in the charts.
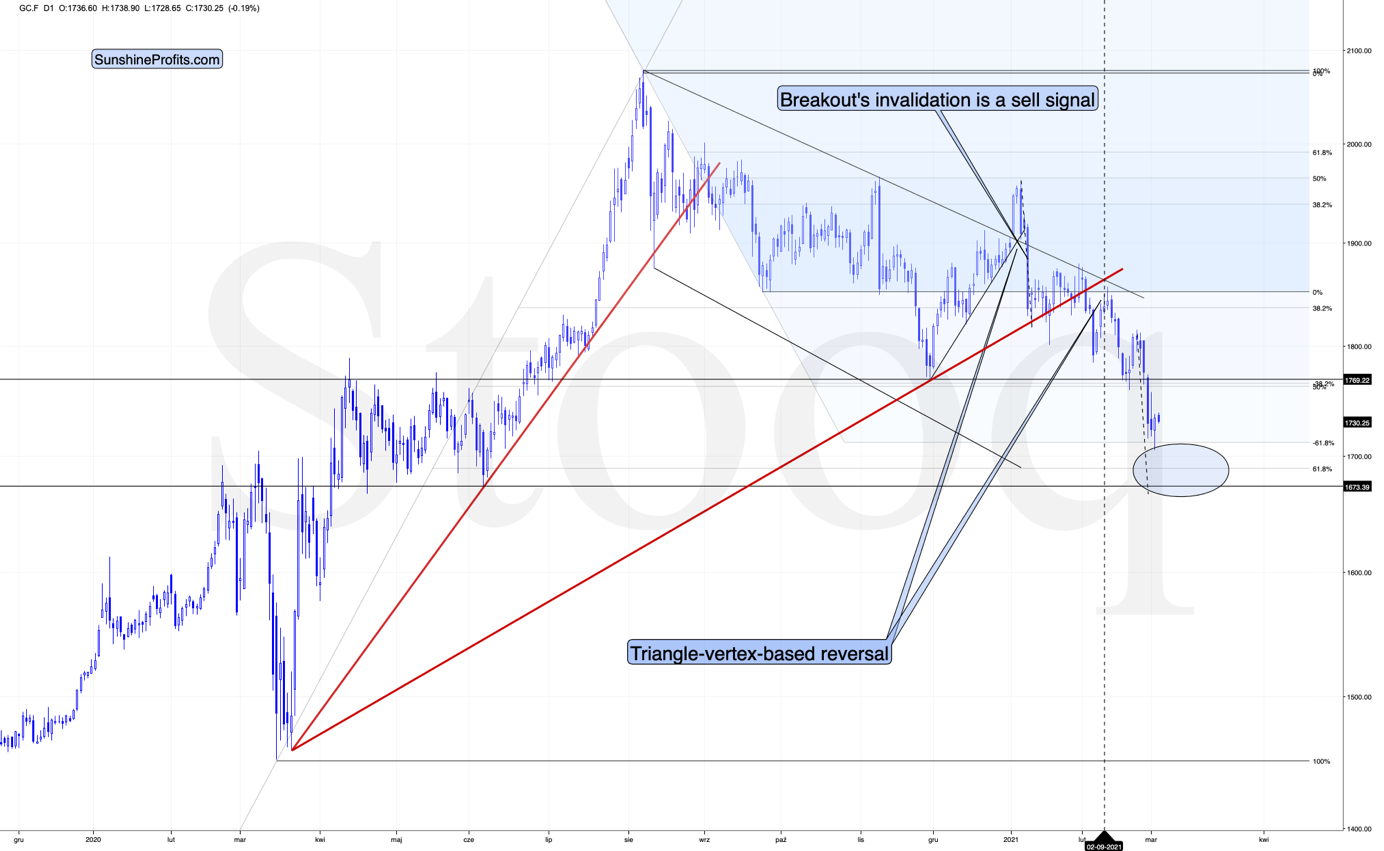
Figure 1 – COMEX Gold Futures (GC.F)
In short, gold reversed yesterday after touching the upper border or my target area. Can the temporary bottom be in? Yes. Is it likely to be in? Not necessarily. Most likely it’s not in yet, because gold still hasn’t moved to its strong support levels.
The size of the first part of the move sometimes tends to be identical or near-identical to the size of the final move. The size of the initial, August decline was almost just like the November decline. Now, copying the January 2021 decline to the current situation (blue, dashed lines), provides us with the target at about $1,675.
The above price area coincides with the previous 2020 lows, and it’s also slightly below the 61.8% Fibonacci retracement based on the entire 2020 upswing. Gold would be likely to at least reach this retracement before forming the temporary bottom.
Consequently, it would not be surprising to see gold suffering another ~$50 decline before finding a short-term bottom. More importantly though, if the initial move lower coincides with an S&P 500 correction, it would be likely to push mining stocks and silver lower in a more visible way.
On the bullish front, the shape of yesterday’s candlestick does indeed look like an intraday reversal. And we saw the same kind of intraday reversal in silver.
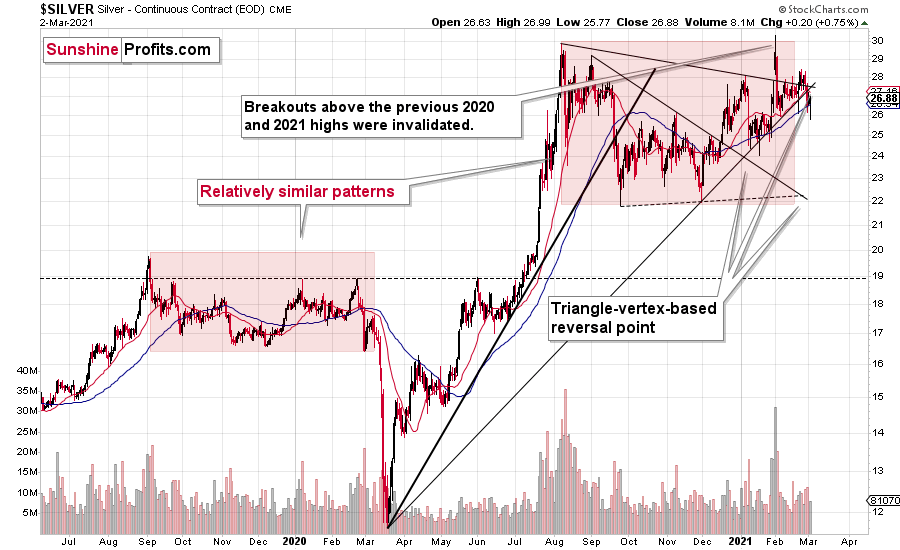
Figure 2 – COMEX Silver Futures
The fact that silver’s triangle-vertex-based reversal is approximately today / was approximately yesterday (it’s unclear) further validates the scenario, in which precious metals move higher in the short term.
I previously wrote that silver is likely to catch up with the decline at its later stage, while miners are likely to lead the way. That’s exactly what we’ve been seeing in the last few months. Silver is still likely to catch up with the declines when silver investors panic – just as they tend to do close to the end of given price moves (selling close to the bottom and buying close to the top). So far, miners remain the asset of choice for trading, but sometime during the next downswing, we might move to silver in order to magnify gains from both declines. As a reminder, please consider what happened on March 13 and March 16, 2020 and consider that the GDX ETF bottomed (in terms of the daily closing prices) on March 13. That was when silver was only in the middle of its decline.
Speaking of mining stocks, let’s take a look at the GDX ETF chart.
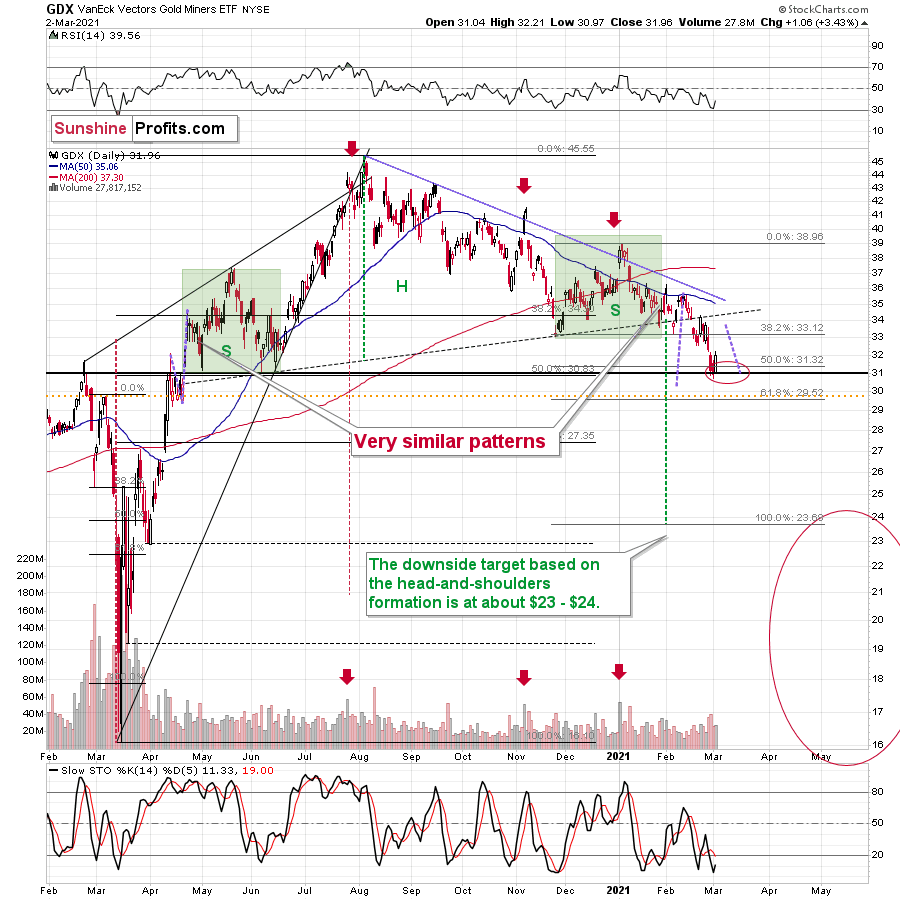
Figure 3 - VanEck Vectors Gold Miners ETF (GDX)
The GDX moved higher shortly after we successfully exited our short positions, relatively close to the bottom. But is this rally about to take miners much higher before they turn south once again? It’s unclear at this time.
It could be the case that we see an immediate move lower once again as gold declines to $1,675 or so, but it could also be the case that miners correct to $33 - $34 now, and then move to new lows later.
All in all, it seems that we are already seeing the corrective upswing, or one is about to start after another very short-term downswing. Once this corrective upswing is over, the downtrend is likely to resume.
Why would this be the case? There are myriads of reasons and I’m going over most of them each week in my flagship Gold & Silver Trading Alerts, but to name just a few, it’s gold’s invalidation of the breakout above its 2011 high, despite having an extremely positive fundamental picture, gold’s weak performance relative to the USD Index, miners’ relatively weak performance compared to gold, and the medium-term breakout in the USDX.
And speaking of the USD Index, let’s take a look at its chart.
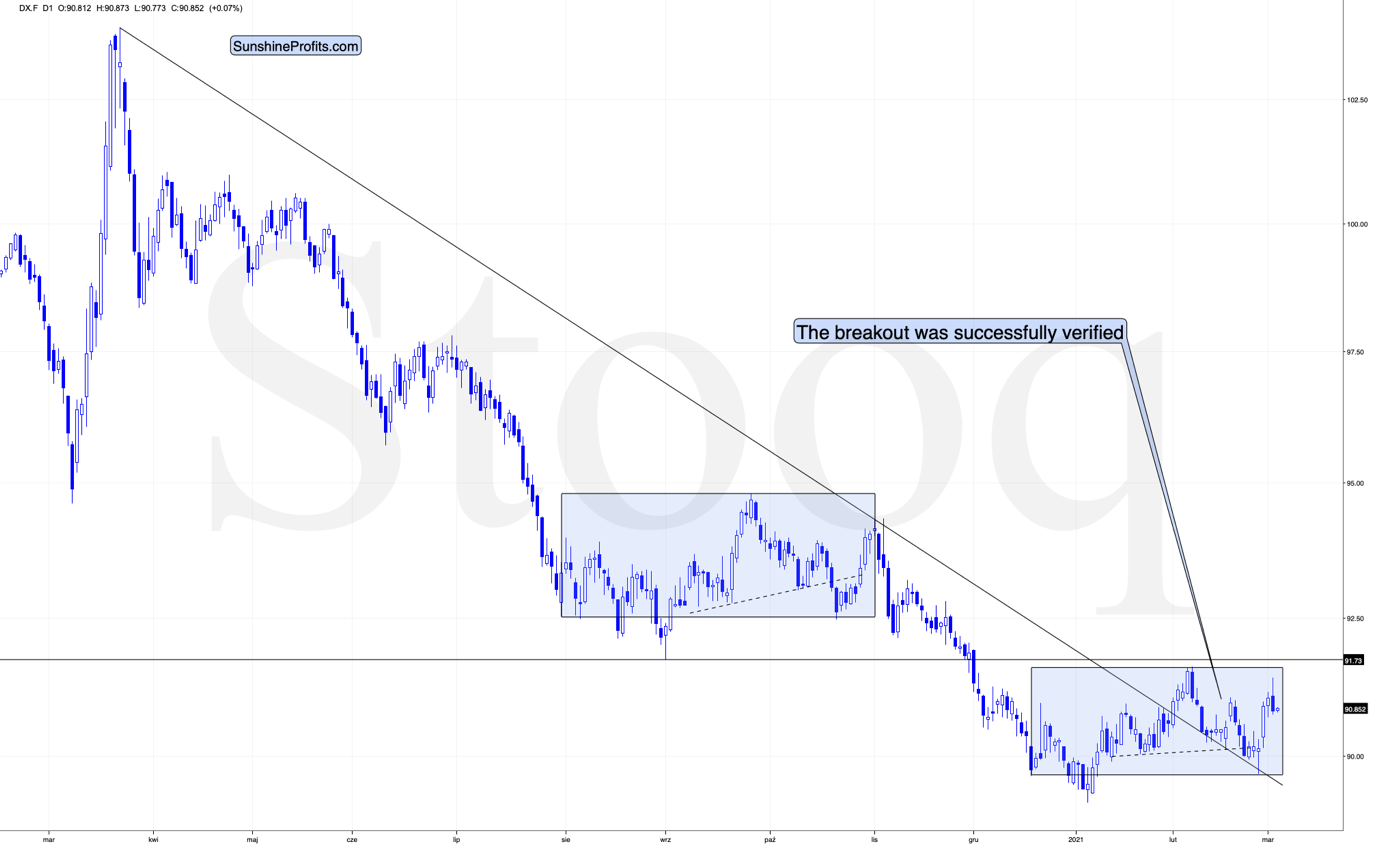
Figure 4
While the medium-term breakout continues to be the most important technical development visible on the above chart (with important bullish implications for the following months), there is one factor that could make the USD Index decline on a temporary basis.
This factor is the similarity to the mid-2020 price pattern. I previously commented on the head and shoulders pattern that had formed (necklines are marked with dashed lines), but that I didn’t trust. Indeed, this formation was invalidated, but a bigger pattern, of which this formation was part, wasn’t invalidated.
The patterns start with a broad bottom and an initial rally. Then it turns out that the initial rally is the head of a head-and-shoulders pattern that is then completed and invalidated. This is followed by a sharp rally, and then a reversal with a sizable daily decline.
So far, the situations are similar.
Last year, this pattern was followed by a decline to new lows. Now, based on the breakout above the rising medium-term support line, such a bearish outcome doesn’t seem likely, but we might see the pattern continue for several more days, before they disconnect. After all, this time, the USD Index is likely to really rally – similarly to how it soared in 2018 – and not move to new lows.
What happens before the patterns disconnect? The USD Index could decline temporarily.
This means that the temporary bottom in the precious metals and miners could have already formed, but it’s far from being crystal-clear.
All in all, markets tend to reverse only after reaching important support or resistance levels, which means that PMs and miners might still move lower before their short-term corrective upswing, but it could also be the case that the latter is already underway. Depending on how many confirmations we get of the bullish outlook, it might or might not be a good idea to enter temporary long positions here. After all, the medium-term downtrend started in August 2020 and it remains intact – thus, quick long positions are against the trend and thus riskier.
Having said that, let’s take a look at the markets from the more fundamental point of view.
The Gray Rhino
Yesterday, I highlighted the fundamental forces that could propel the USD Index back above ~94.5. And despite another Reddit-induced short squeeze – with Rocket Companies soaring by more than 70% – causing a late-afternoon sell-off on Wall Street, the USD Index still couldn’t hold 91.
However, with Guo Shuqing, Chairman of the China Banking and Insurance Regulatory Commission, beginning to see things through our lens, equity market-pain could soon be the USD Index’s gain.
On Mar. 3, the regulator told reporters that "We are really afraid the bubble for foreign financial assets will burst someday." Also referring to China’s property bubble as the “gray rhino” – a highly probable, high impact, yet neglected threat – Shuqing added that “Many people buy homes not to live in, but to invest or speculate. This is very dangerous.”
Hitting the nail on the head, Rocket Companies is the latest example of just that.
Please see below:
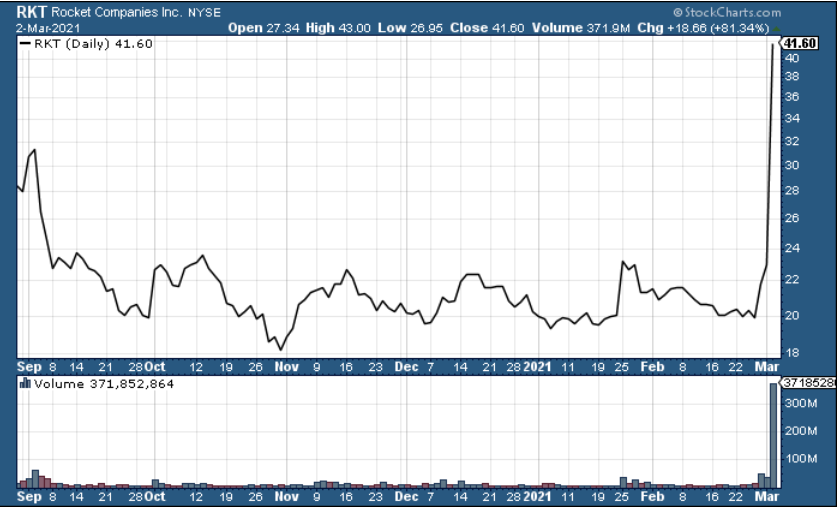
Figure 5
On Mar. 3, Rocket Companies’ stock made a parabolic move higher, with daily volume approaching 372 million. A target of WallStreetBets – because nearly 40% of Rockets’ outstanding shares are sold short (making it one of the most heavily shorted stocks on Wall Street) – Rocket Companies is a mortgage lender that’s highly leveraged to the U.S. property market. For context, this is the same U.S. property market that’s being held together by a fiscal and monetary policy thread.
Case in point: even with eviction moratoriums, mortgage deferrals and enhanced unemployment benefits masking the true impact of COVID-19, as of Feb. 11, eight U.S. states have a mortgage delinquency rate that exceeds 8% (the red box below).
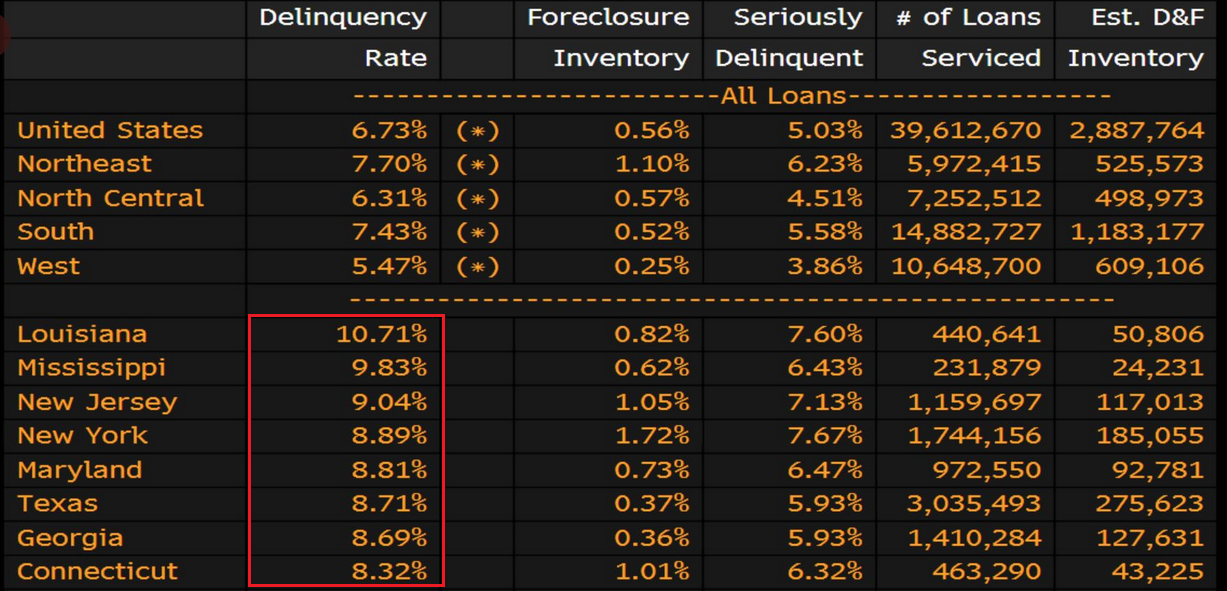
Figure 6 - Source: Bloomberg/Daniel Lacalle
But while one-day price spikes garner all of the news media’s attention, preconditions have been building for months.
Please see below:
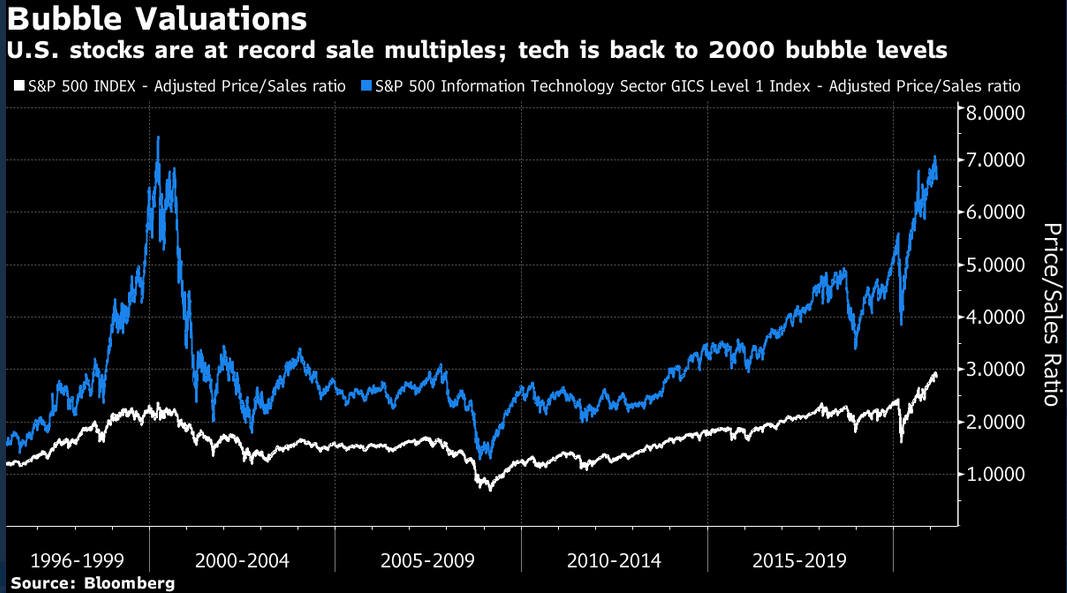
Figure 7
As of Mar. 2, the S&P 500’s price-to-sales (P/S) ratio (the white line above) remains at an all-time high. Similarly, the U.S. information technology (IT) sector’s P/S ratio (the blue line above) is only slightly below the dot-com bubble peak.
And sensing trouble, S&P 500 insiders – or executives that run the 500 largest companies in the U.S. – have been dumping equities at an unprecedented pace.
Please see below:
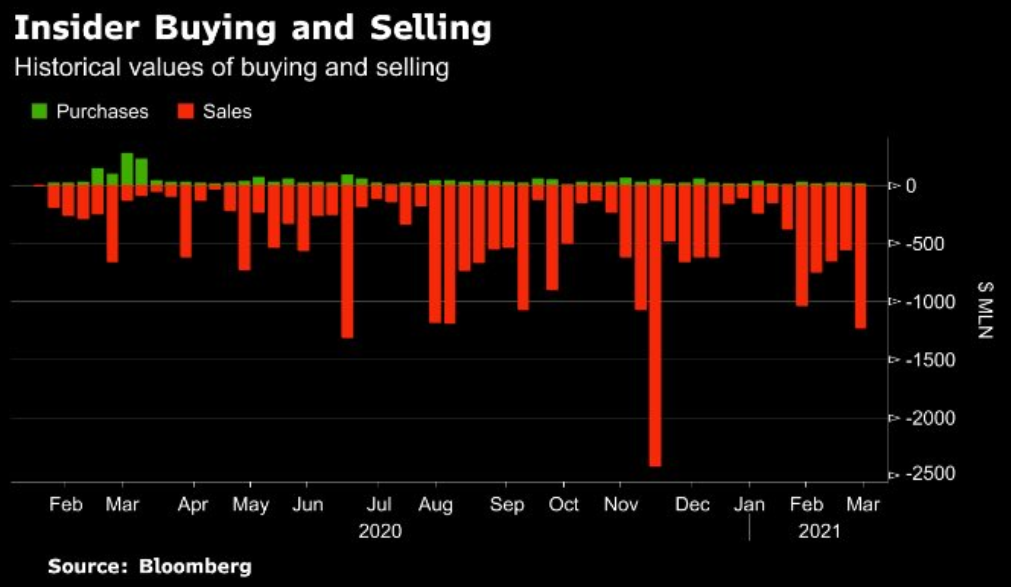
Figure 8
To explain, the green bars above represent insider purchases, while the red bars represent insider sales. In mid-to-late March, insiders sold $550.1 million worth of stock, while only purchasing $19.2 million. But even more telling, since the New Year, insiders – who were net-buyers during the coronavirus-induced panic last year – have sold $4.92 billion worth of stock, while only purchasing $128 million.
Also showing cracks in its foundation, the FTSE Renaissance Global IPO Index – which tracks the activity and performance of the global IPO market – has begun to roll over. As a then and now comparison, I wrote on Feb. 4 that the FTSE Renaissance Global IPO Index has made a vertical move higher since 2020. In addition, the percentage of companies with negative earnings hitting the IPO market is only slightly below the 2000 high (~80%).
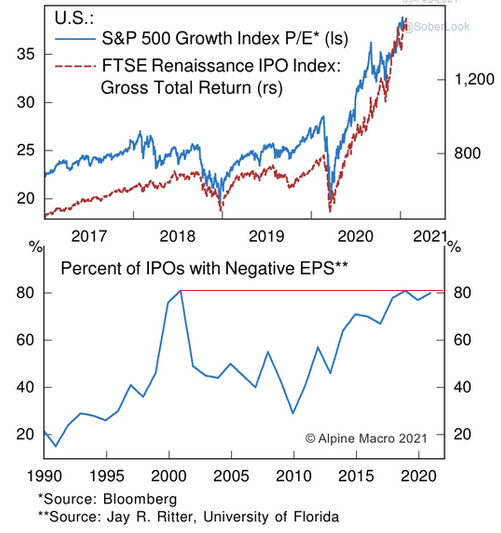
Figure 9
However, shaking the speculative ladder, the FTSE Renaissance Global IPO Index ended February down by 12.2% from its all-time high.
Please see below:
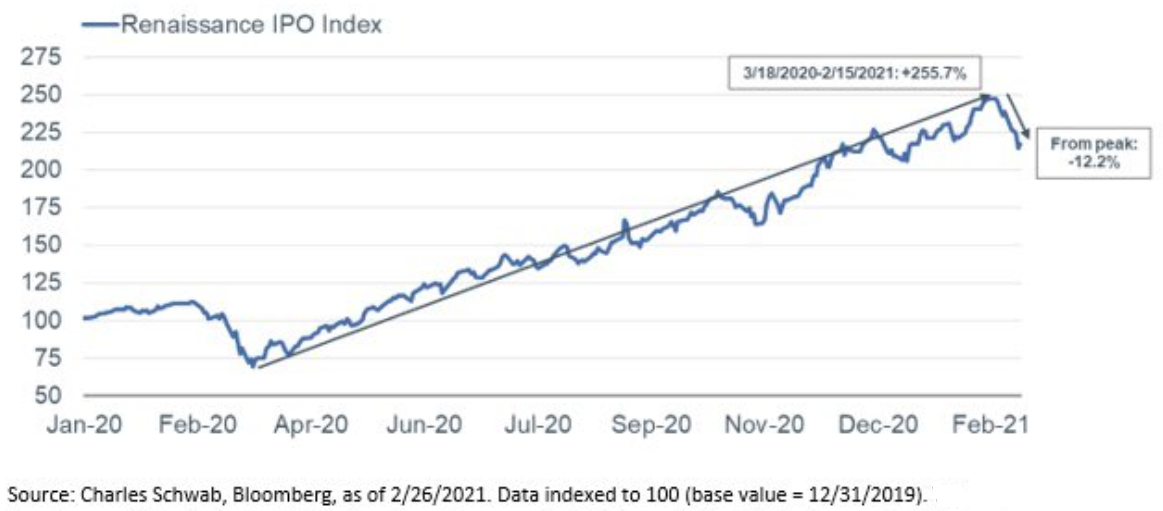
Figure 10
Also signaling trouble ahead, even with the Paycheck Protection Program (PPP) giving businesses money to pay their bills, the speculative-grade corporate bond default rate is at its highest level since the Global Financial Crisis (GFC).
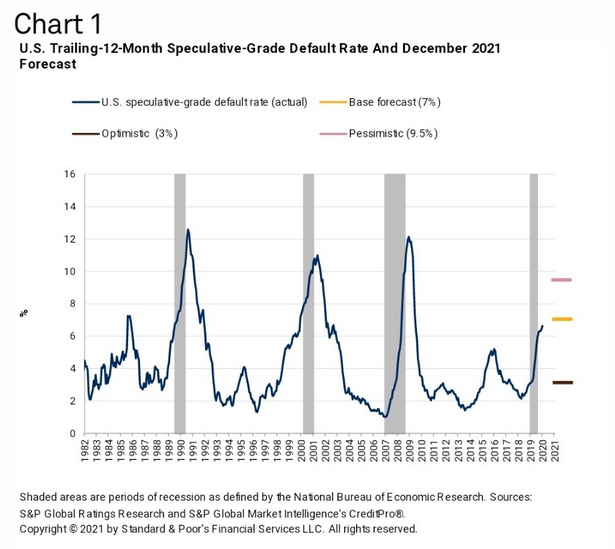
Figure 11
If you analyze the chart above, you can see that the speculative-grade corporate bond default rate peaked at roughly 12% during the GFC (2008). But with today’s reading north of 6%, it may seem like relative progress. However, like the mortgage delinquency data above, fiscal and monetary stimulus have masked the severity of the problem. In a nutshell: if liquidity becomes less abundant and governments stop giving people money, mortgage delinquencies and corporate bonds defaults are likely to surge.
But what could cause such ominous events?
Well, on Feb. 24, I wrote that Jerome Powell, Chairman of the U.S. Federal Reserve (FED), has lost control of the bond market.
Essentially, the FED remains stuck between a rock and a hard place:
- If they let yields rise, the cost of borrowing rises, the cost of equity rises, and the U.S. dollar is supported (all leading to shifts in the bond and stock markets and destroying the halcyon environment they worked so hard to create).
- To stop yields from rising, the U.S. Federal Reserve (FED) has to increase its asset purchases (and buy more bonds in the open market). However, the added liquidity should have the same net-effect because it increases inflation expectations (which a precursor to higher interest rates).
Opening door #2, Powell’s deny-and-suppress strategy is now playing out in real time.
To explain, unwelcome inflation led to a sell-off in the bond market. And while pundits believe that yield curve control (YCC) – where the FED buys bonds at various maturities to ‘control’ interest rates – will calm investors’ nerves, in reality, the strategy will only exacerbate the vicious circle.
As further evidence, the chart below shows that Powell has a firm grip on the U.S. 2-Year Treasury yield. Tracking changes in the FED’s overnight lending rate, the yield has only increased by 18.18% since Aug. 6.
Please see below:
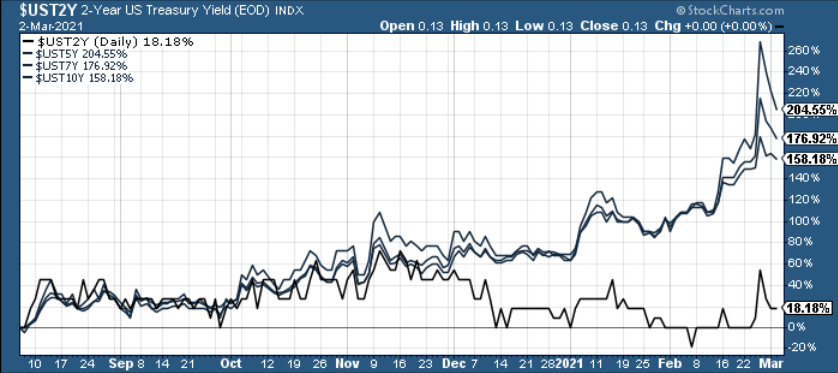
Figure 12
However, in stark contrast, the U.S. 5-year, 7-year and 10-Year Treasury yields have surged by more than 158%. Even more striking, the U.S. 5-Year Treasury yield briefly soared by more than 260%.
And while he’ll never admit it, it’s clear that investors are starting to doubt Powell’s ability to maintain financial-market nirvana.
Please see below:
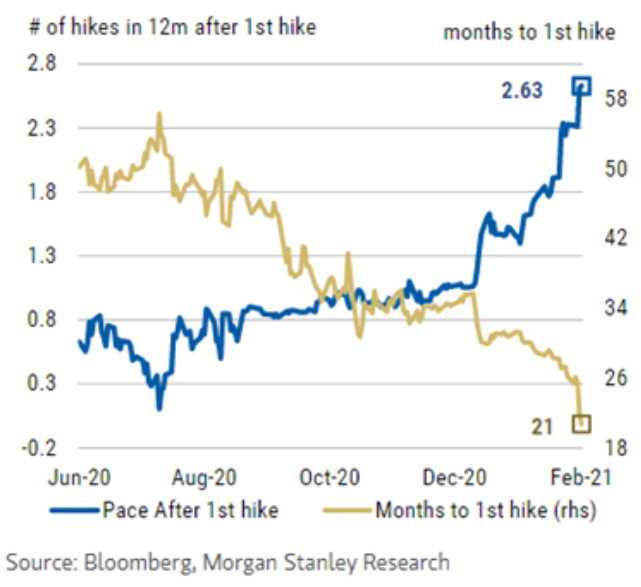
Figure 13
To explain, the gold line above tracks investors’ belief in how long it will be until the FED raises interest rates. Likewise, the blue line tracks investors’ belief in how quickly subsequent rate hikes will follow the initial rate hike. If you follow the gold line, you can see that at the end of December, investors expected roughly 36 months (three years) of bliss before the first rate hike (and only one rate hike occurring thereafter).
Conversely, investors’ now fear that an initial rate hike may occur within 21 months (less than two years), with another 2.63 rate hikes occurring within the following 12 months.
And why is all of this so important?
Because if the above expectations come to fruition – or even accelerate due to rising inflation – record-high equity multiples, speculative corporate bond defaults and mortgage delinquencies can’t be manipulated by simply printing more money.
Or to put it more bluntly, the “gray rhino” won’t be invisible anymore.
In conclusion, there are plenty of fundamental catalysts that could propel the USD Index back to elite status. However, because fundamentals play out on a medium-term timeframe, the PMs should deliver a short-term corrective upswing before the USD Index recites their eulogy (due to their strong negative correlation). As a result, the $1,670 to $1,700 range remains gold’s fulcrum, with support likely to trigger a short-term rally. However, as mentioned, a potential upswing is merely a bump in the road before the PMs continue their medium-term downtrend.
Overview of the Upcoming Part of the Decline
- I expect the initial bottom to form with gold falling to roughly $1,670 - $1,700, likely this week.
- I expect the rebound to take place during the next 1-3 weeks.
- After the rebound (perhaps to $33 - $34 in the GDX), I plan to get back in with the short position in the mining stocks.
- Then, after miners slide once again in a meaningful and volatile way, but silver doesn’t (and it just declines moderately), I plan to switch from short positions in miners to short positions in silver (this could take another 1-4 weeks to materialize). I plan to exit those short positions when gold shows substantial strength relative to the USD Index, while the latter is still rallying. This might take place with gold close to $1,450 - $1,500 and the entire decline (from above $1,700 to about $1,475) would be likely to take place within 1-10 weeks and I would expect silver to fall hardest in the final part of the move. This moment (when gold performs very strongly against the rallying USD and miners are strong relative to gold – after gold has already declined substantially) is likely to be the best entry point for long-term investments in my view. This might happen with gold close to $1,475, but it’s too early to say with certainty at this time.
- Consequently, the entire decline could take between 3 and 17 weeks.
- If gold declines even below $1,500 (say, to ~$1350 or so), then it could take another 10 weeks or so for it to bottom, but this is not what I view as a very likely outcome.
- As a confirmation for the above, I will use the (upcoming or perhaps we have already seen it?) top in the general stock market as the starting point for the three-month countdown. The reason is that after the 1929 top, gold miners declined for about three months after the general stock market started to slide. We also saw some confirmations of this theory based on the analogy to 2008. All in all, the precious metals sector would be likely to bottom about three months after the general stock market tops .
- The above is based on the information available today and it might change in the following days/weeks.
Letters to the Editor
Q: Hi PR, Thanks for keeping us well informed. I have a couple of questions:
1. Yesterday you mentioned the S&P500 market rebound off lows, and you indicated the 216 days from the bottom. Since S&P bottomed on March 23rd, 2020, 216 days brings us to 25/10/2020. So, we passed this point. You have mentioned multiple times that you believe we are entering the winter, and the equity market will crash. Could you please explain how a crash in equities can come if there is no liquidity event? With all the Fed's excess liquidity, it is hard to believe a liquidity crisis can happen. Also, Janet Yellen is keen to spend the current balance ($3T) in the General Treasury Account starting in March.
2. Do you think that expanding the broad money supply will eventually generate inflation?
3. It seems that you and Matthew Levy don't see eye to eye about the possible crash. He mentioned a minor correction and a booming second half of 2021.
4. Finally, could you please clarify your target prices for gold and miners to go long (with a long position)?
A: 1. I was referring to 216 trading days, not all calendar days. Applying this to the March 23, 2020 bottom provides us with the end of January 2021 as the likely topping point. So, yes, we passed this point, but the S&P 500 topped on February 16th, 2021, about 11 trading days after the 216-trading-day-based time target – that’s just ~5% away from the target, so I’d say that’s quite precise.
How can the equities crash if there’s no liquidity event? For example, just how they crashed last year. The liquidity didn’t dry up, and yet stocks plunged. Of course, back then the pandemic panic triggered the decline, and this time there might not be an analogous event (or there could be one – perhaps the gray rhino that I described earlier today) and markets could simply collapse because they are too high (bubble everything). When the stock market bubble bursts, it will likely trigger a sell-off even without any other reason except for people – seeing their portfolio values decline – panicking, and themselves starting to sell, thus contributing to the decline’s sharpness.
Yes, there’s excessive liquidity. Yes, things are not like they were during the previous Kondratiev winter cycles. And yes – the interest rates are soaring. Not the short-term ones, but the long-term ones. Instead of a bankruptcy tsunami, we could see a smaller wave of bankruptcies along with a huge number of zombie companies that are getting by just thanks to the ultra-dovish credit terms. Markets are forward looking so realizing that the above is happening or about to happen would likely result in stock price declines anyway.
2. Yes.
3. That’s correct, Matthew Levy, CFA is more bullish on the stock market than I am. I’m definitely biased toward the bearish side because I simply don’t see the world operating in a bubble territory forever and it seems to me that the time to “check” what this rally is really made of is already here, or just around the corner. Please note that I don’t aim to find opportunities in the stock market, but rather focus on the stock market’s implications for the precious metals market. Matthew Levy, CFA is finding such opportunities, for example through the emerging markets ETFs, where he found quite a few gems in recent months. So, those who are interested in opportunities that the stock market offers (despite all of the above), might want to seriously consider Matthew’s work at our Stock Trading Alerts.
4. I have no specific price target for miners to go long. I think that it would be a good idea to go long miners when gold futures decline to $1,692 (or lower).
Q: In your 3/1 alert, you posted a weekly gold chart comparing the 2012 top with the current one and put a blue copy on the 2012 top. If you look at the monthly chart comparing the same, I think there should be another rally to $1960 into July-August or so, to make the pattern similar. After the monthly MACD crossed down in 2011, it was 11-12 months before the final peak happened. It’s only been 8 months since the 2020 top. Also, the current MACD would need to go further down now while the price makes that final run up for a similar 2012 pattern. Please confirm if you think I'm correct that this might be the most important thing to know. Lastly, do you put any weight in the USD 2017 low at 88ish, pulling the price down for a retest to form a more valid double bottom? Thanks for all your hard work!
A: Both scenarios that you outlined: for the USD Index and for gold would fit each other, but I still think that they are less probable than seeing a bigger rally in the USD Index and a bigger decline in gold relatively soon.
Let’s take a look at the USD Index.
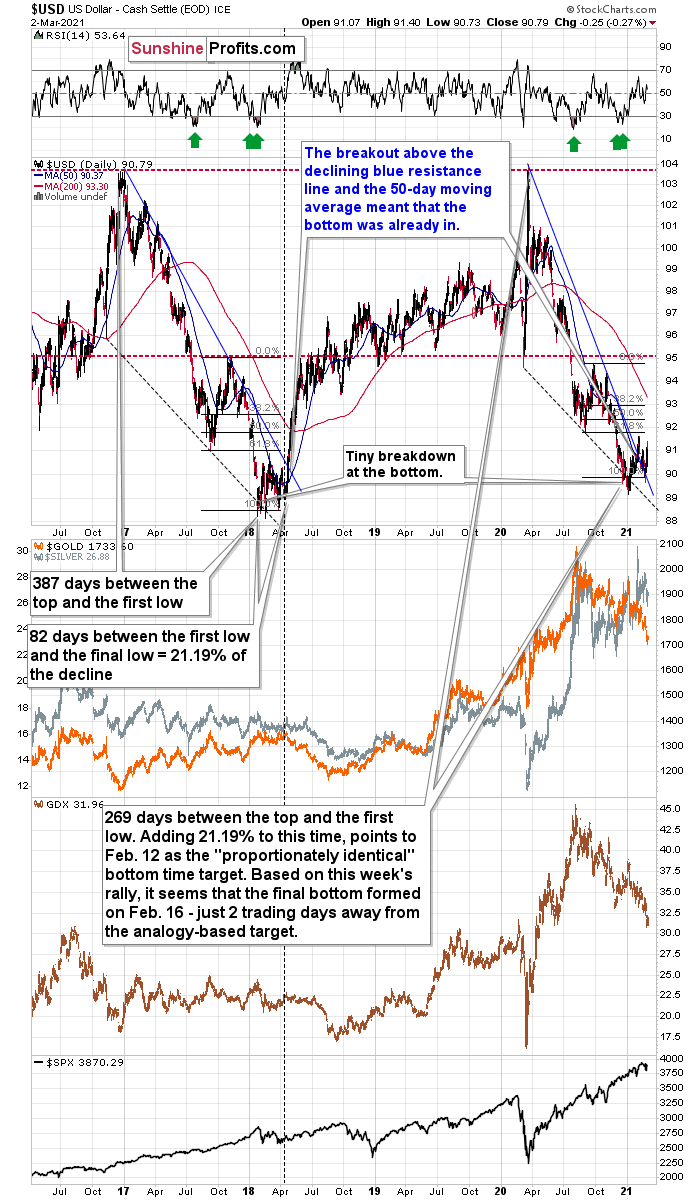
Figure 14
The 2017 and 2020 declines started from similar levels so they might also end at similar levels and the 2018 lows close to 88 are definitely providing very strong support. However, the shape of the move patterns a lot too. Both moves had important corrective upswing around the 93 level. The temporary bottom in 2020 formed at higher level than the temporary bottom in 2017, which is a clue telling us that the next bottom might also form above the 2018 low.
The final bottom was broad in both cases and it took similar time for the USD Index to form them. If the USD Index was to decline to 88 soon, it would have to break this similarity in shape. This would be another separate move lower after the broad bottom and that’s not something that we saw in 2018. Consequently, by moving to the 2018 lows, the pattern would become less similar instead of being a bit more similar based on the price levels alone.
The position of the USD Index relative to the declining blue resistance/support line and the 50-day moving average is also something that makes the current situation similar to the very early days of the post-bottom rally. A move to new lows would also invalidate this similarity.
Finally, please note that the markets tend to correct certain moves through both: price moves and time that it takes since the previous move. It’s often the case that the moves that are sharper don’t take as much time, and those that are relatively calm, need more time. The 2020 decline was sharper than the 2017 one, so it would be relatively normal for it to take less time than the 2017 – 2018 one. All this suggests that we are not likely to see another bigger move lower in the USDX.
And speaking of sharpness of the price moves – in my view the current situation in gold is similar to what we saw in 2011 – 2013 on a proportional basis, not in 1:1 terms. That’s why I’m not applying the time analogy in the case of the MACD on a 1:1 basis.
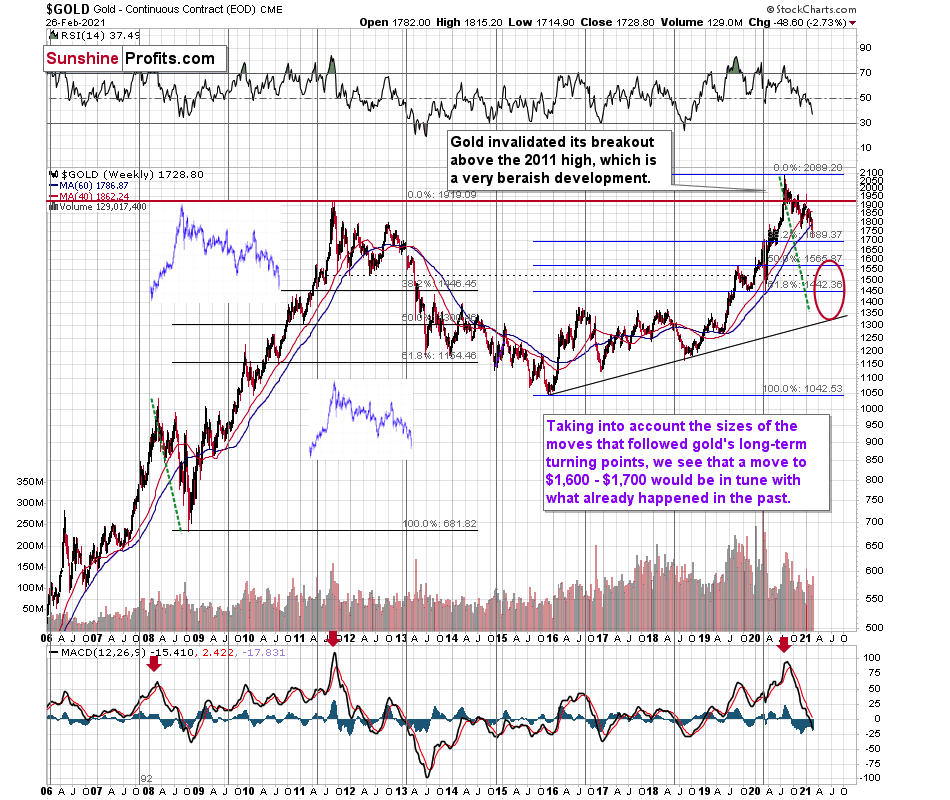
Figure 15
To clarify, here’s how I see the similarity:
- The August 2020 top is the analogy to the 2011 top
- The initial sharp August 2020 slide (bottom on Aug. 12, 2020) is the analogy to the September 2020 decline (Sep. 26, 2011 bottom)
- The Aug. 18, 2020 top is the analogy to the Nov. 8, 2011 top
- The Sep. 24, 2020 bottom is the analogy to the Dec. 29, 2011 bottom
- The Nov. 9, 2020 top is the analogy to the Feb. 28, 2012 top
- The Nov. 30, 2020 bottom is the analogy to the May 16, 2012 bottom
- The Jan. 6, 2021 top is the analogy to the Oct 5, 2012 top
- The Feb 19, 2021 bottom is the analogy to the Feb. 21, 2013 bottom
- The Feb 23, 2021 top is the analogy to the Feb. 26, 2013 top
So, in my view, gold has already formed all its “interim tops of the pattern”, and can now slide (not necessarily without periodic corrections, though).
Q: The first thing I read every day, after quickly checking the market indices, is the Gold and Silver Trading Alerts. I became a subscriber a couple of months ago and it's the best Newsletter/Alert. My question. Many of the Elliot Wave and Cycle Analysts are predicting gold's final peak in June, followed by a bear market. They point to the 8 to 9 year cycle in gold. Do you believe these cycles and Elliot Wave counts are relevant today? Also, when the low occurs in the PM sector later this year, then will this be the start of another leg up in a longer-term multi-year gold bull market? For me, it would be great to have some good dividend paying miners on a long-term hold basis rather than trading.
A: Thank you! I’m very happy to hear that you enjoy my service so much. As for the Elliott Wave analysis and analysts, I wouldn’t pay too much attention to the extremely bearish forecasts about prolonged declines in gold. I’m all for cycle analysis, but I think this should be conducted on a global scale and starting with the long-term outlook. In my view, we are entering the Kondratiev winter and gold is likely to be one of the best performing assets during this time period – just not right from the start, where the USD would be likely to take the lead.
I see gold declining far, but I don’t see gold staying at very low prices for long. Investors’ emotionality can trigger only so much – it cannot dictate to the market what it should do in the long run. The fundamentals determine what’s likely to happen over the course of the coming years and the fundamentals for gold are superb. Upcoming bankruptcies on one hand, massive money printing on the other hand, it’s actually hard to imagine a better environment for gold to thrive in.
As for the Elliott Wave analysis itself, the problem with it is that it’s completely subjective and you can’t really falsify anything that someone claims based on it. Karl Popper would therefore say that it’s not “scientific”. Well, to be clear, one could say the same thing about practically all technical analysis, but the Elliott Wave analysis is taking it to the extreme. For example, one can say how many times a given indicator worked in a given setting for a given market, or one could measure a market’s relative strength compared to something else. But in the case of the Elliott Wave counts, one can’t say that this way of counting them is correct and another is wrong.
Now, I’m not saying that the technique is useless. It’s useful at certain times and when conducted by some individuals, but overall, when taking all people making forecasts based on the Elliott Waves, it doesn’t seem that it should be given much credit in my opinion.
To answer your final question, yes, I think that once gold forms the final bottom in the following months – perhaps close to $1,500 or lower – then I think that it will be the start of another powerful long-term upleg.
Summary
To summarize, the PMs’ decline is already underway, as miners broke below the neck level of their almost-yearly head-and-shoulders formation and then continued the decline.
In addition, because we’re likely entering the “winter” part of the Kondratiev cycle (just like in 1929 and then the 1930s), the outlook for the precious metals’ sector remains particularly bearish during the very first part of the cycle, when cash is king.
The confirmed breakout in the USD Index is yet another confirmation of the bearish outlook for the precious metals market.
After the sell-off (that takes gold to about $1,450 - $1,500), we expect the precious metals to rally significantly. The final part of the decline might take as little as 1-5 weeks, so it's important to stay alert to any changes.
Most importantly, please stay healthy and safe. We made a lot of money last March and it seems that we’re about to make much more on this March decline, but you have to be healthy to enjoy the results.
Please take a look at the “trading capital” specifications below as there are quite a few changes in it. The prices are up-to-date, which means that I restored the original target for the GDXJ (after adjusting it temporarily on Friday, February 26) based on the likelihood of seeing another move lower in gold. I also updated the target for the JDST, and I updated the gold price based on which I plan to enter quick long positions.
As always, we'll keep you - our subscribers - informed.
To summarize:
Trading capital (supplementary part of the portfolio; our opinion): Full speculative short positions (300% of the full position) in mining stocks are justified from the risk to reward point of view with the following binding exit profit-take price levels:
Senior mining stocks (price levels for the GDX ETF): none
Junior mining stocks (price levels for the GDXJ ETF): binding profit-take exit price: $42.72; stop-loss: none (the volatility is too big to justify a SL order in case of this particular trade); binding profit-take level for the JDST ETF: $13.79; stop-loss for the JDST ETF: none (the volatility is too big to justify a SL order in case of this particular trade)
For-your-information targets (our opinion; we continue to think that mining stocks are the preferred way of taking advantage of the upcoming price move, but if for whatever reason one wants / has to use silver or gold for this trade, we are providing the details anyway. In our view, silver has greater potential than gold does):
Silver futures downside profit-take exit price: unclear at this time - initially, it might be a good idea to exit, when gold moves to $1,693.
Gold futures downside profit-take exit price: $1,693.
=====
Moreover, even if none of the above-mentioned targets are reached, but gold moves to $1,693, I think that closing any remaining positions would be justified from the risk to reward point of view, anyway.
Additionally, if gold moves to $1,692, I think that LONG trading positions in GDX will be justified from the risk to reward point of view with $32.39 as the next target.
Alternatively to GDX – if one seeks to gain leverage, one might consider going long (when gold moves to $1,703) NUGT (2x leverage) or GDXU (3x leverage – not recommended for most due to the significant leverage, but might be interesting tool for more advanced traders).
The size of position for this very quick long position would be regular.
We are not using GDXJ here for the sake of simplicity in case of this quick trade and because GDXJ didn’t reach support that’s as strong as the one that the GDX ETF just reached.
======
Long-term capital (core part of the portfolio; our opinion): No positions (in other words: cash
Insurance capital (core part of the portfolio; our opinion): Full position
Whether you already subscribed or not, we encourage you to find out how to make the most of our alerts and read our replies to the most common alert-and-gold-trading-related-questions.
Please note that we describe the situation for the day that the alert is posted in the trading section. In other words, if we are writing about a speculative position, it means that it is up-to-date on the day it was posted. We are also featuring the initial target prices to decide whether keeping a position on a given day is in tune with your approach (some moves are too small for medium-term traders, and some might appear too big for day-traders).
Additionally, you might want to read why our stop-loss orders are usually relatively far from the current price.
Please note that a full position doesn't mean using all of the capital for a given trade. You will find details on our thoughts on gold portfolio structuring in the Key Insights section on our website.
As a reminder - "initial target price" means exactly that - an "initial" one. It's not a price level at which we suggest closing positions. If this becomes the case (like it did in the previous trade), we will refer to these levels as levels of exit orders (exactly as we've done previously). Stop-loss levels, however, are naturally not "initial", but something that, in our opinion, might be entered as an order.
Since it is impossible to synchronize target prices and stop-loss levels for all the ETFs and ETNs with the main markets that we provide these levels for (gold, silver and mining stocks - the GDX ETF), the stop-loss levels and target prices for other ETNs and ETF (among other: UGL, GLL, AGQ, ZSL, NUGT, DUST, JNUG, JDST) are provided as supplementary, and not as "final". This means that if a stop-loss or a target level is reached for any of the "additional instruments" (GLL for instance), but not for the "main instrument" (gold in this case), we will view positions in both gold and GLL as still open and the stop-loss for GLL would have to be moved lower. On the other hand, if gold moves to a stop-loss level but GLL doesn't, then we will view both positions (in gold and GLL) as closed. In other words, since it's not possible to be 100% certain that each related instrument moves to a given level when the underlying instrument does, we can't provide levels that would be binding. The levels that we do provide are our best estimate of the levels that will correspond to the levels in the underlying assets, but it will be the underlying assets that one will need to focus on regarding the signs pointing to closing a given position or keeping it open. We might adjust the levels in the "additional instruments" without adjusting the levels in the "main instruments", which will simply mean that we have improved our estimation of these levels, not that we changed our outlook on the markets. We are already working on a tool that would update these levels daily for the most popular ETFs, ETNs and individual mining stocks.
Our preferred ways to invest in and to trade gold along with the reasoning can be found in the how to buy gold section. Furthermore, our preferred ETFs and ETNs can be found in our Gold & Silver ETF Ranking.
As a reminder, Gold & Silver Trading Alerts are posted before or on each trading day (we usually post them before the opening bell, but we don't promise doing that each day). If there's anything urgent, we will send you an additional small alert before posting the main one.
Thank you.
Przemyslaw Radomski, CFA
Founder, Editor-in-chief

