

Briefly: in our opinion, full (250% of the regular size of the position) speculative short positions in gold, silver and mining stocks are justified from the risk/reward perspective at the moment of publishing this Alert.
Gold miners just confirmed their short-term breakdown, broke below another important line, and moved to the third of the nearby support lines. The short-term trend is changing and it’s happening almost unnoticed. The price moves may be subtle, but their implications are not. Even relatively small moves confirmed by closing prices or – better yet – a series of them, can have meaningful implications. And this appears to be the case right now.
Let’s start with a quick overview of the entire PM sector.
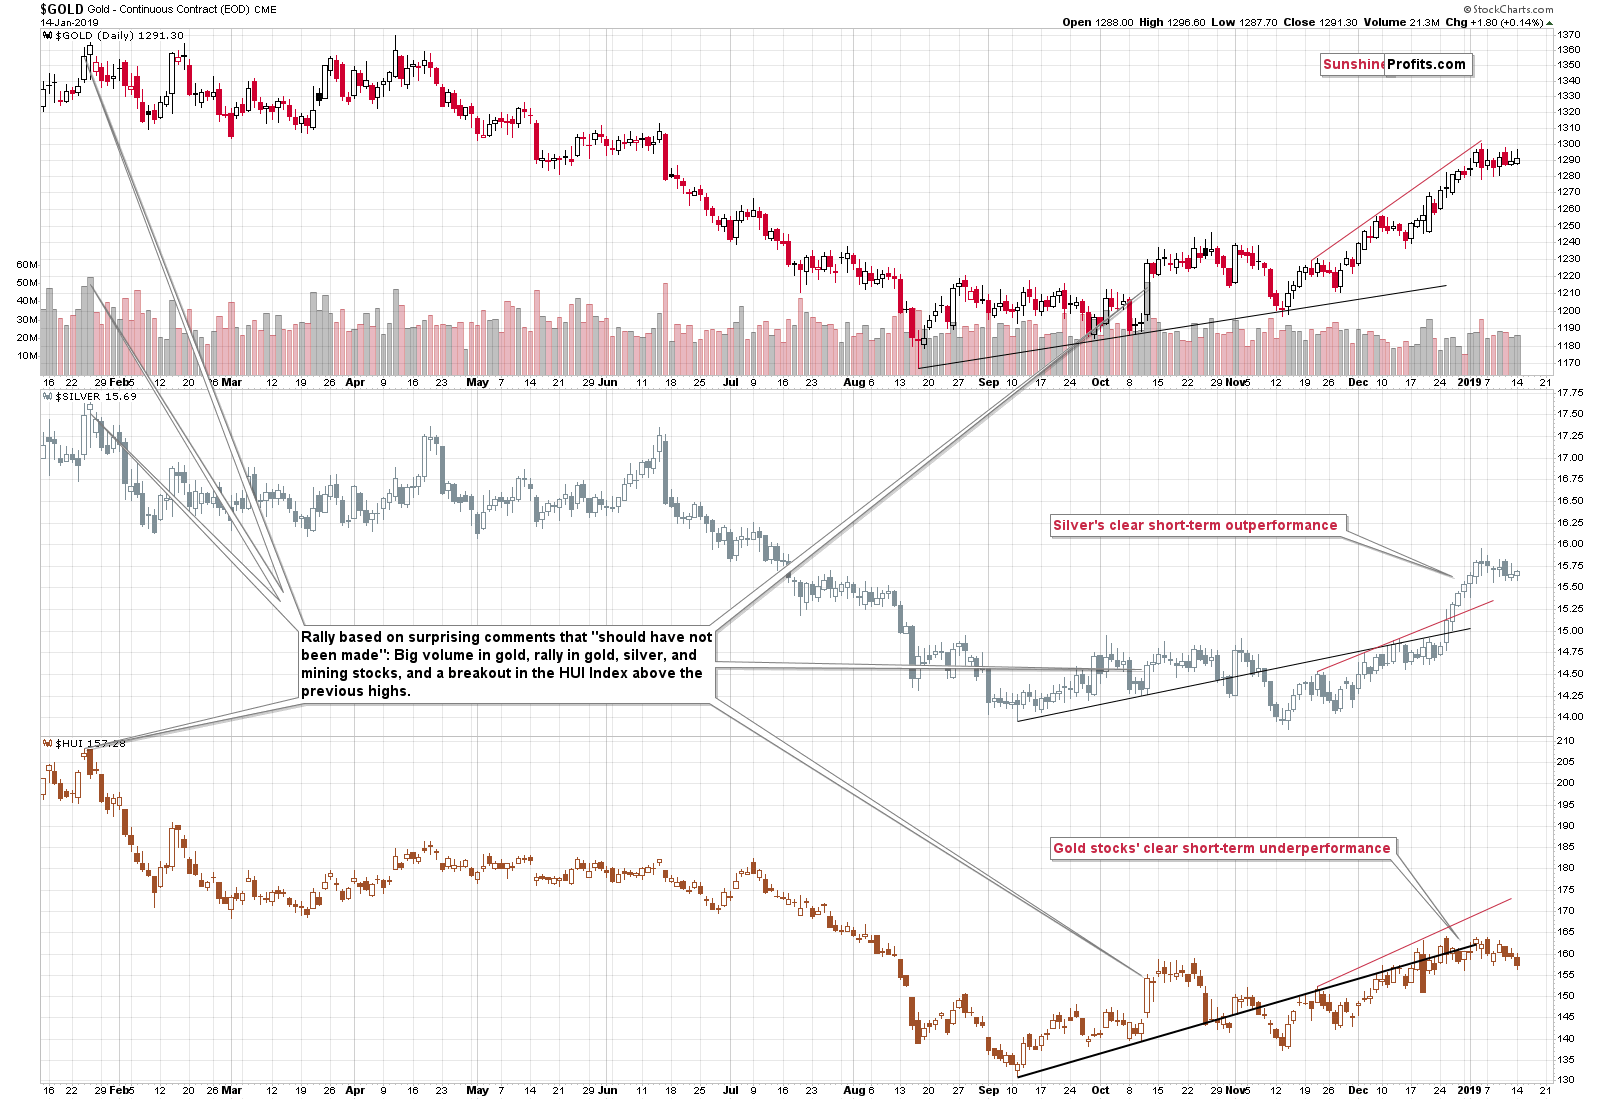
Gold and silver were mostly unchanged (gold’s intraday attempt to move higher was invalidated), but miners declined. Their underperformance is now crystal clear. If it doesn’t seem apparent, please note where all 3 parts of the precious metals sector are right now with regard to their rising resistance lines. Gold miners are well below this line and are moving away from it in a fast manner.
Naturally, miners’ weakness is a bearish phenomenon and the short-term breakdowns that we mentioned earlier indicate that this weakness will continue.
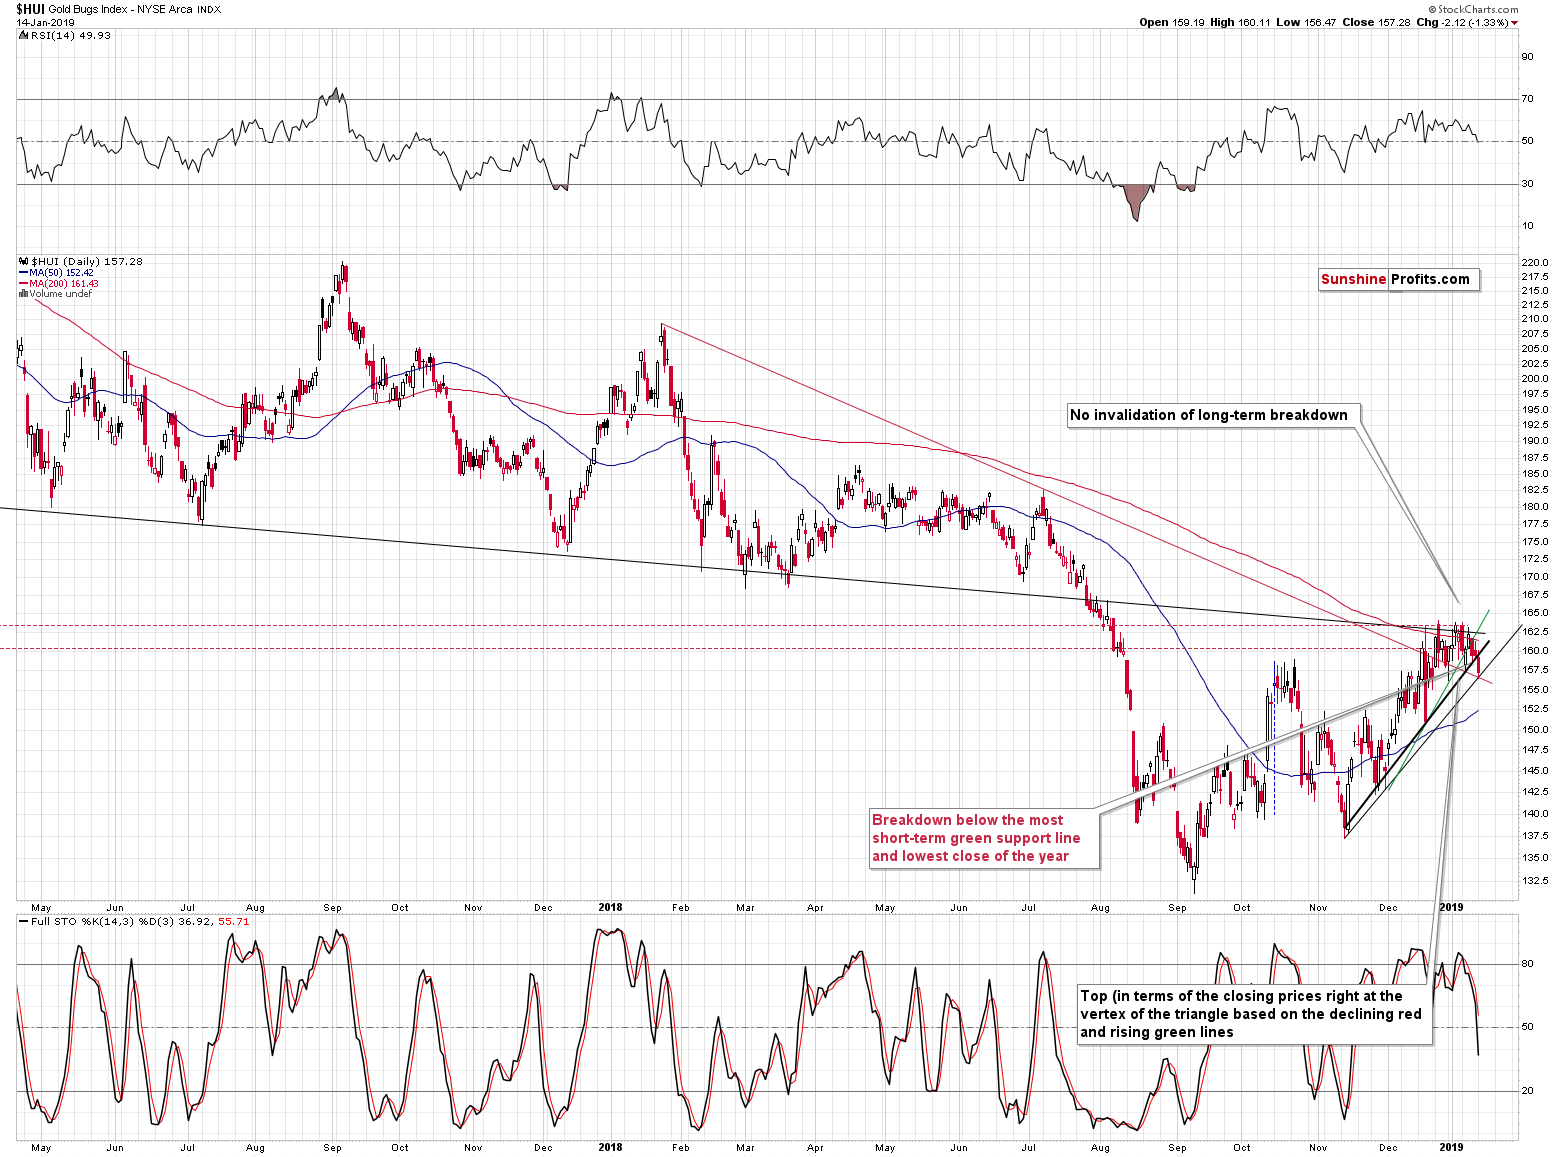
In the previous Alert, we wrote the following about the situation in the HUI Index:
Gold stocks broke below the rising green support line that’s based on the most recent lows. The line is based on 3 lows (last one in late December), which means that it already worked once. It was also where miners closed on Tuesday after the intraday reversal. This line was finally broken yesterday. The breakdown is not yet confirmed, so it’s not yet a very bearish sign, but it seems to be a good sign that the very short-term dynamic has changed. We have ton of medium-, and long-term signs pointing to much lower PM prices, so a very short-term sign suggesting that the waiting may be over is a good addition.
Still, since gold and silver moved higher in today’s overnight trading, it wouldn’t be surprising to see miners move to this green line (to about 162.5) and verify the breakdown.
The above remains mostly up-to-date. The change is that we now have two daily closes and one weekly close below the rising green support line, which makes the breakdown almost confirmed. If the USDX declines and gold and silver respond with a temporary upswing, it would not be surprising to see a corrective upswing back to the green line at about 162.5. Naturally, this is not inevitable. We might see this decline’s continuation right away.
We now have three closing prices below the rising green line, which means that the breakdown was confirmed and that the very short-term trend has reversed. But that’s not all what happened. The HUI Index also closed below the rising black line (the thicker one) that’s based on the previous closing prices. This breakdown is not yet confirmed, but the fact that it took place increases the bearish implications of the above-mentioned breakdown below the green line.
Gold stocks also moved to the rising black line (thinner one) that’s based on intraday lows and at the same time moved to the declining red support/resistance line. This means that it moved to the apex of the triangle that’s based on both above-mentioned lines. Consequently, we might expect some kind of turnaround and a very short-term upswing. This would be in tune with a temporary decline in the USD Index that we wrote about previously. Such an upswing in the mining stocks could validate the breakdowns below the previous two lines or just below the green one. Either way, as long as we have daily closing prices below the late-2016 low, the outlook for the next several weeks and months will definitely not change.
Before moving to other markets, we would like to draw your attention to the size of the recent upswing in the mining stocks.
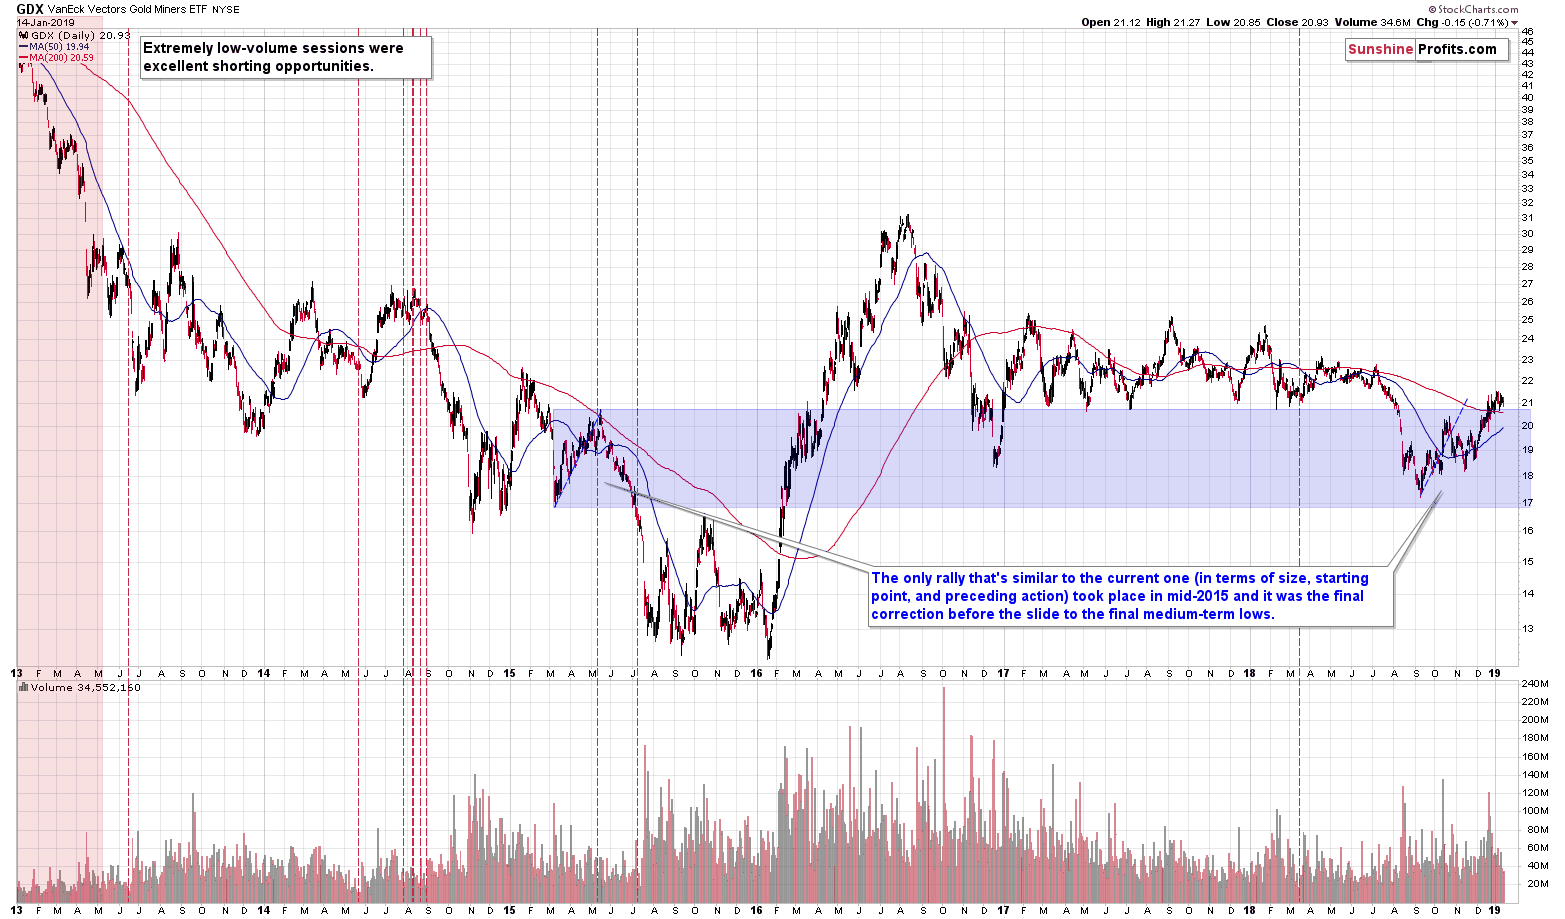
It probably doesn’t look familiar, but it actually should. We saw almost identical corrective upswing in mid-2015. The previous rally started from a bit lower levels and ended a bit lower as well (we used the blue rectangle on the above chart to make the comparison easier), but the differences were tiny. The entire size of the upswing was extremely similar, and we marked it with a blue dashed line. Copying the previous decline to the 2018 bottom shows that the current upswing’s end (assuming that it ended) is very much in tune with where the rally should have ended based on the 2015 - now similarity. Moreover, both rallies ended when GDX moved a little above its 200-day moving average.
Why is this similarity important? Because that was the final corrective upswing before the slide to the 2015 lows. The decline that followed was more than twice as big as the size of the corrective rally. That’s very bearish on its own, but let’s keep in mind that in 2015 the USD Index was after a multi-month rally and this time it seems that its medium-term rally is far from being over. Consequently, the potential for the decline in the miners is even greater this time.
Speaking of the USD Index, let’s see what the short-term outlook for it currently looks like.
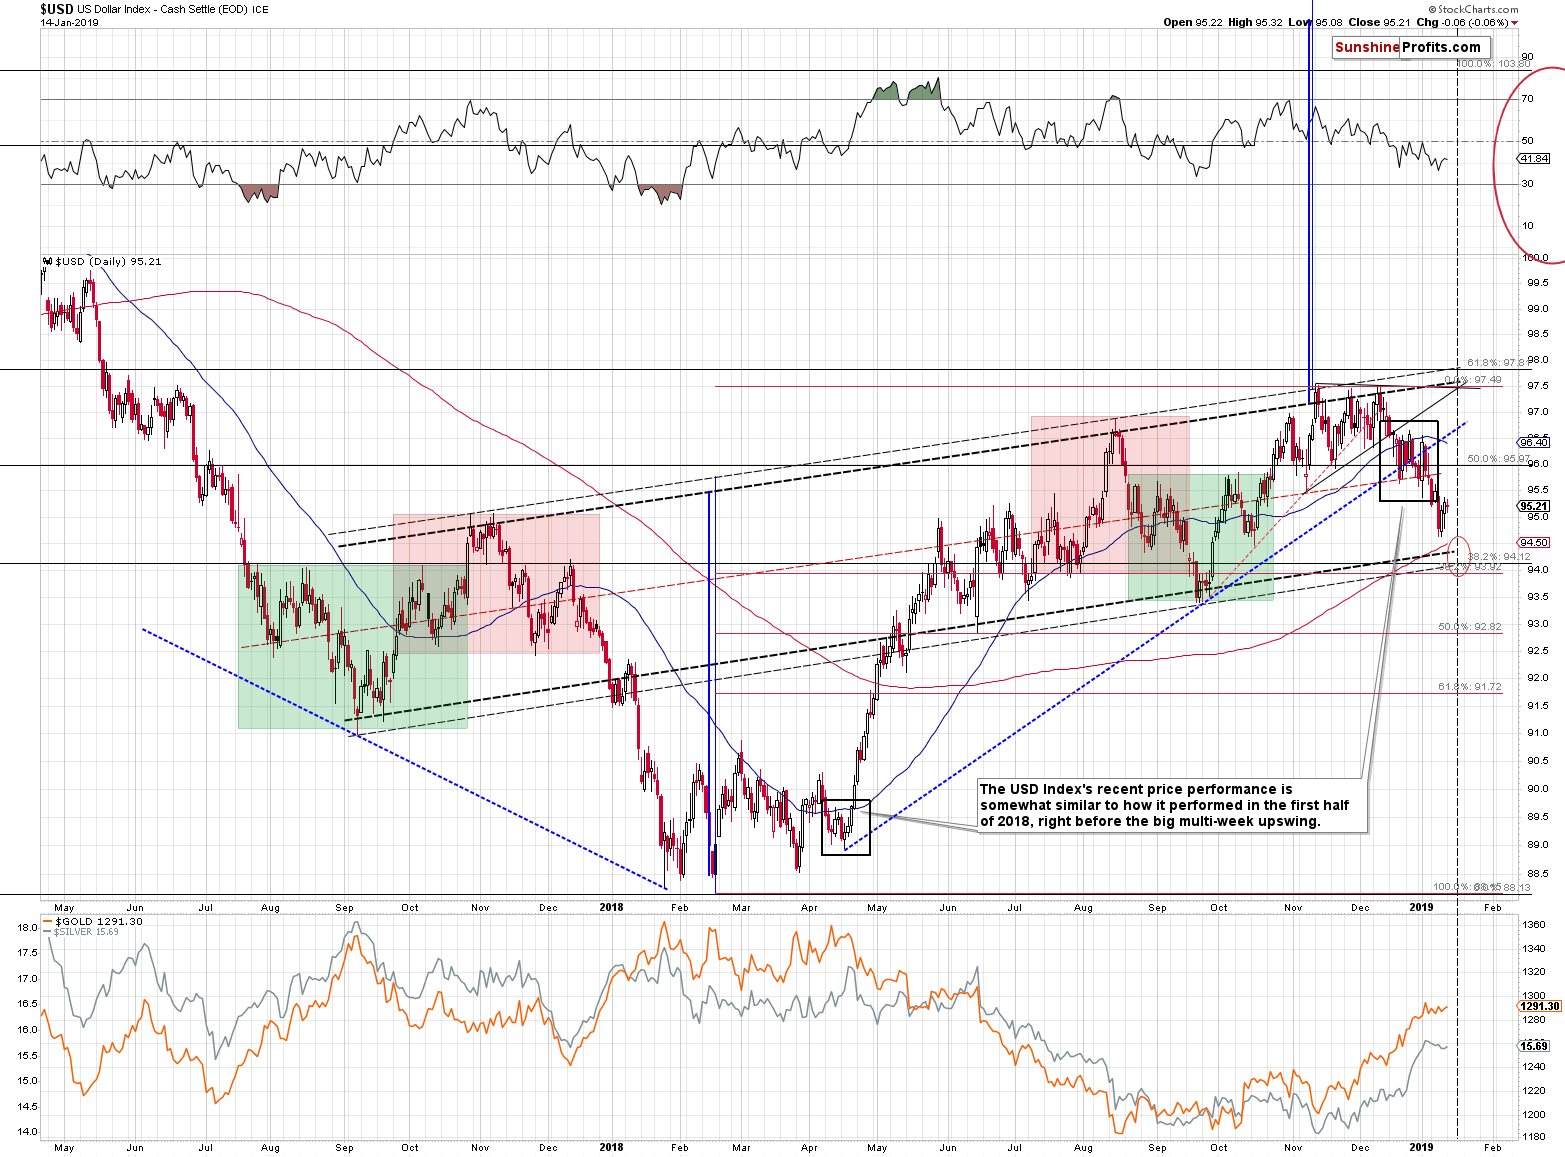
In short, everything that we wrote about the USDX recently, remains up-to-date. It may still decline this week and reach the red target area, but it’s not likely to trigger a massive rally in precious metals and mining stocks. Quoting our previous analysis:
The USD Index had previously quickly invalidated its breakdown below the rising blue support line, but this wasn’t the case in the last few days. This time, the breakdown below the rising blue support line was just confirmed, which is a bearish sign for the very short term.
We marked the possible downside target for the USD Index, while at the same time keeping the big upside target as well. The rally after the final bottom could be sharp, so both targets could be reached.
The downside target is approximately between 94 and 94.5. That’s about 1 – 1.5 index point decline from the current levels. This approximately means doubling the decline from this year’s top (January 2nd) to the current level. This may seem like a big deal for the precious metals investors, but actually it isn’t one.
The reason is the weakening in the strength of reaction to USD’s bearish signals that we recently discussed by examining gold’s performance in terms of the euro. Gold and silver simply refuse to rally on lower USDX as their respective resistance levels were already reached. On January 2nd, gold closed at $1,284 while silver closed at $15.65. That’s more or less where both metals are right now. Consequently, the repeat of the Jan 2nd – today performance wouldn’t mean practically anything for the PMs.
In other words, while the USD Index may decline in the next several days, the precious metals sector is not likely to rally in a meaningful way based on it. However, if the USD Index moves higher (and the yen declines in value), gold and silver will likely plunge. The above (just the above, without taking other factors into account)appears to have only mildly bearish implications for gold and silver, but at the same time it’s definitely justified to keep the short positions intact. This may seem surprising, but it is really the case.
While probability of small upswing and big declines in the next few days may be similar for the PMs (thus implications may appear neutral or close to neutral), the likely size of the moves are not. The upside potential for the PMs appears very limited, while the downside potential is huge. Moreover, adding more factors to this picture – the ones that we described previously – makes the current short position definitely justified from the risk to reward point of view.
The above remains up-to-date. The USDX moved to 94.64 yesterday, which is close to the target area that we mentioned yesterday (94 – 94.5), but not yet in it. Consequently, we may see a bit more weakness in the following hours and – perhaps – days. The key thing is that the lower border of the target area will be reached if yesterday’s decline is simply doubled (approximately).
The silver chart also suggests that a more visible move or reversal is about to take place.
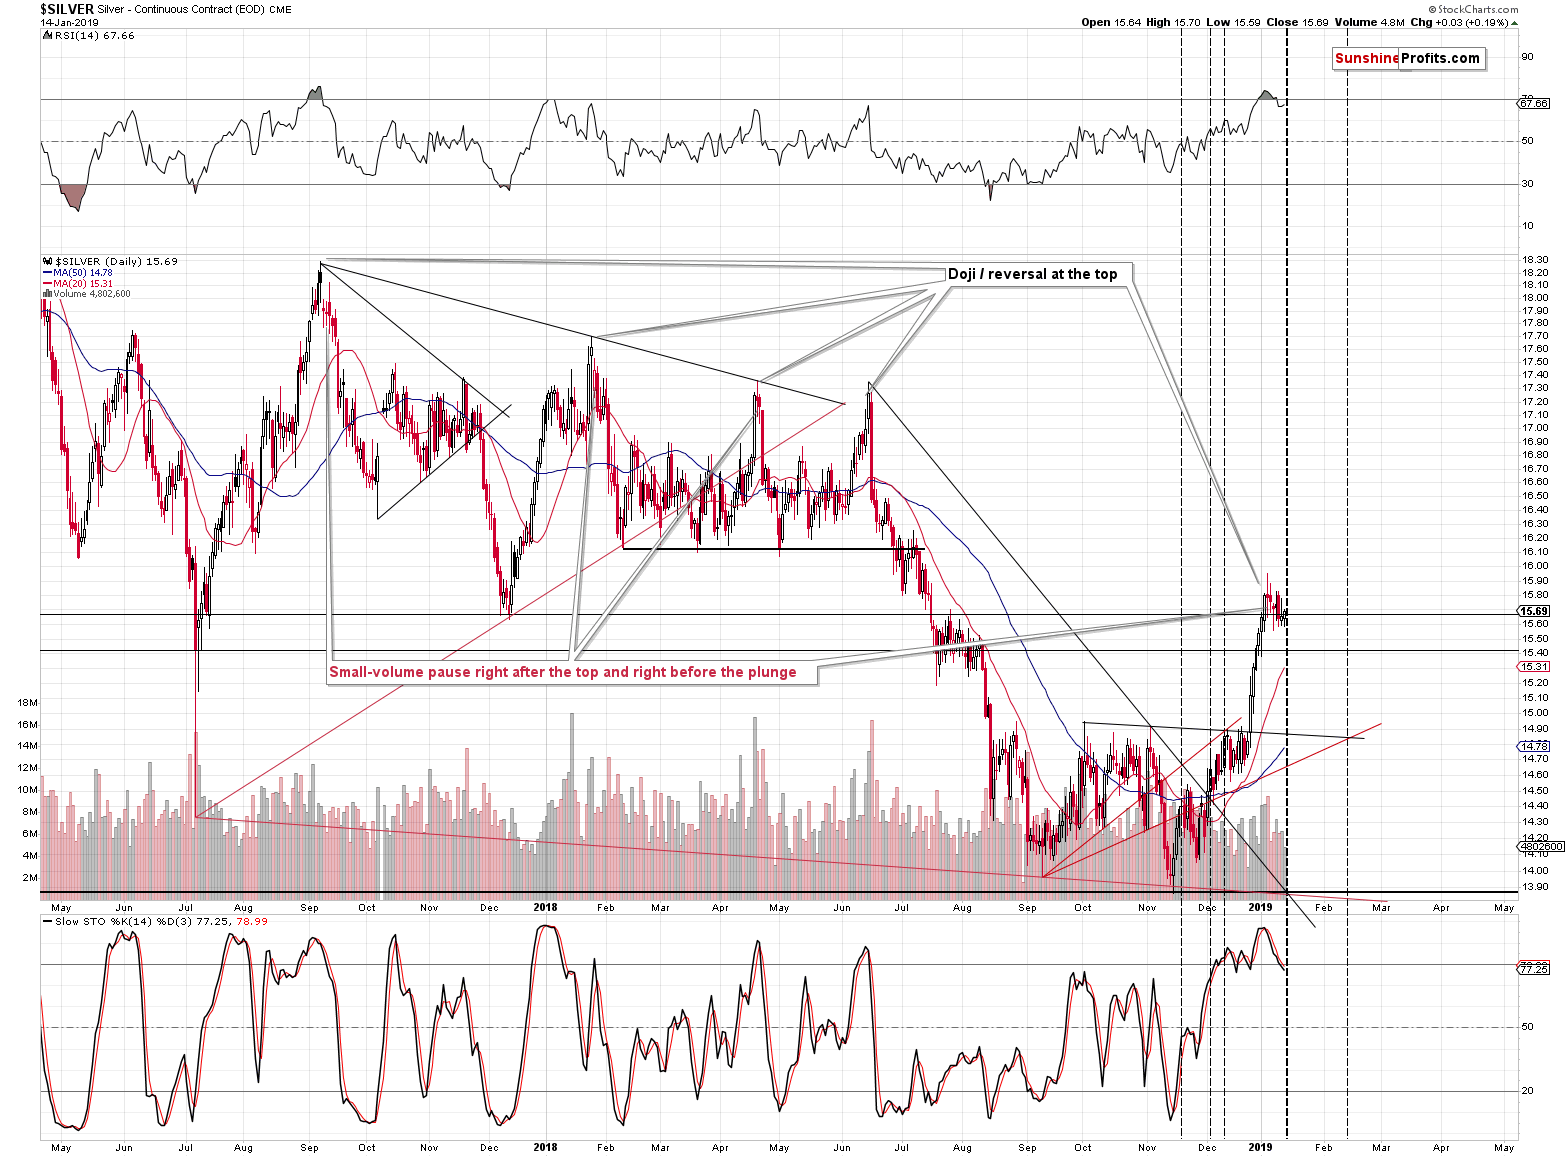
The vertex of the triangle that’s based on the two declining (red and black) support lines is approximately today, suggesting that a major turnaround is just around the corner. We recently saw some back and forth trading, so if we see a quick rally and perhaps an intraday reversal, please keep in mind that it will actually be a bearish development, not a bullish one. It’s far from being certain, but we can’t rule out another move to the previous January high.
Of course, it doesn’t change anything with regard to the outlook for the following weeks, which remains bearish. It’s just a heads-up of what may take place this week. The risk to reward with regard to the bigger move continues to favor the bearish positions in our view.
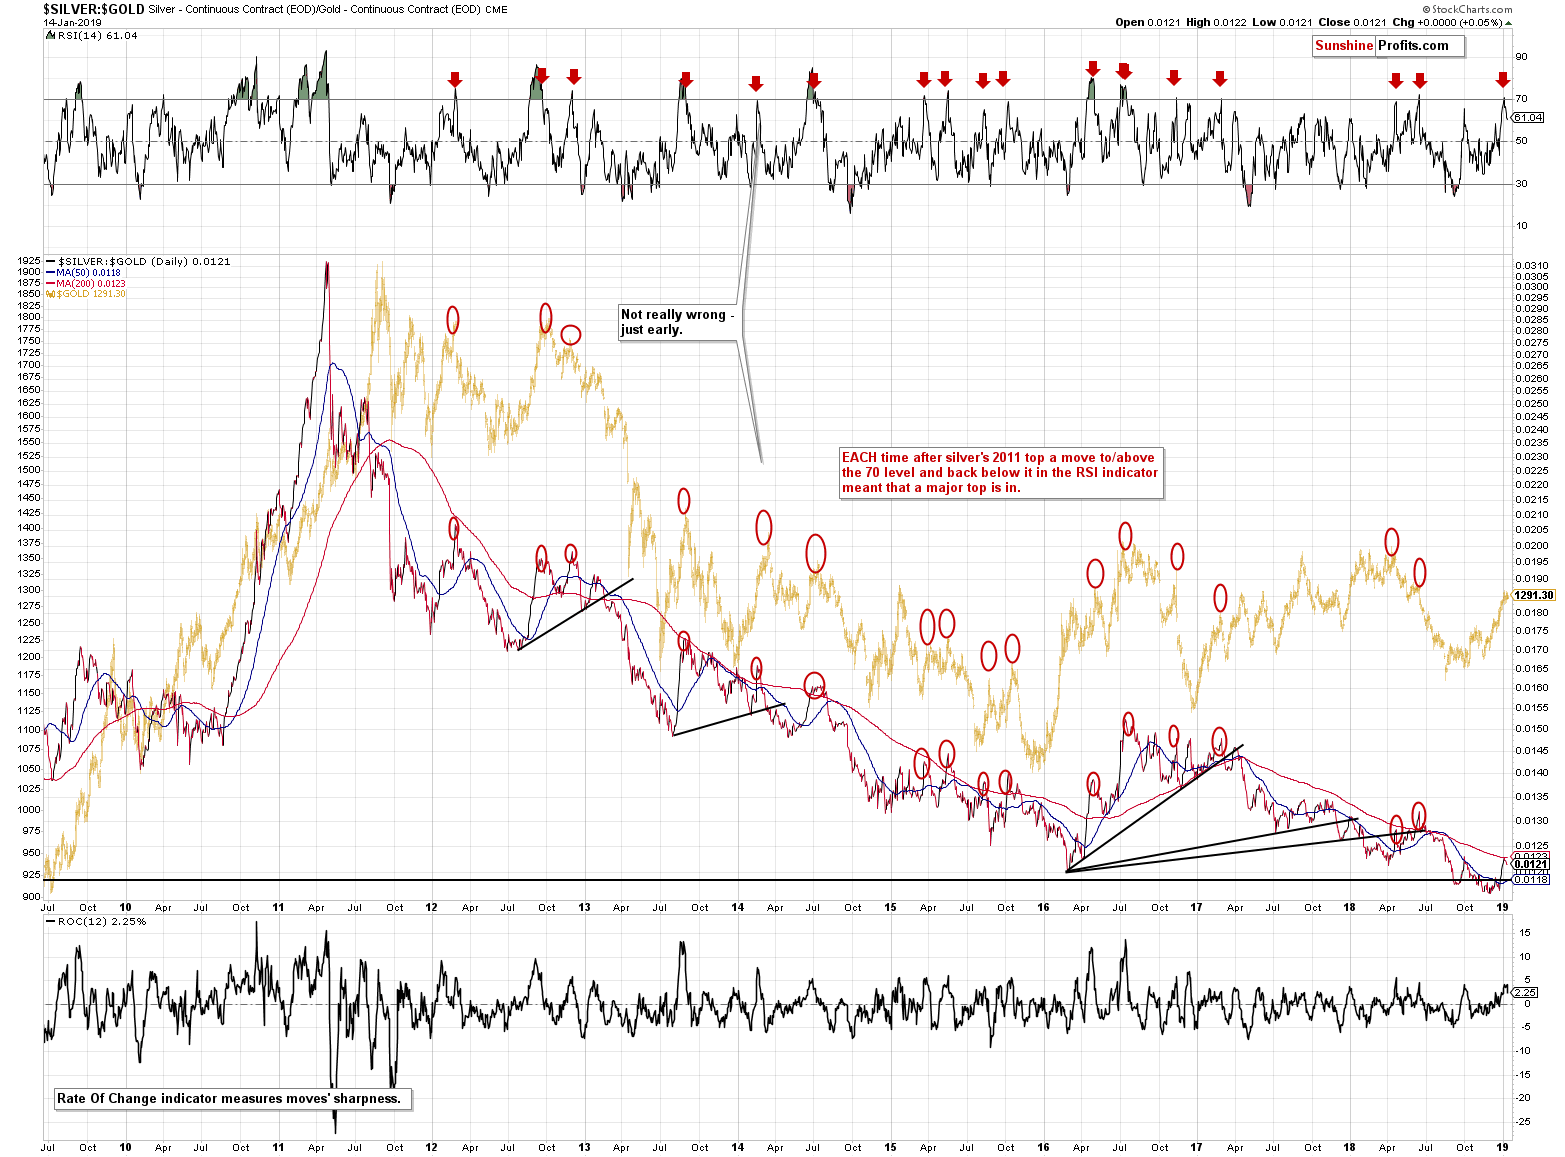
One of the reasons is the highly effective sell signal from the silver to gold ratio.
Last week, we described the silver-gold signal in the following way:
Our loyal readers know already that prior to a decisive move in PMs prices, silver tends to outperform relatively to gold, meaning that the gold to silver ratio moves accordingly down and the silver to gold ratio moves up. We have seen this happen from Christmas Eve onwards, however the dynamic of the downside move in the ratio seems rather exhausted in the last 5 days, supported by the relative and absolute position of RSI, which preceded previous declines in the ratio.
The RSI indicator has even more profound meaning than it appears at the first sight. You see, practically in all cases when the RSI based on the silver to gold ratio moved above the 70 level and then declined back below it, it meant that the top was in. Please look at the red ellipses on the above chart for more details – the efficiency of this indicator is extraordinary, and the implications are strongly bearish.
The signal remains in place – it’s not a very short-term signal, but rather something that’s likely to trigger big moves. Since there was no big move in the precious metals sector yet, and the RSI remains below 70 after just being above it, it means that the big move lower is just ahead.
At this time, you may be wondering if the – more popular – inverse of the above ratio still has a bullish outlook. After all, it moved back below the previous highs, thus invalidating the previous breakout.
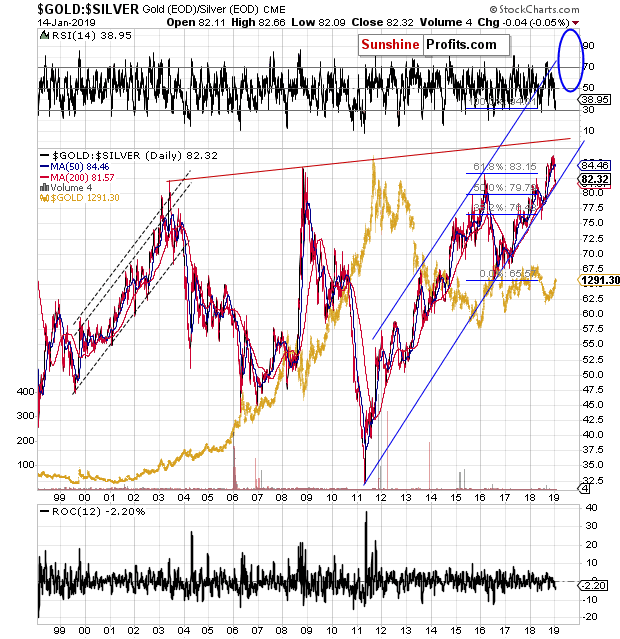
In short, at this time, the implications of the above chart are rather neutral, and we expect them to become decisively bearish shortly.
The bearish news for the ratio is the above-mentioned invalidation of the breakout, and the bullish news is that the ratio moved to the lower border of the rising blue trend channel, without breaking it, thus making at least a bounce likely. The point is that it takes just a bounce for the long-term breakout to be repeated. The former is bearish, while the latter is bullish. Overall the situation is neutral.
Still, based on the signal from the silver to gold ratio (the move in the RSI), and keeping in mind it’s great efficiency, it’s very likely that the silver to gold ratio will move lower, which means that the gold to silver ratio will move higher and thus a breakout above the 2003, 2008, and 2016 highs will once again be a fact.
Let’s move to a different white metal – platinum.
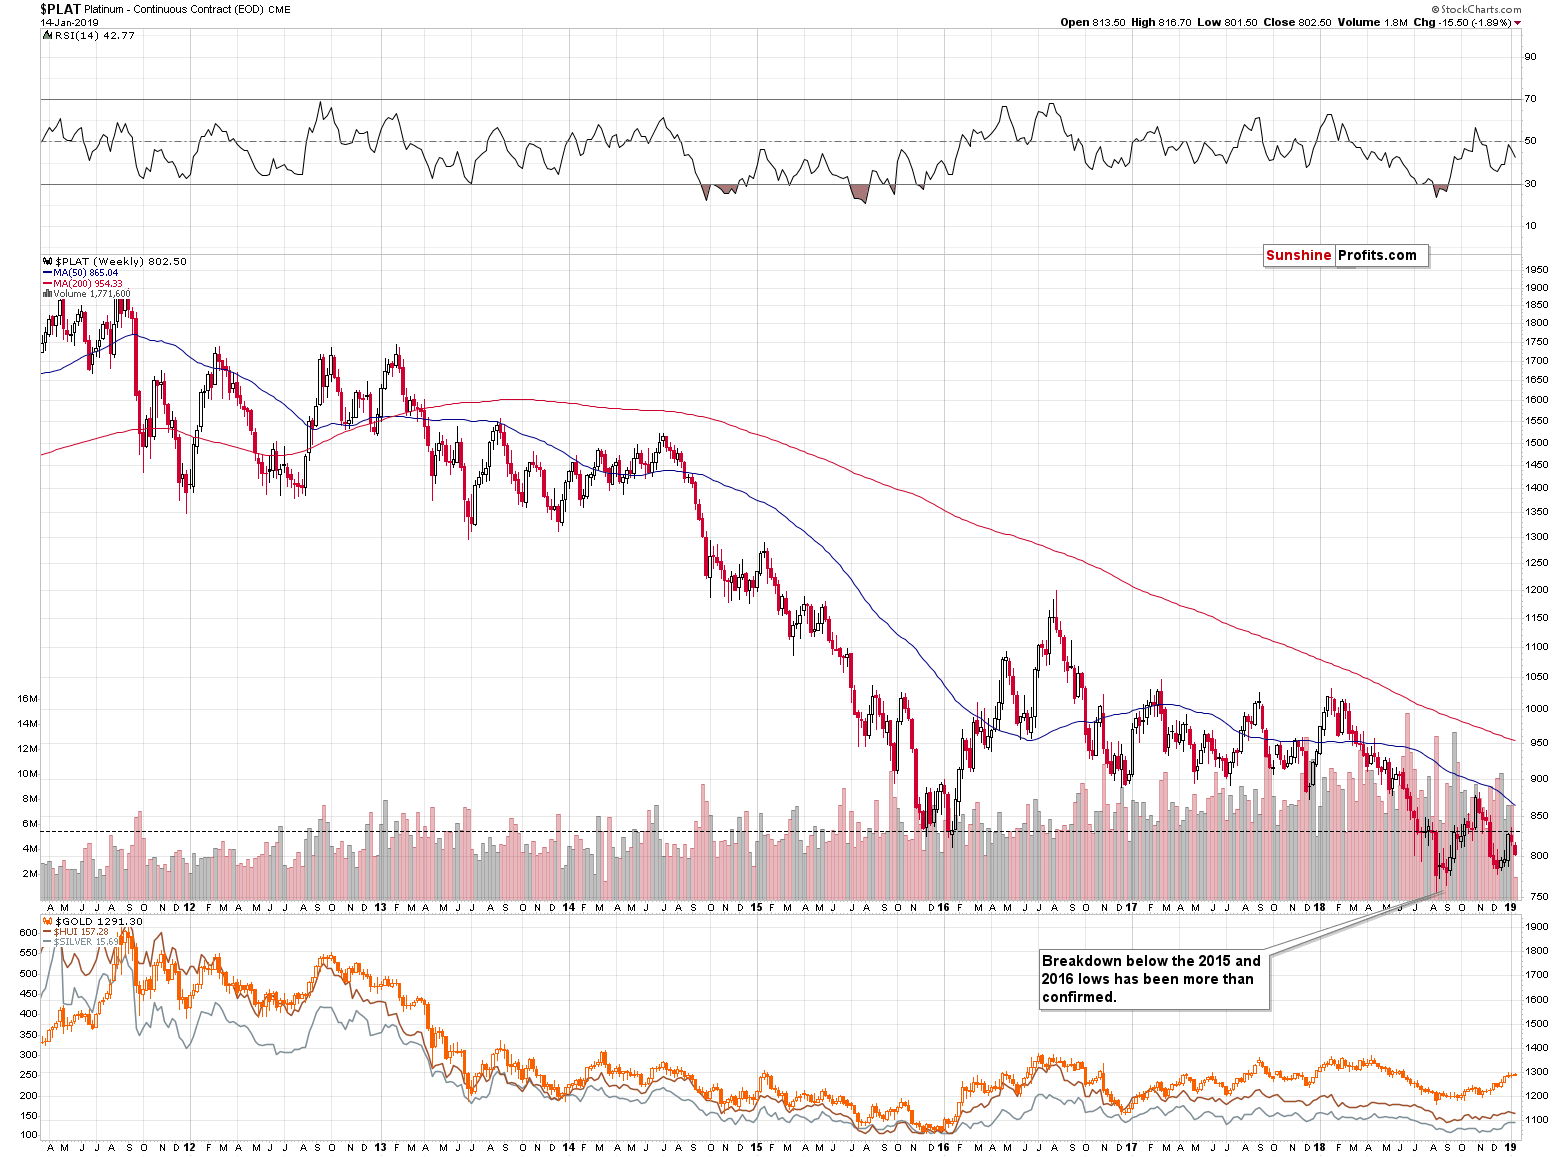
When platinum first tried to break below its 2015 and 2016 lows, this move was quickly invalidated, and we correctly interpreted it as a bullish sign and profited on the following rally in the entire PM sector. However, we didn’t have to wait long for the breakdown to take a more decisive form. After the August slide, the price of platinum recovered. The breakdown was invalidated. But then platinum declined once again and this time the breakdown was simply verified by a move back to the previous lows. There was no invalidation in 2019 – the platinum market was not strong enough.
What does it mean and why are we discussing it? It means that platinum has much further to fall and since the entire precious metals sector often moves together, this suggests significant weakness in gold and silver as well.
Before summarizing, we would like to quote a part of yesterday’s Alert. The issue of handling the delays in price moves is very important and we want to ensure that everyone has the chance to read it. If you read our yesterday’s analysis, you can safely skip the next few paragraphs (the introduction to the issue and then the description thereof).
The prices of gold and silver and the values of mining stocks increased in the past few months despite the bearish long-term signals and the analogy to 2013. At some point, when something doesn’t work, it’s time to drop it and move to things that do work. The 2013 – now link in gold doesn’t appear to be working anymore as gold deviated from it too much. If we take this factor out of the long-term picture, what will remain? What do the up-to-date signals suggest for the prices of metals and mining stocks?
In short, the above changes much less than it seems to be the case at the first sight. The 2013 – now analogy in gold was only one of the long-term factors that made the long-term outlook bearish. For instance, the analogy to 2008 in silver remains in place. Just because the situation in gold is no longer very similar to what happened in 2013, it doesn’t mean that we saw a bullish signal – we simply have one bearish signal less. Does this make the number of bearish signals small enough to change the medium-term outlook? Absolutely not. The 2013-now link in gold may be gone, but new long-term signals emerged in the meantime, making the overall outlook just as bearish. For instance, gold’s link with the stock market and with its volatility and the new medium-term sell signal from the silver to gold ratio that we discussed on Thursday.
So, if the outlook didn’t change, then why is gold not below $1,000 yet?
The outlook didn’t change, but it doesn’t imply the absence of real-world shockers and news that will temporarily move the price. If there’s World War 3, gold would soar regardless of what any chart was suggesting. If there’s a trade war, there will also be a reaction, although not as dramatic. If there’s a series of angry tweets from Trump, market may also react. Does it make the chart analysis useless? Absolutely not. In the majority of cases, the market will move where it’s likely to move, usually once the dust settles after the price-changing news are announced. This means a delay in the expected action and this is most likely what we saw in case of the PMs and miners. The decline didn’t end – it was delayed. As long as the outlook remains bearish, the price is likely to fall – after all that’s what the work outlook means.
If we were able to control the news and the developments, we would “make them” wait until the price reaches the likely price levels. But, of course, this is not possible, and we can only take what the world and the market gives us and analyze it in order to check if the outlook changed or not. While any single piece of news doesn’t depend on us, adjusting the outlook does. And the same goes with the changes in positions.
Consequently, the direct reply to the above question is that gold is not below $1,000 yet because the decline was delayed based on the factors that don’t depend on us. It remains to be the likely outcome anyway. Before moving on to long-term charts, we would like to discuss how these delays can be handled.
Handling the Delays in Big Price Moves
There are generally two ways to handle the delays.
The first way is to be patient and wait for the price to move in tune with its outlook. In this case it’s particularly important to keep re-evaluating the outlook each day to detect the moment when the outlook would change (this may mean changing the target prices and stop-loss levels along the way). This way maximizes the chance of not missing out on the move that’s likely to take place based on the outlook. The price for that is the delay itself, which makes it very difficult for more short-term oriented traders to take advantage of the situation. This also means the need to accept temporarily lower profits (or capital in general) with the goal of making much more when the move finally materializes.
The second way is to become very short-term oriented and focus on more short-term trades (even intraday moves)and thus to make the delays rather irrelevant. The delay in the bigger move doesn’t matter if you’re not aiming to catch it, but instead to profit on many smaller moves. This approach means more regular profits and the inherent mechanism not to hold to a losing trade for too long (narrow stop-loss and profit-take mean that the position would likely be closed shortly after it’s opened). The price for the above is much lower chance of profiting on the big move that was likely based on the outlook.
Both approaches have their merits and the first one is likely to be more profitable in case of strong moves in a given direction, whereas the second one is likely to be more profitable during consolidations. But profitability is not all there is – the latter strategy may simply be more pleasant to follow for the more short-term oriented traders and for those, who have particularly strong aversion to temporary losses.
In case of the current situation in the precious metals market, we are pursuing the first way of dealing with the delay, due to the likely size of the decline. It would simply be a huge waste not to catch this move. Of course, until this move takes place, this strategy will not appear like a good idea as the waiting is not pleasant, to say the least. The delay made the decline more consolidation-like and the second approach might have yielded better results. Of course, we only know it now, after we saw the corrective upswing. Based on the factors that we had available when making the decision, the first way appeared to be a much better choice.
The good news is that realizing that some traders may prefer the latter approach, we are working on providing you with an additional service that will focus on the very short-term moves and frequent (much smaller than the ones on the big moves, but on the other hand likely more consistent) profits. We don’t want to provide a specific launch date for this service, as a lot “depends”, but it’s likely that we’ll introduce it sometime in February or March. We would appreciate your feedback on this idea – your suggestions will help us shape this upcoming service in the form that’s most useful to you.
Feedback and Questions
We received multiple messages with feedback on the above-mentioned idea of introducing a service that would focus on very quick (usually intraday) moves, and we are very grateful for your messages – thank you. Many messages confirmed that this is a good idea and that such a service would be welcome. There were also messages that indicated that keeping the status quo is the preferred choice and that very short-term oriented service would be of little value. Finally, there were messages with questions and concerns, and they can be generally divided into two groups. One group of questions were about your Editor’s strategy / investment philosophy and whether it would change or not, and the second was about technical ramifications of this service – would it be included in the Gold & Silver Trading Alerts, or would it change them in any way.
And that’s exactly why we asked for the feedback in the first place. We want to be sure that if we’re going to do something, it will be done for you, with your best interest in mind. And since many clients have different approaches and goals, our goal is to improve what we do and not harm it in any way, so that everyone (or at least maximum number of subscribers) either benefits or remains unaffected by the above service.
Some people would welcome a very short-term approach, and some would not care about it. But everyone, who currently subscribes to Gold & Silver Trading Alerts should get at least as high level of service as they do right now. Of course, this applies to clients of my (PR) other services as well (private investment fund and managed futures). In fact, this is the top priority – to introduce something new only (!) if it can be done while keeping (or increasing) the quality of what I already provide.
This is closely connected with the issue of your Editor’s investment philosophy. I am not a day-trader and I don’t intend to become one. This simply doesn’t suit my mindset. I prefer to engage in things that are very well researched with multiple confirmations and this research is what results in confidence to take decisions that need to be taken (again based on the research that I strive to conduct as objectively as possible) and then patience. Over the previous decade I tested various approaches and the current combination of insurance, long-term investment capital and trading capital (where traders usually take between a couple of days and a couple of months) seems optimal to me. Therefore, it makes no sense for me to risk damaging my approach by trying to greatly change it. Consequently, it will not be me, who will be providing the signals for the very short-term (I will call them intraday Alerts from now on to make it simpler) Alerts. Therefore, my investment philosophy will not change and what I do in the Gold & Silver Trading Alerts (and in other services) will not be impacted.
So, how could this be done? Pretty much the same way as other Alerts are currently done (like Oil Trading Alerts or Forex Trading Alerts, for example). The signals will come from a high-quality source that I will first validate before featuring it. The initial results are great, but (as I discussed my approach above) more tests and research are still being conducted. We’ll provide it when it’s ready, not sooner.
Technically, it will make most sense to provide these Alerts as separate products (there will most likely be intraday Alerts for all or most markets that we currently cover), not only because some of our subscribers are interested in them, while others are not, but because there will be separate publishing hours and notifications for Gold & Silver Trading Alerts and for the intraday Alerts. It would be pointless to wait with publishing the Gold & Silver Trading Alert, just because there were no intraday signals so far. Or vice-versa – it would be pointless not to send an intraday Alert just because Gold & Silver Trading Alert for the day is not yet ready.
Naturally, there will be a month or so where this type of product will be available for free to our current subscribers, so that everyone who is interested can test how this new service works (in terms of both: publishing, notifications etc., and the performance).
By the way, we are designing this service in the way that would require the least amount of time to use. The signals will likely be provided quickly after they are generated along with entry price, binding profit-take, and stop-loss levels. This means that they would be ready to just be entered into the trading platform, after which one can close their computer. Both: profit-take and stop-loss levels would be relatively narrow, so that it’s very probable that either of them is reached on the day the order was entered.
The entry price is important in this case, because there might be a delay between when the signal is generated and when one can act on it. If it’s obvious that the price already almost moved to the profit-take level, it means that on that given day, it would be better to wait for a signal for a different market or not make any intraday trades on that day at all. However, (and this scenario is much more likely) when one sees that the price has barely moved since the signal was generated, it would imply that the signal remains up-to-date.
If you have any follow-up questions or comments with regard to the above (or anything else that we discuss in the Alerts in general), please let us know.
Summary
Summing up,even though the link between 2013 and now in case of gold is no longer clear, it doesn’t mean that the outlook changed. It was only one of the medium-term factors pointing to much lower gold, silver, and mining stock values in the following months, and the remaining factors (plus a few new ones) continue to justify the very bearish outlook. This means that there is a very high probability of a huge downswing and this is what makes the short position justified, not the outlook for the next few days. The bearish outlook for the following weeks is confirmed by multiple factors, i.a. silver’s extreme outperformance and miners’ underperformance, gold’s performance link with the general stock market, gold getting Cramerized, and the bullish medium-term outlook for the USD Index and bearish outlook for the key part thereof – the Japanese yen.Even if the USD Index moves lower in the next several days, it shouldn’t have a major impact on the prices of PMs. The recent breakdowns in the mining stocks suggest that more weakness in the PM market is just around the corner.
As always, we’ll keep you – our subscribers – informed.
To summarize:
Trading capital (supplementary part of the portfolio; our opinion): Full short positions (250% of the full position) in gold, silver and mining stocks are justified from the risk/reward perspective with the following stop-loss orders and exit profit-take price levels:
- Gold: profit-take exit price: $1,062; stop-loss: $1,313; initial target price for the DGLD ETN: $82.96; stop-loss for the DGLD ETN $44.97
- Silver: profit-take exit price: $12.32; stop-loss: $16.04; initial target price for the DSLV ETN: $47.67; stop-loss for the DSLV ETN $24.68
- Mining stocks (price levels for the GDX ETF): profit-take exit price: $13.12; stop-loss: $22.03; initial target price for the DUST ETF: $80.97; stop-loss for the DUST ETF $20.37
Note: the above is a specific preparation for a possible sudden price drop, it does not reflect the most likely outcome. You will find a more detailed explanation in our August 1st Alert. In case one wants to bet on junior mining stocks’ prices (we do not suggest doing so – we think senior mining stocks are more predictable in the case of short-term trades – if one wants to do it anyway, we provide the details), here are the stop-loss details and target prices:
- GDXJ ETF: profit-take exit price: $17.52; stop-loss: $32.03
- JDST ETF: initial target price: $154.97 stop-loss: $42.17
Long-term capital (core part of the portfolio; our opinion): No positions (in other words: cash)
Insurance capital (core part of the portfolio; our opinion): Full position
Important Details for New Subscribers
Whether you already subscribed or not, we encourage you to find out how to make the most of our alerts and read our replies to the most common alert-and-gold-trading-related-questions.
Please note that the in the trading section we describe the situation for the day that the alert is posted. In other words, it we are writing about a speculative position, it means that it is up-to-date on the day it was posted. We are also featuring the initial target prices, so that you can decide whether keeping a position on a given day is something that is in tune with your approach (some moves are too small for medium-term traders and some might appear too big for day-traders).
Plus, you might want to read why our stop-loss orders are usually relatively far from the current price.
Please note that a full position doesn’t mean using all of the capital for a given trade. You will find details on our thoughts on gold portfolio structuring in the Key Insights section on our website.
As a reminder – “initial target price” means exactly that – an “initial” one, it’s not a price level at which we suggest closing positions. If this becomes the case (like it did in the previous trade) we will refer to these levels as levels of exit orders (exactly as we’ve done previously). Stop-loss levels, however, are naturally not “initial”, but something that, in our opinion, might be entered as an order.
Since it is impossible to synchronize target prices and stop-loss levels for all the ETFs and ETNs with the main markets that we provide these levels for (gold, silver and mining stocks – the GDX ETF), the stop-loss levels and target prices for other ETNs and ETF (among other: UGLD, DGLD, USLV, DSLV, NUGT, DUST, JNUG, JDST) are provided as supplementary, and not as “final”. This means that if a stop-loss or a target level is reached for any of the “additional instruments” (DGLD for instance), but not for the “main instrument” (gold in this case), we will view positions in both gold and DGLD as still open and the stop-loss for DGLD would have to be moved lower. On the other hand, if gold moves to a stop-loss level but DGLD doesn’t, then we will view both positions (in gold and DGLD) as closed. In other words, since it’s not possible to be 100% certain that each related instrument moves to a given level when the underlying instrument does, we can’t provide levels that would be binding. The levels that we do provide are our best estimate of the levels that will correspond to the levels in the underlying assets, but it will be the underlying assets that one will need to focus on regarding the signs pointing to closing a given position or keeping it open. We might adjust the levels in the “additional instruments” without adjusting the levels in the “main instruments”, which will simply mean that we have improved our estimation of these levels, not that we changed our outlook on the markets. We are already working on a tool that would update these levels on a daily basis for the most popular ETFs, ETNs and individual mining stocks.
Our preferred ways to invest in and to trade gold along with the reasoning can be found in the how to buy gold section. Additionally, our preferred ETFs and ETNs can be found in our Gold & Silver ETF Ranking.
As a reminder, Gold & Silver Trading Alerts are posted before or on each trading day (we usually post them before the opening bell, but we don't promise doing that each day). If there's anything urgent, we will send you an additional small alert before posting the main one.
=====
Latest Free Trading Alerts:
Federal government shutdown drags into its fourth week. Will it boost gold prices?
US Government Shuts Down. Will Gold Go Up?
=====
Thank you.
Sincerely,
Przemyslaw Radomski, CFA
Editor-in-chief, Gold & Silver Fund Manager

