

Briefly: in our opinion, full (250% of the regular size of the position) speculative short positions in gold, silver and mining stocks are justified from the risk/reward perspective at the moment of publishing this Alert.
The USD Index declined yesterday, and the gold stocks did exactly the same thing. And so did silver. They both continued to move lower in today’s pre-market trading and so did gold. Surprising? Absolutely not, at least not if you read our previous analyses. What’s likely to happen next given the irregular reaction of the precious metals sector?
In yesterday’s analysis we emphasized the yen’s reversal and how it’s likely to trigger lower values in the PMs and miners. In the previous Alerts, when describing gold’s performance in the euro, we wrote that gold is likely to magnify the bearish signals coming from the USD Index. The flip side of this European coin is that USD’s bullish signals are likely to be ignored either completely or partially. Both factors seem to have contributed to yesterday’s and today’s early performance of the PMs. Let’s take a closer look at them once again.
Yen’s Reversal
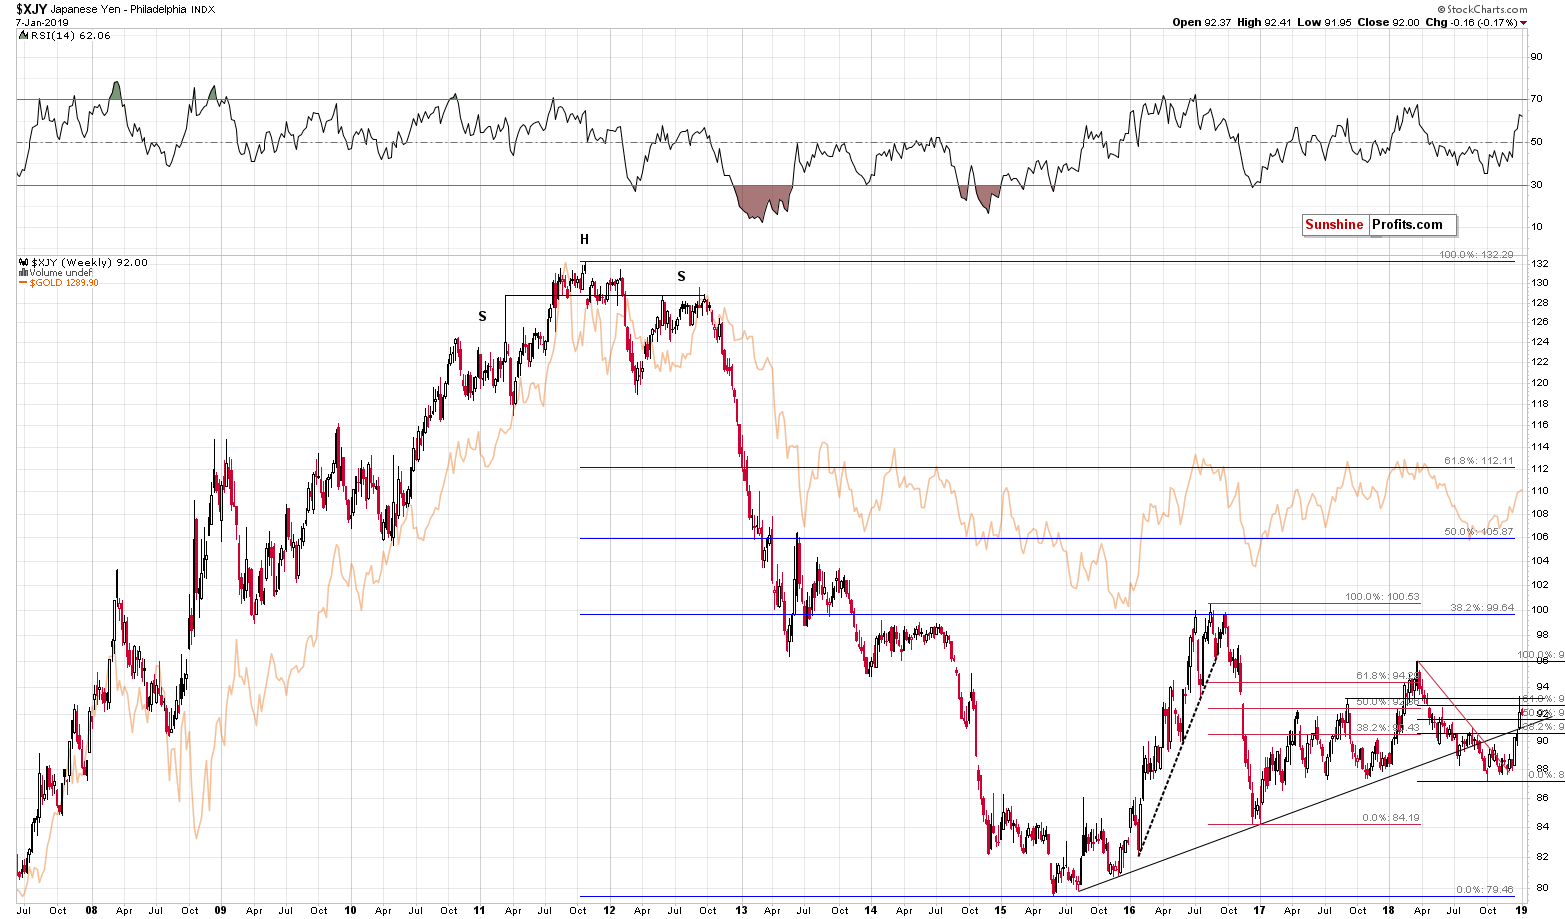
We previously commented on the above yen chart in the following way:
The yen just soared in an extremely sharp manner. That was something unlikely for the Japanese currency as it had already confirmed its breakdown below the rising long-term support line. Yet, every now and then the unlikely has to happen on any market – that’s simply how market, trading, and investing works. It’s not an area where after doing all you can with all the experiences, knowledge, and – most importantly – care, you can simply assume that the result will be correct, like in a math exam. It’s a probabilistic realm and all you can get is bad, average, good, or perhaps great odds of being correct. Nothing more. And this will never be the case with any market. Even cash. Hyperinflation or – in some forms of cash – confiscation or other gov’t regulation. The chance for the above taking place on any single day is very low, but… How many centuries can you find where there was no hyperinflation or when the value of at least one of the popular currencies was not heavily damaged? Of course, cash’s odds of producing (tiny, but still) positive outcome by generating interest are much higher than the odds of making profits on very short-term options. But the point is that the risk is always present. What can one do about it? Accept the fact that at times doing the right thing will not produce a satisfactory outcome, and keep doing what’s right anyway, while keeping the high level of diligence and care. Over time, the effect of uncertainty should level off (there will be positive surprises too) and the high level of diligence and care will keep the general direction positive. The stress coming from not accepting the uncertainty in trading and investing may damage the long-term efficiency and it will definitely cause higher levels of stress (thus impacting most of other areas of life). In general, it’s not easy to be like Fonzie when things look pretty grim, but it simply pays off and non-financial benefits even outweigh the financial ones.
Moving back to the point, the support line in the yen was broken to the upside and a quick rally followed. The question now is if this rally has already ran its course, or should we expect more upside. If yes, then we may have more upside in gold as well given how close the two markets have been recently. If no, then we should brace ourselves for a turnaround in gold as well – also due to the above-mentioned reason.
The odds are that the rally has indeed ran its course.
We just saw a small move above the 61.8% Fibonacci retracement level and these retracements worked very well in the past. The huge 2011 – 2015 rally corrected to its 38.2% Fibonacci retracement (precisely: it moved a bit above it and that was the final top). The 2016 decline corrected to its 61.8% Fibonacci retracement (precisely: it moved a bit above it and that was the final top) – it happened in early 2018. And now, we saw the yen move a bit above the 61.8% retracement that’s based on the 2018 decline.
Moreover, the yen moved to its mid-2017 high, which serves as strong resistance. It’s too early to call last 1.5 years a big head-and-shoulders pattern but if the yen reverses and declines from here, such a formation would be in progress. It would have extremely bearish implications once its completed, just like the huge H&S pattern that we saw between late-2010 and late-2012.
The yen has indeed declined and invalidated the breakouts above both: the 61.8% Fibonacci retracement and the mid-2017 high. If the rally is over – and that appears to be the case – then we can expect the gold price to move lower as well.
Yesterday’s performance simply confirmed the above. The USD Index maybe declined, but the value of the Japanese yen relative to the US currency has declined as well, and the strength of the latter factor was more important. With the bearish outlook for the yen still in place, the implications for gold continue to be bearish. At the moment of writing these words, gold is trading at $1,282, which is considerably below where it was 24 hours ago, and a few dollars below Friday’s closing price.
Gold Price in Terms of the Euro
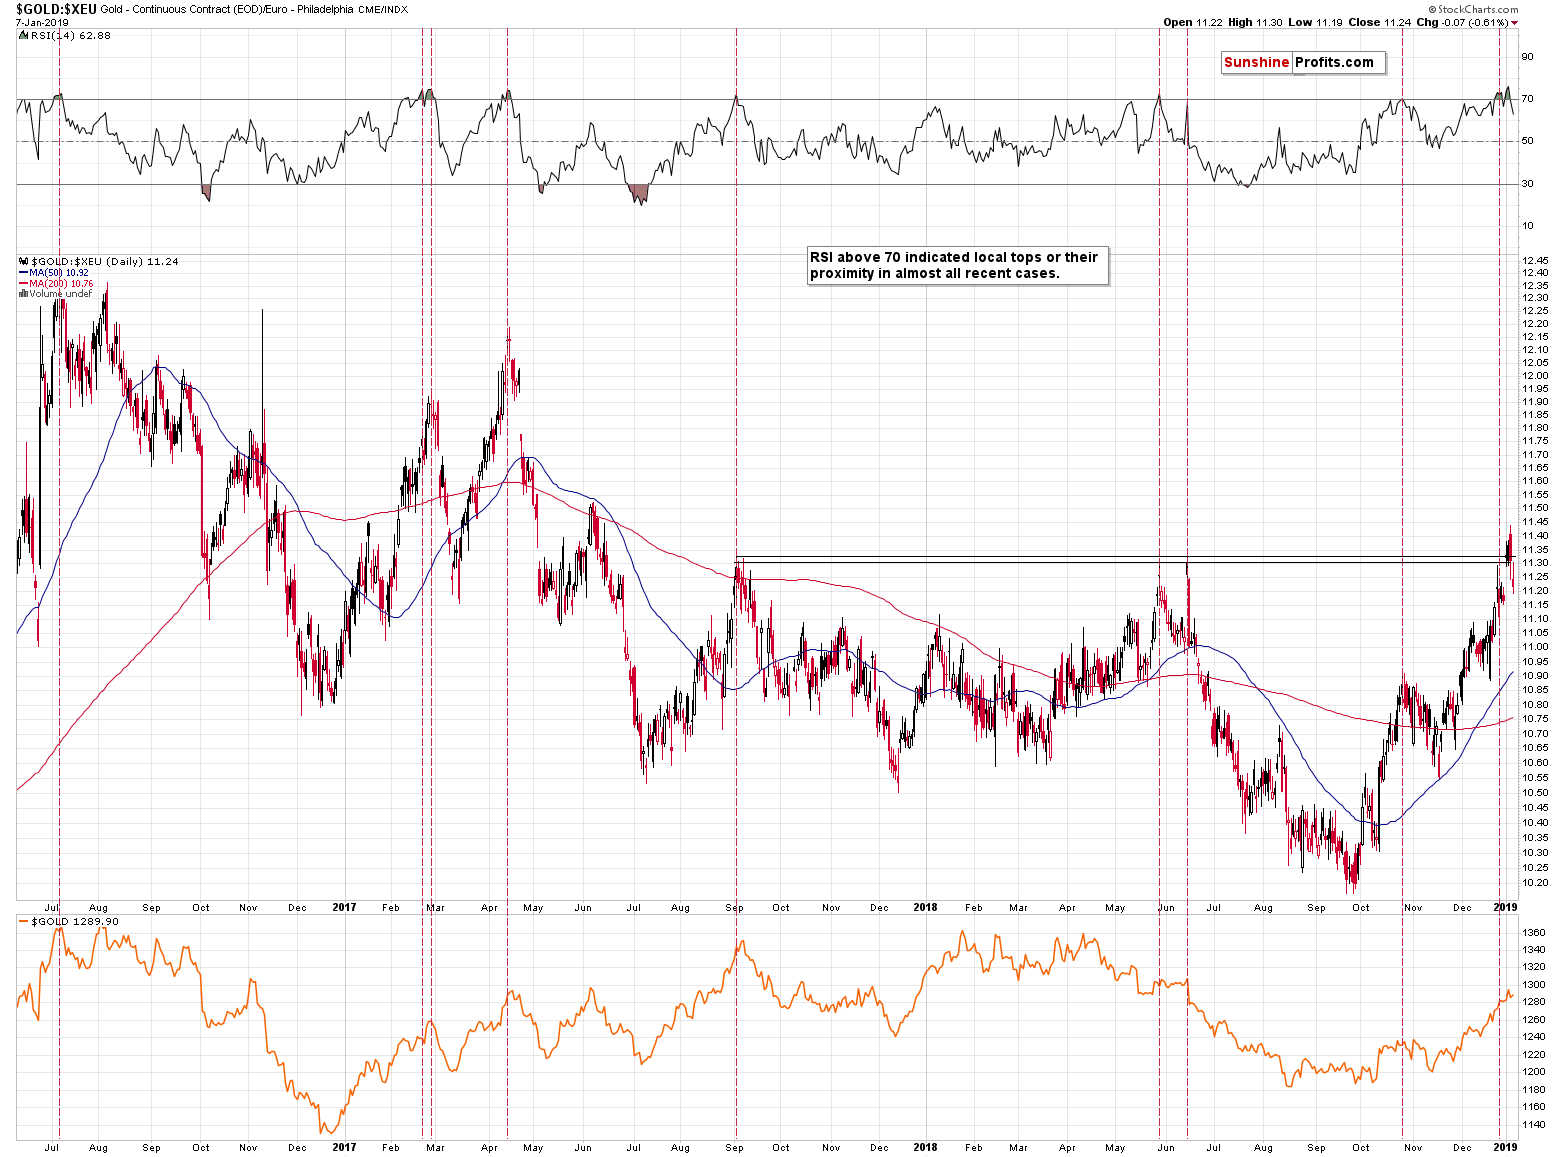
Gold’s price in terms of the euro has just invalidated a small breakout above the mid-2017 and mid-2018 highs. At the same time, the RSI indicator moved below the 70 level, thus flashing a classic sell signal. There are many ways to use the RSI and seeing it decline below 70 is one of such signals. Both factors have bearish implications, not only in terms of the euro.
We marked similar cases (with similarity based on the RSI) with red vertical lines and they corresponded to tops in terms of both: euro (upper part of the chart) and the US dollar (lower part of the chart). This was a highly effective signal.
The implications are bearish in a direct way, but also in the indirect way, because gold’s decline in terms of the euro suggests that gold will decline faster than the euro, should the value of the USD Index increase, based on euro’s weakness.
Having said the above, let’s take a look at what happened in the PMs.
Gold’s USD Analysis
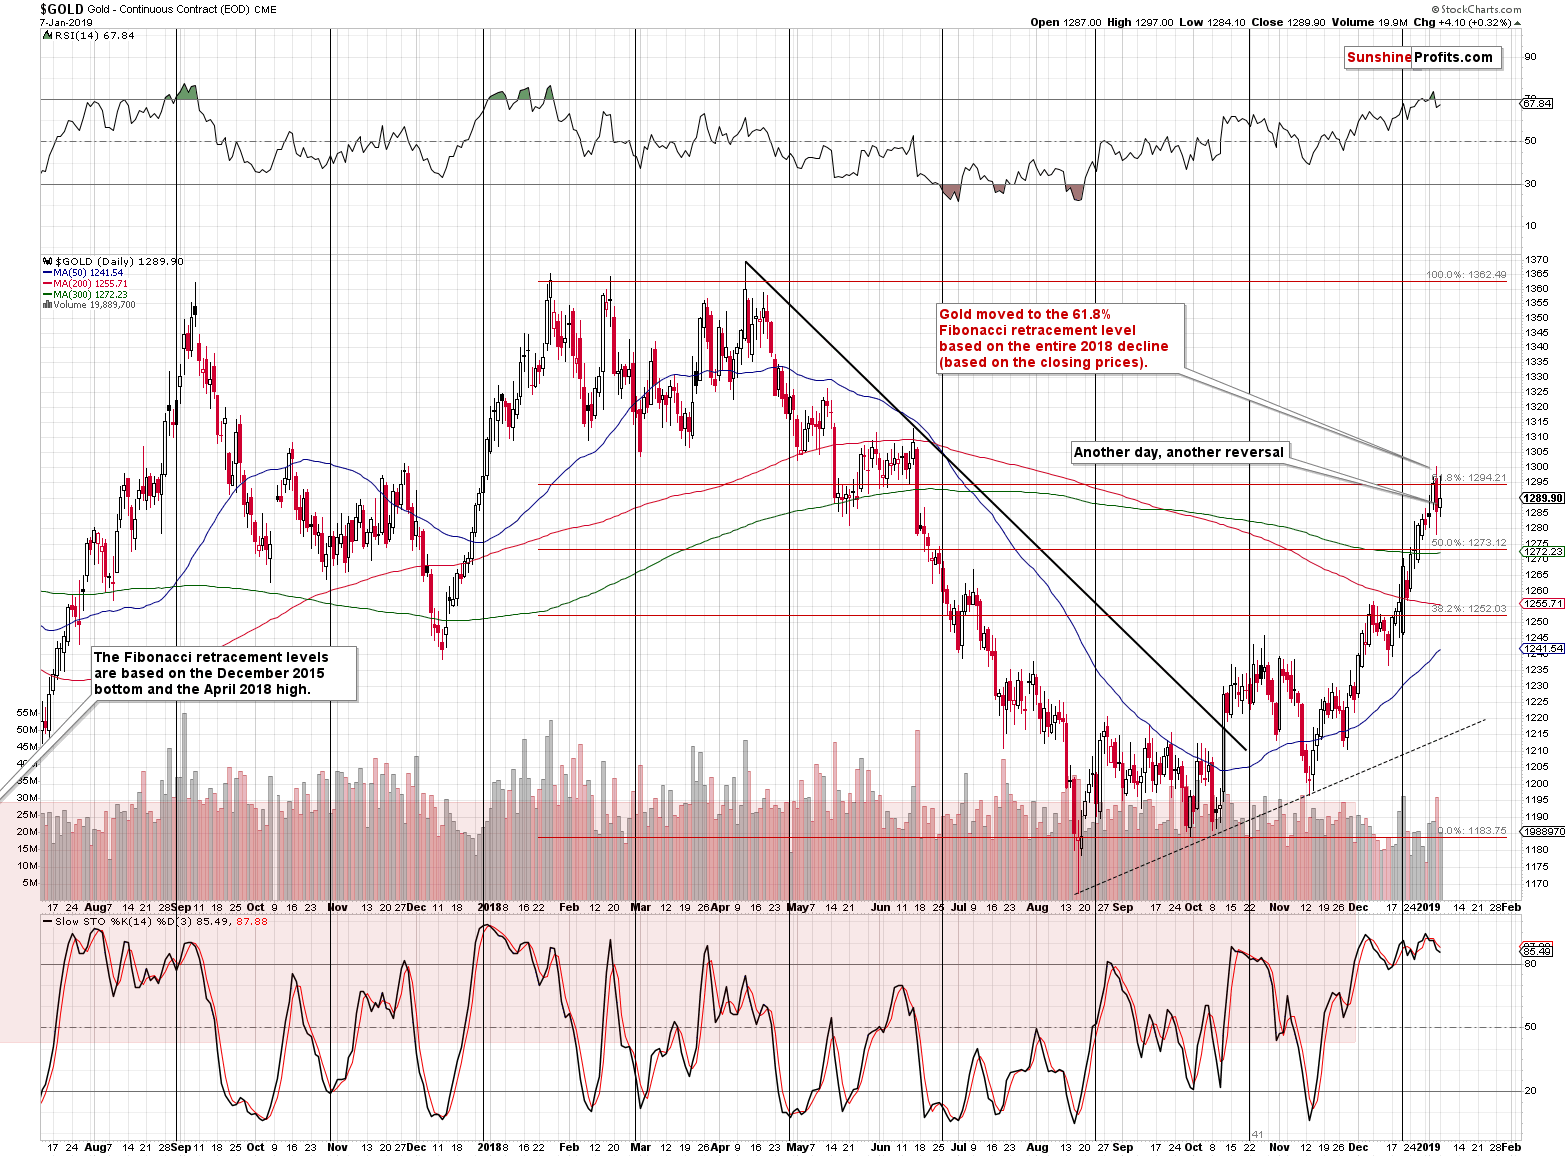
Gold formed another bearish reversal and based on today’s pre-market decline it seems that the decline is just starting. This is a short-term confirmation of what was likely to happen based on the 61.8% Fibonacci retracement being reached. Quoting our previous comments:
Gold moved lower on big volume after the invalidation of the tiny breakout above the 61.8% Fibonacci retracement level. (…)
Gold moved to its own 61.8% Fibonacci retracement level. We marked this level based on the closing prices. This is a big deal, because the Fibonacci retracements tend to work very well for currencies and for the precious metals market. This retracement was just reached while the RSI indicator is above 70, so a turnaround appears very likely based on this chart alone – even without taking the situation in the Japanese yen into account.
Silver’s Small Breather
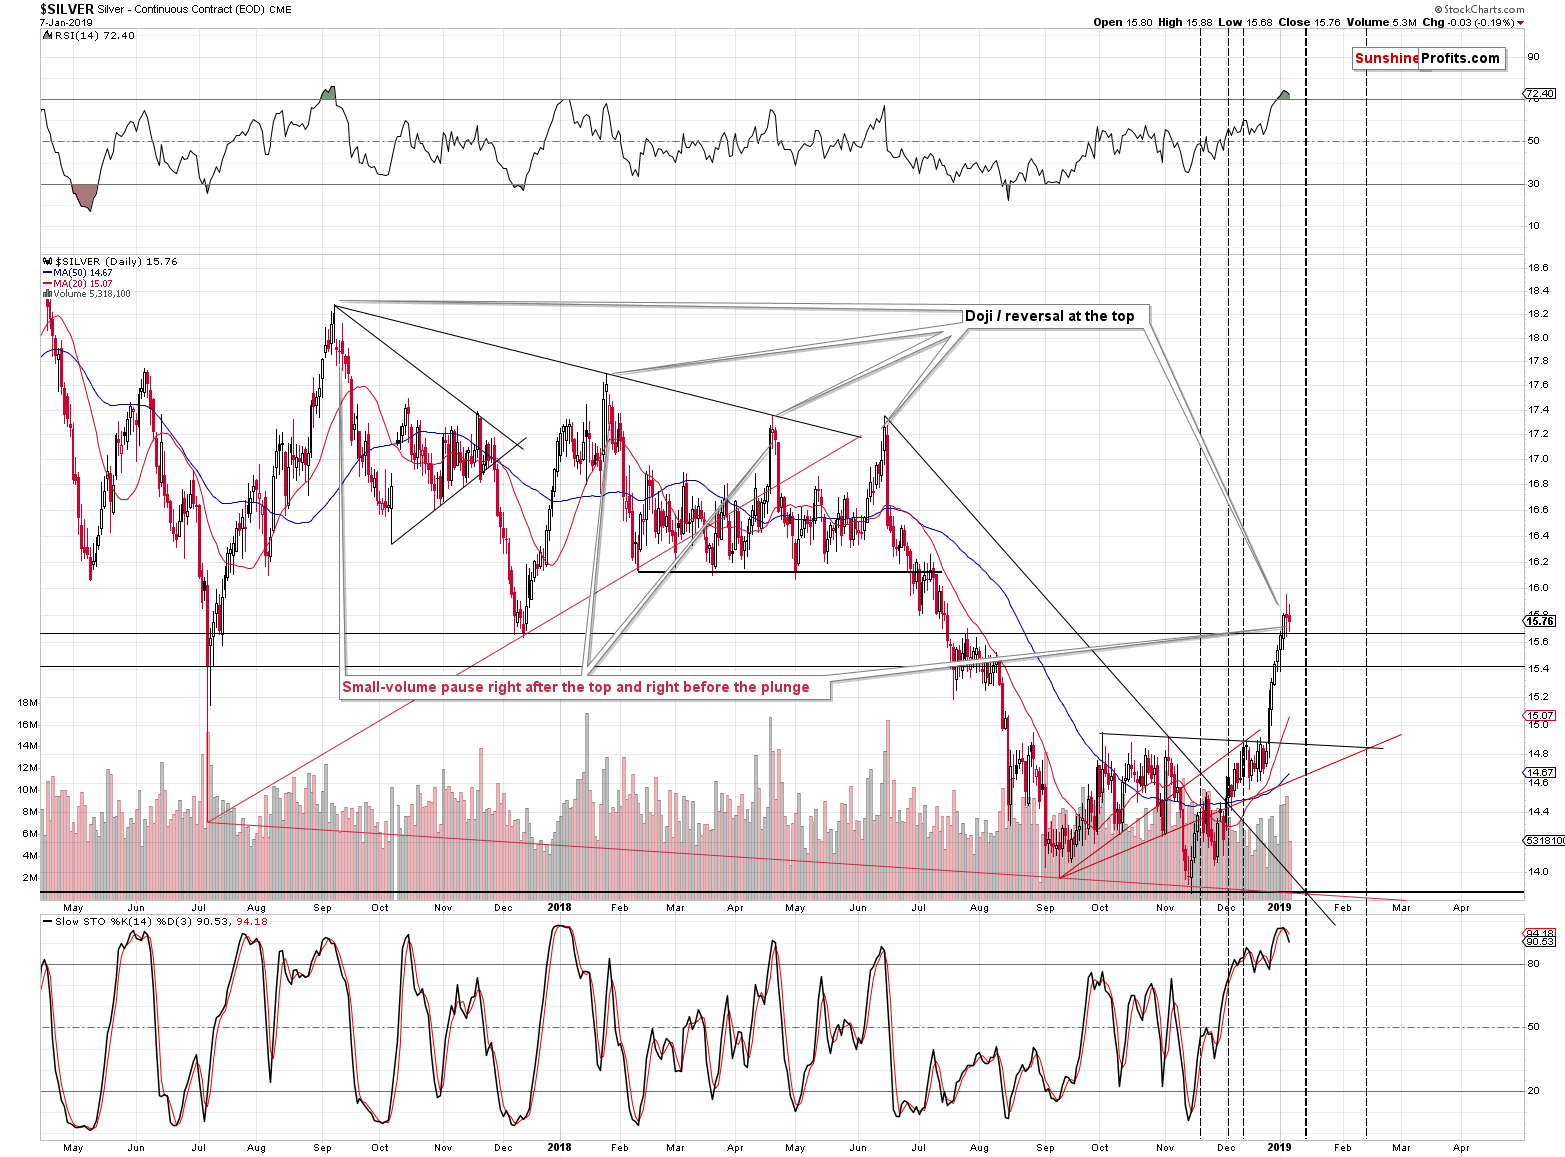
Silver didn’t dive immediately after the long-legged doji formation, which some may view as a bullish sign, but this is not the correct interpretation.
The reason is that we saw an analogous relatively-low-volume pause in case of 3 out of 4 previous major tops. Silver declined only after taking a small breather after the high-volume top. So far silver is down to only $15.56 (at the moment of writing these words), which is a decline, but not a particularly spectacular one.
It seems that it’s only a matter of (short) time before silver truly dives, just like it used to do right after the previous tops. What we’re likely to see in the coming weeks and months may make many of the previous volatile declines seem insignificant and rather calm.
Miners’ Breakdown Remains Intact
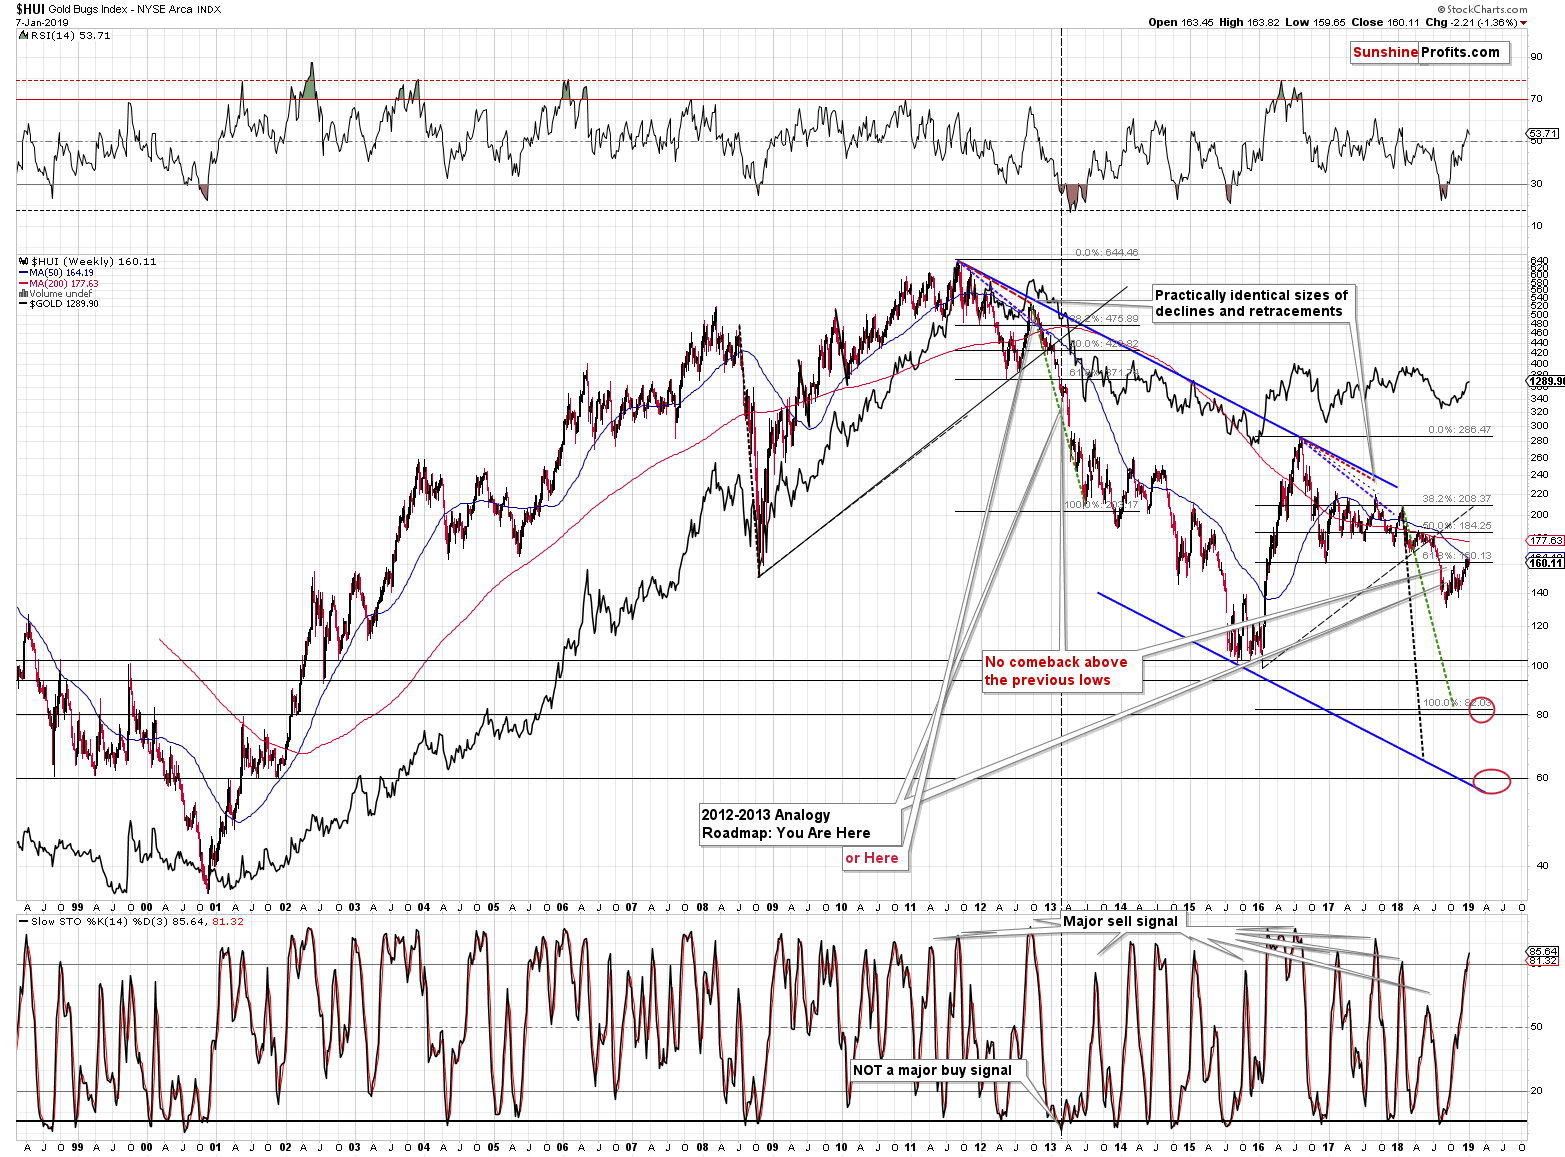
As far as the mining stocks are concerned, the key thing is still the fact that the breakdown below the late-2016 low was not invalidated. This makes the outlook very bearish, because the only strong support that there was near the current price was broken and the breakdown was more than verified. This means that the price is now likely to decline to the next support and the next support is all the way down at the late-2015 / early-2016 lows.
Summary
Summing up, this prolonged correction within the big downtrend has been very tiring, but based on the long-term factors being patient was very well worth it, and based on the short-term signs it seems that the waiting is over or about to be over. The outlook for the precious metals market remains very bearish for the following weeks and months and short position remains justified from the risk to reward point of view, even if we see a few extra days of back and forth trading or even a small brief upswing. There is a very high probability of a huge downswing that makes the short position justified, not the outlook for the next few days. It's confirmed by multiple factors, i.a. silver’s extreme outperformance and miners’ underperformance, gold’s performance link with the general stock market, gold getting Cramerized, and the bullish outlook for the USD Index and bearish outlook for the key part thereof – the Japanese yen.
As always, we’ll keep you – our subscribers – informed.
To summarize:
Trading capital (supplementary part of the portfolio; our opinion): Full short positions (250% of the full position) in gold, silver and mining stocks are justified from the risk/reward perspective with the following stop-loss orders and exit profit-take price levels:
- Gold: profit-take exit price: $1,062; stop-loss: $1,313; initial target price for the DGLD ETN: $82.96; stop-loss for the DGLD ETN $44.97
- Silver: profit-take exit price: $12.32; stop-loss: $16.04; initial target price for the DSLV ETN: $47.67; stop-loss for the DSLV ETN $24.68
- Mining stocks (price levels for the GDX ETF): profit-take exit price: $13.12; stop-loss: $22.03; initial target price for the DUST ETF: $80.97; stop-loss for the DUST ETF $20.37
Note: the above is a specific preparation for a possible sudden price drop, it does not reflect the most likely outcome. You will find a more detailed explanation in our August 1st Alert. In case one wants to bet on junior mining stocks’ prices (we do not suggest doing so – we think senior mining stocks are more predictable in the case of short-term trades – if one wants to do it anyway, we provide the details), here are the stop-loss details and target prices:
- GDXJ ETF: profit-take exit price: $17.52; stop-loss: $32.03
- JDST ETF: initial target price: $154.97 stop-loss: $42.17
Long-term capital (core part of the portfolio; our opinion): No positions (in other words: cash)
Insurance capital (core part of the portfolio; our opinion): Full position
Important Details for New Subscribers
Whether you already subscribed or not, we encourage you to find out how to make the most of our alerts and read our replies to the most common alert-and-gold-trading-related-questions.
Please note that the in the trading section we describe the situation for the day that the alert is posted. In other words, it we are writing about a speculative position, it means that it is up-to-date on the day it was posted. We are also featuring the initial target prices, so that you can decide whether keeping a position on a given day is something that is in tune with your approach (some moves are too small for medium-term traders and some might appear too big for day-traders).
Plus, you might want to read why our stop-loss orders are usually relatively far from the current price.
Please note that a full position doesn’t mean using all of the capital for a given trade. You will find details on our thoughts on gold portfolio structuring in the Key Insights section on our website.
As a reminder – “initial target price” means exactly that – an “initial” one, it’s not a price level at which we suggest closing positions. If this becomes the case (like it did in the previous trade) we will refer to these levels as levels of exit orders (exactly as we’ve done previously). Stop-loss levels, however, are naturally not “initial”, but something that, in our opinion, might be entered as an order.
Since it is impossible to synchronize target prices and stop-loss levels for all the ETFs and ETNs with the main markets that we provide these levels for (gold, silver and mining stocks – the GDX ETF), the stop-loss levels and target prices for other ETNs and ETF (among other: UGLD, DGLD, USLV, DSLV, NUGT, DUST, JNUG, JDST) are provided as supplementary, and not as “final”. This means that if a stop-loss or a target level is reached for any of the “additional instruments” (DGLD for instance), but not for the “main instrument” (gold in this case), we will view positions in both gold and DGLD as still open and the stop-loss for DGLD would have to be moved lower. On the other hand, if gold moves to a stop-loss level but DGLD doesn’t, then we will view both positions (in gold and DGLD) as closed. In other words, since it’s not possible to be 100% certain that each related instrument moves to a given level when the underlying instrument does, we can’t provide levels that would be binding. The levels that we do provide are our best estimate of the levels that will correspond to the levels in the underlying assets, but it will be the underlying assets that one will need to focus on regarding the signs pointing to closing a given position or keeping it open. We might adjust the levels in the “additional instruments” without adjusting the levels in the “main instruments”, which will simply mean that we have improved our estimation of these levels, not that we changed our outlook on the markets. We are already working on a tool that would update these levels on a daily basis for the most popular ETFs, ETNs and individual mining stocks.
Our preferred ways to invest in and to trade gold along with the reasoning can be found in the how to buy gold section. Additionally, our preferred ETFs and ETNs can be found in our Gold & Silver ETF Ranking.
As a reminder, Gold & Silver Trading Alerts are posted before or on each trading day (we usually post them before the opening bell, but we don't promise doing that each day). If there's anything urgent, we will send you an additional small alert before posting the main one.
=====
Latest Free Trading Alerts:
December payrolls were strong – but gold prices rose. What happened?
Did Strong December Payrolls Push Gold Prices Up?
=====
Thank you.
Sincerely,
Przemyslaw Radomski, CFA
Editor-in-chief, Gold & Silver Fund Manager

