

Briefly: in our opinion, full (250% of the regular size of the position) speculative short positions in gold, silver and mining stocks are justified from the risk/reward perspective at the moment of publishing this Alert.
The USD Index declined yesterday, just like it was likely to, but precious metals’ reaction was dimmed. Gold and gold stocks moved a bit higher, but even though USD moved to new lows, there were no new highs in the former. Silver didn’t move much higher either. Why would this be the case? Since the USD Index seems to have more downside, will metals and miners soar shortly, like a coiled spring that’s about to be let loose?
In our view, that’s very unlikely and we already explained it yesterday. In short, gold, silver, and mining stocks reached their respective resistance levels and they all seem to have topped. We saw several confirmations thereof, and the most important with regard to the above discussion, is the weakening of the reaction to lower USD values.
In yesterday’s Alert, we wrote the following about the USD Index, it’s downside target and the gold-USDX link:
The Gold – USDX Link
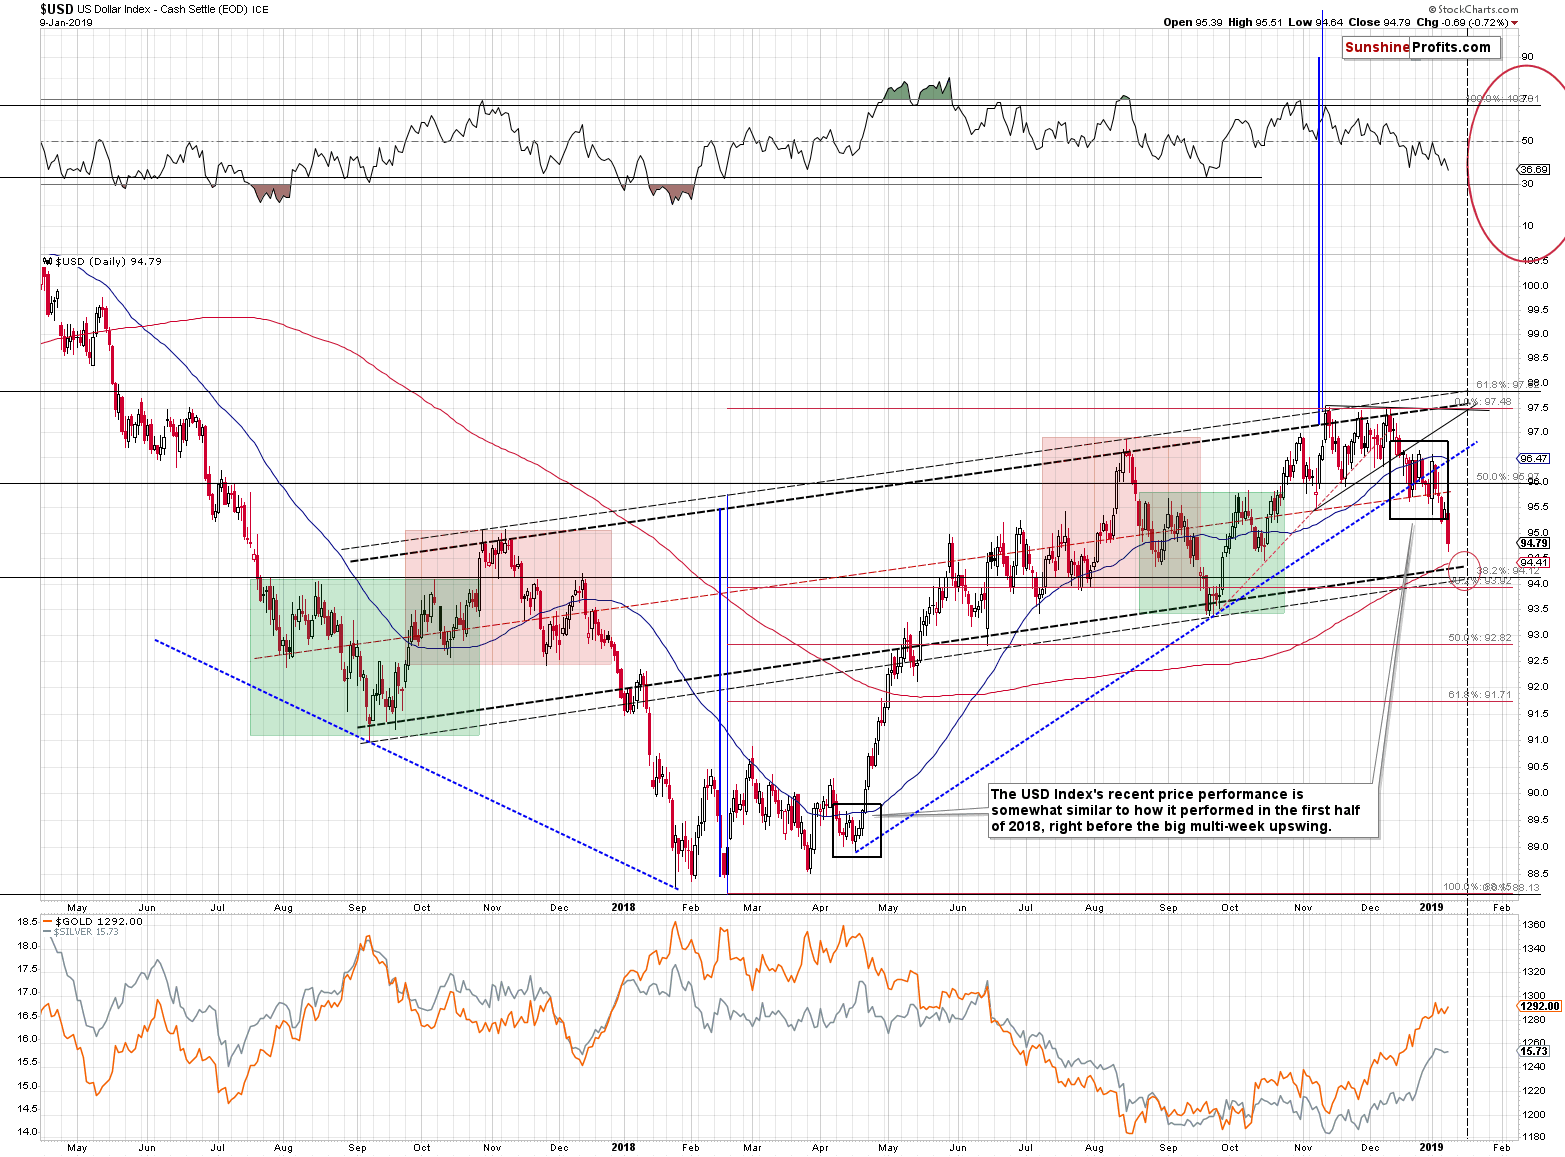
The USD Index had previously quickly invalidated its breakdown below the rising blue support line, but this wasn’t the case in the last few days. This time, the breakdown below the rising blue support line was just confirmed, which is a bearish sign for the very short term.
We marked the possible downside target for the USD Index, while at the same time keeping the big upside target as well. The rally after the final bottom could be sharp, so both targets could be reached.
The downside target is approximately between 94 and 94.5. That’s about 1 – 1.5 index point decline from the current levels. This approximately means doubling the decline from this year’s top (January 2nd) to the current level. This may seem like a big deal for the precious metals investors, but actually it isn’t one.
The reason is the weakening in the strength of reaction to USD’s bearish signals that we recently discussed by examining gold’s performance in terms of the euro. Gold and silver simply refuse to rally on lower USDX as their respective resistance levels were already reached. On January 2nd, gold closed at $1,284 while silver closed at $15.65. That’s more or less where both metals are right now. Consequently, the repeat of the Jan 2nd – today performance wouldn’t mean practically anything for the PMs.
In other words, while the USD Index may decline in the next several days, the precious metals sector is not likely to rally in a meaningful way based on it. However, if the USD Index moves higher (and the yen declines in value), gold and silver will likely plunge. The above (just the above, without taking other factors into account) appears to have only mildly bearish implications for gold and silver, but at the same time it’s definitely justified to keep the short positions intact. This may seem surprising, but it is really the case.
While probability of small upswing and big declines in the next few days may be similar for the PMs (thus implications may appear neutral or close to neutral), the likely size of the moves are not. The upside potential for the PMs appears very limited, while the downside potential is huge. Moreover, adding more factors to this picture – the ones that we described previously – makes the current short position definitely justified from the risk to reward point of view.
The above remains up-to-date. The USDX moved to 94.64 yesterday, which is close to the target area that we mentioned yesterday (94 – 94.5), but not yet in it. Consequently, we may see a bit more weakness in the following hours and – perhaps – days. The key thing is that the lower border of the target area will be reached if yesterday’s decline is simply doubled (approximately).
Let’s see how the PMs fared yesterday.
Precious Metals’ Small Rally
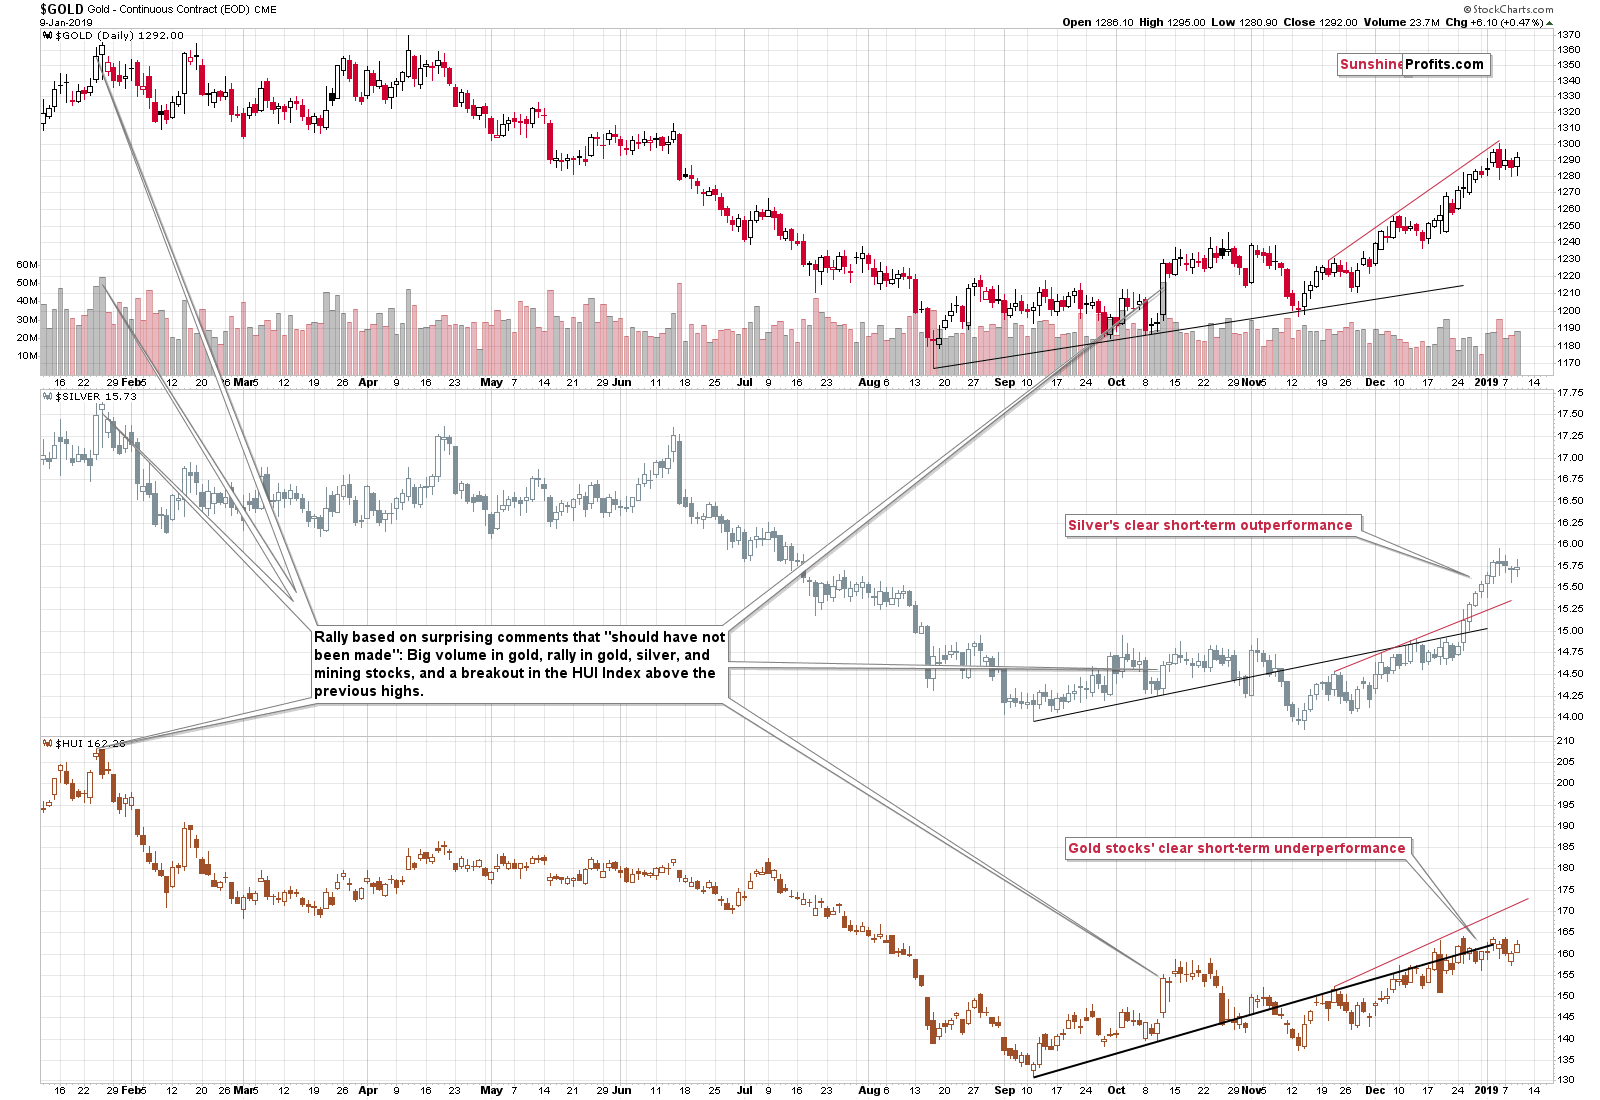
Gold was up by just $6 and none of the intraday highs (in gold, silver, and mining stocks) exceeded the previous intraday highs. We can say the same thing about the closing prices. This confirms our previous comments – the PMs and miners are not willing to react to USD’s weakness.
If the strength of the reaction stays at the same level and the USDX declines by as much as it declined yesterday, then it’s natural to expect PMs to approximately repeat their yesterday’s performance as well. Another $6 upswing in gold is a very small move and not something that would justify making changes to the current position, especially that the USD Index might bottom and rally from the middle or upper part of the target area, it doesn’t have to necessarily decline to the lowest part thereof.
Silver’s Outperformance – the Grand Finale
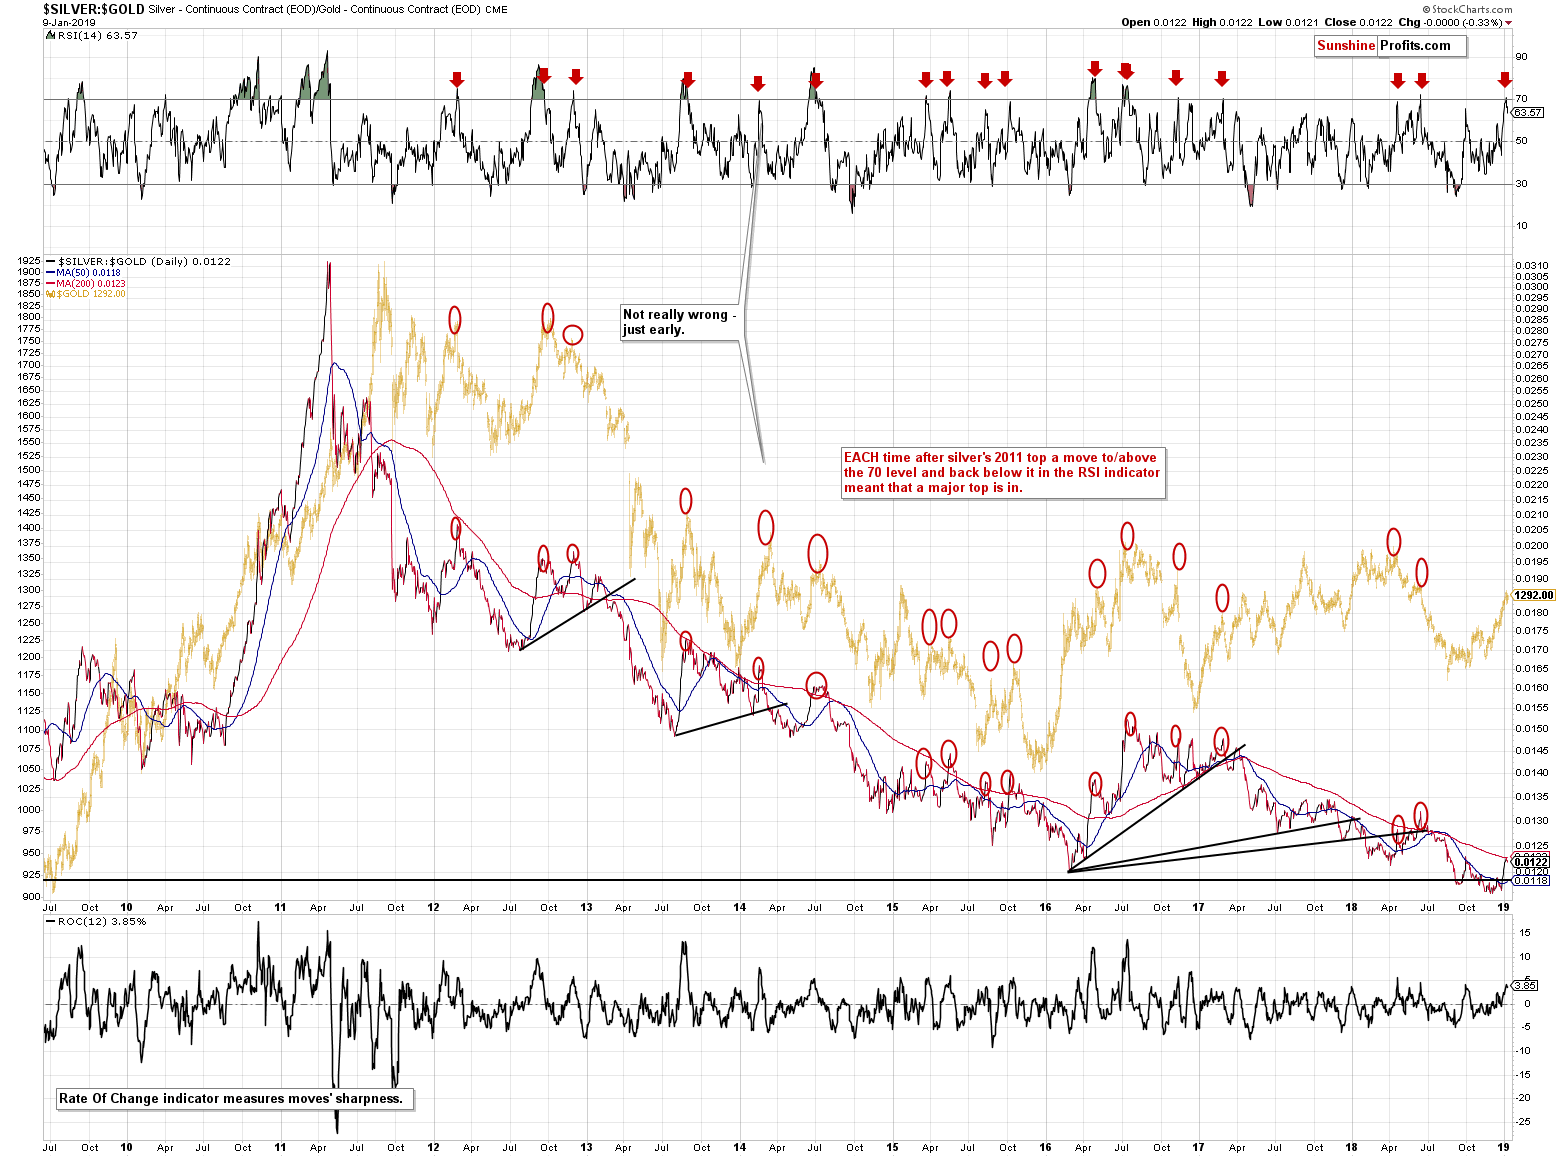
Staying with the short-term, let's examine the gold-silver ratio, and more precisely, it’s inverse version, the silver to gold ratio.
Our loyal readers know already that prior to a decisive move in PMs prices, silver tends to outperform relatively to gold, meaning that the gold to silver ratio moves accordingly down and the silver to gold ratio moves up. We have seen this happen from Christmas Eve onwards, however the dynamic of the downside move in the ratio seems rather exhausted in the last 5 days, supported by the relative and absolute position of RSI, which preceded previous declines in the ratio.
The RSI indicator has even more profound meaning than it appears at the first sight. You see, practically in all cases when the RSI based on the silver to gold ratio moved above the 70 level and then declined back below it, it meant that the top was in. Please look at the red ellipses on the above chart for more details – the efficiency of this indicator is extraordinary, and the implications are strongly bearish.
Before summarizing, we would like to get back to the discussion of stock market’s volatility and its likely impact on the price of gold.
Extreme Gold – VIX Correlation
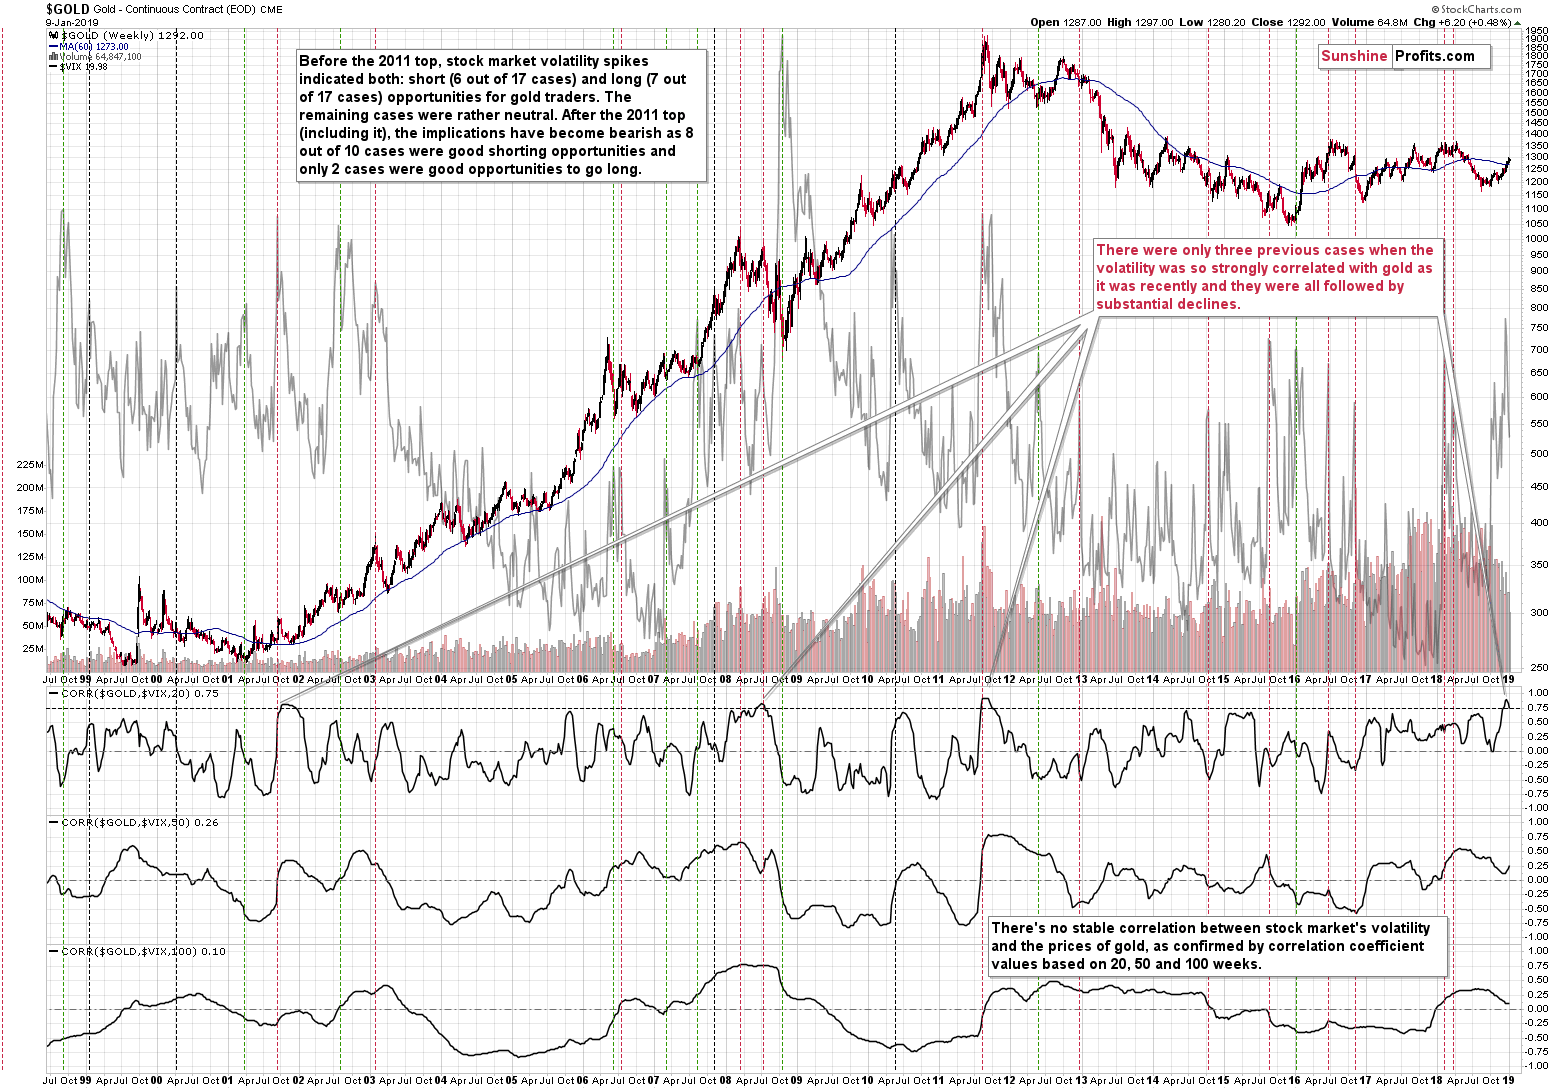
We previously wrote that the spikes in volatility tend to correspond to spike tops in gold (8 out of 10 cases since 2011 – marked with vertical, dashed lines) and thus the implications of the most recent volatile slide in stocks were actually bearish, even though mainstream analysts will almost always tell you that gold will rise on plunging stocks (and they will almost never discuss 2008 when gold and stocks plunged together).
At the first sight it may appear that the above was incorrect on our part, because gold moved higher, but this is not true. When we wrote the above, the spike was not completed yet and it definitely appears to be completed now.
It’s not only because of the level that the VIX achieved (temporarily breaking above all local highs after 2011), and it’s not only because of the seemingly dovish comments from the Fed. It’s also because of the 20-week correlation reading between gold and VIX. While there is no stable link between stock market volatility and gold (it changes over time), when gold rallies along with VIX and the correlation between them becomes excessive (here: above 0.75, which we emphasized on the chart with a horizontal dashed line), it’s a strong bearish sign.
We saw this only 3 times in the past:
- in 2001 – that was what started one of the biggest declines of the bull market up-to-date (mostly because the bull market was very young at that time, but still)
- in 2008 – the second top that was followed by the huge declines (definitely one of the biggest ones that we saw in the past two decades)
- in 2011 – at THE top
The fourth time is right now. And the correlation has already turned down, thus confirming that the top is already in. Given the extreme nature of the analogies, the implications for the medium term are extremely bearish.
Summary
Summing up, this prolonged correction within the big downtrend has been very tiring, but based on the long-term factors being patient was very well worth it, and based on the short-term signs it seems that the waiting is over or about to be over. The outlook for the precious metals market remains very bearish for the following weeks and months and short position remains justified from the risk to reward point of view, even if we see a few extra days of back and forth trading or even a small brief upswing. There is a very high probability of a huge downswing that makes the short position justified, not the outlook for the next few days. It's confirmed by multiple factors, i.a. silver’s extreme outperformance and miners’ underperformance, gold’s performance link with the general stock market, gold getting Cramerized, and the bullish medium-term outlook for the USD Index and bearish outlook for the key part thereof – the Japanese yen. Even if the USD Index moves lower in the next several days, it shouldn’t have a major impact on the prices of PMs.
As always, we’ll keep you – our subscribers – informed.
To summarize:
Trading capital (supplementary part of the portfolio; our opinion): Full short positions (250% of the full position) in gold, silver and mining stocks are justified from the risk/reward perspective with the following stop-loss orders and exit profit-take price levels:
- Gold: profit-take exit price: $1,062; stop-loss: $1,313; initial target price for the DGLD ETN: $82.96; stop-loss for the DGLD ETN $44.97
- Silver: profit-take exit price: $12.32; stop-loss: $16.04; initial target price for the DSLV ETN: $47.67; stop-loss for the DSLV ETN $24.68
- Mining stocks (price levels for the GDX ETF): profit-take exit price: $13.12; stop-loss: $22.03; initial target price for the DUST ETF: $80.97; stop-loss for the DUST ETF $20.37
Note: the above is a specific preparation for a possible sudden price drop, it does not reflect the most likely outcome. You will find a more detailed explanation in our August 1st Alert. In case one wants to bet on junior mining stocks’ prices (we do not suggest doing so – we think senior mining stocks are more predictable in the case of short-term trades – if one wants to do it anyway, we provide the details), here are the stop-loss details and target prices:
- GDXJ ETF: profit-take exit price: $17.52; stop-loss: $32.03
- JDST ETF: initial target price: $154.97 stop-loss: $42.17
Long-term capital (core part of the portfolio; our opinion): No positions (in other words: cash)
Insurance capital (core part of the portfolio; our opinion): Full position
Important Details for New Subscribers
Whether you already subscribed or not, we encourage you to find out how to make the most of our alerts and read our replies to the most common alert-and-gold-trading-related-questions.
Please note that the in the trading section we describe the situation for the day that the alert is posted. In other words, it we are writing about a speculative position, it means that it is up-to-date on the day it was posted. We are also featuring the initial target prices, so that you can decide whether keeping a position on a given day is something that is in tune with your approach (some moves are too small for medium-term traders and some might appear too big for day-traders).
Plus, you might want to read why our stop-loss orders are usually relatively far from the current price.
Please note that a full position doesn’t mean using all of the capital for a given trade. You will find details on our thoughts on gold portfolio structuring in the Key Insights section on our website.
As a reminder – “initial target price” means exactly that – an “initial” one, it’s not a price level at which we suggest closing positions. If this becomes the case (like it did in the previous trade) we will refer to these levels as levels of exit orders (exactly as we’ve done previously). Stop-loss levels, however, are naturally not “initial”, but something that, in our opinion, might be entered as an order.
Since it is impossible to synchronize target prices and stop-loss levels for all the ETFs and ETNs with the main markets that we provide these levels for (gold, silver and mining stocks – the GDX ETF), the stop-loss levels and target prices for other ETNs and ETF (among other: UGLD, DGLD, USLV, DSLV, NUGT, DUST, JNUG, JDST) are provided as supplementary, and not as “final”. This means that if a stop-loss or a target level is reached for any of the “additional instruments” (DGLD for instance), but not for the “main instrument” (gold in this case), we will view positions in both gold and DGLD as still open and the stop-loss for DGLD would have to be moved lower. On the other hand, if gold moves to a stop-loss level but DGLD doesn’t, then we will view both positions (in gold and DGLD) as closed. In other words, since it’s not possible to be 100% certain that each related instrument moves to a given level when the underlying instrument does, we can’t provide levels that would be binding. The levels that we do provide are our best estimate of the levels that will correspond to the levels in the underlying assets, but it will be the underlying assets that one will need to focus on regarding the signs pointing to closing a given position or keeping it open. We might adjust the levels in the “additional instruments” without adjusting the levels in the “main instruments”, which will simply mean that we have improved our estimation of these levels, not that we changed our outlook on the markets. We are already working on a tool that would update these levels on a daily basis for the most popular ETFs, ETNs and individual mining stocks.
Our preferred ways to invest in and to trade gold along with the reasoning can be found in the how to buy gold section. Additionally, our preferred ETFs and ETNs can be found in our Gold & Silver ETF Ranking.
As a reminder, Gold & Silver Trading Alerts are posted before or on each trading day (we usually post them before the opening bell, but we don't promise doing that each day). If there's anything urgent, we will send you an additional small alert before posting the main one.
=====
Latest Free Trading Alerts:
Stocks slightly extended their uptrend again yesterday, as investors' sentiment remained bullish following last Friday's rally after better-than-expected monthly jobs data release. So will the uptrend continue? Or is this still just an upward correction before another leg lower?
S&P 500 Reached 2,600, Downward Correction Ahead?
Fed signals more patience with its monetary tightening, despite strong economy. Why? And what does it mean for the gold market?
Will Powell’s Put Support Gold?
=====
Thank you.
Sincerely,
Przemyslaw Radomski, CFA
Editor-in-chief, Gold & Silver Fund Manager

