

Briefly: in our opinion, full (300% of the regular position size) speculative short positions in junior mining stocks are justified from the risk/reward point of view at the moment of publishing this Alert.
While we usually post longer analyses on Fridays, this week, we’re moving this to today, as your Editor (PR) will be traveling tomorrow, and thus tomorrow’s technical part will be rather limited.
Let’s start today’s analysis with a recap of what recently happened on the fundamental front.
This week belonged to the Fed, as officials finally knocked some sense into overzealous investors. For example, it began with Brainard, George, Daly, and Williams sounding the hawkish alarm, and ended with the FOMC minutes that shook the financial markets. Moreover, while the bearish fundamental implications of the Fed’s rate hike cycle are slowly being grasped by investors, I’ve been warning for weeks that a reality check would unfold. To explain, I wrote on Mar. 22:
While the PMs seem to think that the Fed’s inflation fight won’t impact their medium-term prospects, the reality is that higher real interest rates are needed to reduce inflation. And with commodity investors failing to comply, the merry-go-round of higher input prices leading to higher output prices will continue. As a result, the downside risk confronting the PMs is enormous at this point.
Remember, the Fed can only slow inflation by slowing the U.S. economy. That's why Powell keeps referencing a "soft landing" when describing the tradeoff between calming inflation and maintaining growth. However, with continued inflation of 8%+ likely to push the U.S. into recession, Powell knows that doing nothing is as bad as doing too much. As a result, investors should eventually learn that Powell's dovish days are over.
To that point, while the S&P 500 and the NASDAQ Composite have gotten the memo in recent days, the PMs still remain relatively elevated. However, while the Russia-Ukraine conflict keeps the PMs’ hopes alive for now, their medium-term fundamentals are growing more bearish by the day.
For example, the Fed released the minutes from its Mar. 15/16 policy meeting on Apr. 6. The report revealed:
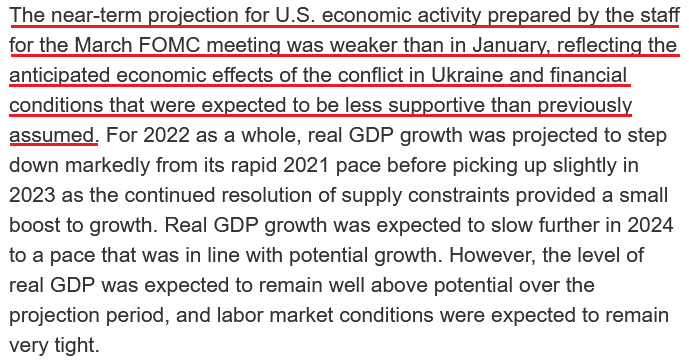
“Many participants noted that – with inflation well above the Committee's objective, inflationary risks to the upside, and the federal funds rate well below participants' estimates of its longer-run level – they would have preferred a 50 basis point increase in the target range for the federal funds rate at this meeting.
“A number of these participants indicated, however, that, in light of greater near-term uncertainty associated with Russia's invasion of Ukraine, they judged that a 25 basis point increase would be appropriate at this meeting.”
However, while the Fed initially balked at a 50 basis point rate hike, the policy initiatives that should materialize over the next several months are even more bearish. For example, the report added:
“Many participants noted that one or more 50 basis point increases in the target range could be appropriate at future meetings, particularly if inflation pressures remained elevated or intensified. A number of participants noted that the Committee's previous communications had already contributed to a tightening of financial conditions, as evident in the notable increase in longer-term interest rates over recent months.”
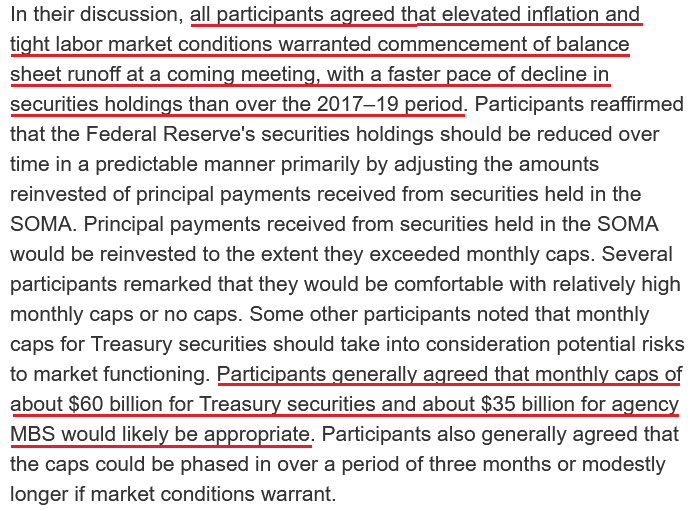
If that wasn’t enough, the FOMC made it clear that selling assets on the balance sheet will occur at “a more rapid pace” than in 2017-2019, with a combined ~$95 billion of U.S. Treasuries and agency mortgage-backed securities (MBS) set to hit the open market each month.
Please see below:
 Source: U.S. Fed
In addition:
 Source: U.S. Fed
The Mid-Week Fundamental Roundup
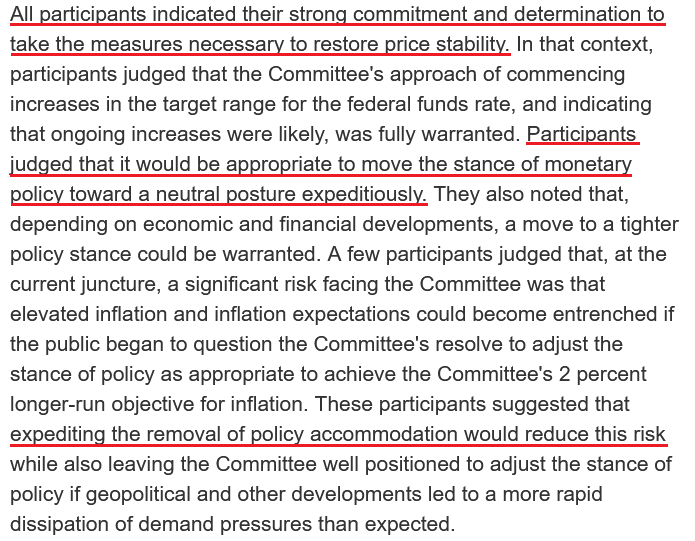
As a result, there are those buzzwords again. With Fed officials repeating the terms “rapid” and “expeditiously” recently, investors ignored the warnings at their own peril. However, while the minutes moved markets on Apr. 6, the release didn’t include anything materially different from what Fed officials have already said over the last few weeks.
Moreover, remember what I wrote on Dec. 16 about Chairman Jerome Powell’s press conference?
As one of the most important quotes of the press conference, he admitted:
“My colleagues were out talking about a faster taper, and that doesn’t happen by accident. They were out talking about a faster taper before the president made his decision. So it’s a decision that effectively was more than entrained.”
While Powell sounded a little rattled during the exchange, his slip highlights the importance of Fed officials’ hawkish rhetoric. Essentially, when Clarida, Waller, Bostic, Bullard, etc., are making the hawkish rounds, “that doesn’t happen by accident.” As such, it’s an admission that his understudies serve as messengers for pre-determined policy decisions.
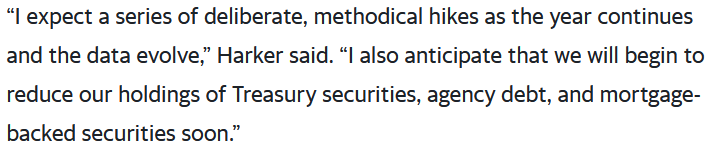
However, while investors were in la la land, the dynamic was on full display. With more than 10 Fed officials making the hawkish rounds recently, they made it clear that inflation was Public Enemy No. 1. Furthermore, Philadelphia Fed President Patrick Harker reiterated the message on Apr. 6. He said:
“Inflation is running far too high, and I am acutely concerned about this. Russia’s invasion of Ukraine will add to inflation pressure, not only hiking oil and gas prices but other commodities, like wheat and fertilizer, as well.”
As a result, he used two sentences to sum up the Fed minutes and what every other Fed official has said over the last month.
Please see below:
 Source: Bloomberg
In addition, while the S&P 500 and the NASDAQ Composite suffered on Apr. 6, they still remain materially overvalued. Moreover, the PMs have somewhat side-stepped the volatility and also remain in denial of what’s likely to unfold over the medium term. However, I warned on Apr. 6 that Fed officials should continue to pound away at the financial markets until investors finally fulfill their hawkish wishes. I wrote:
Please remember that the Fed needs to slow the U.S. economy to calm inflation, and rising asset prices are mutually exclusive to this goal. Therefore, officials should keep hammering the financial markets until investors finally get the message.
Moreover, with the Fed in inflation-fighting mode and reformed doves warning that the U.S. economy “could teeter” as the drama unfolds, the reality is that there is no easy solution to the Fed’s problem. To calm inflation, it has to kill demand. As that occurs, investors should suffer a severe crisis of confidence.
Thus, while negativity reigned supreme on Apr. 6, we’re likely in the early innings of this thesis. For more context, I wrote on Apr. 5:
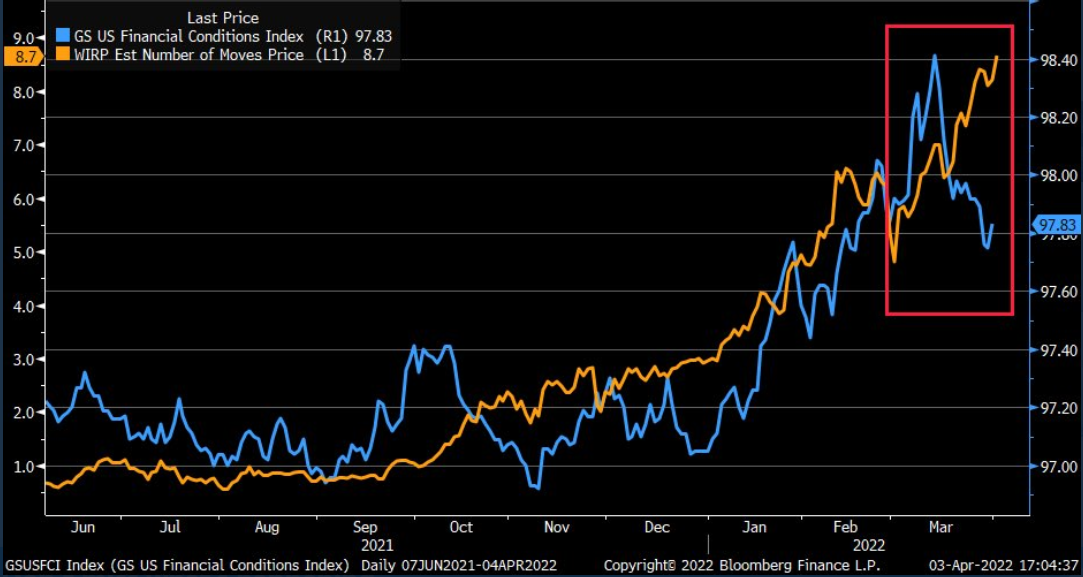
To explain, the orange line above tracks the number of rate hikes priced in by the futures market, while the blue line above tracks Goldman Sachs’ Financial Conditions Index (FCI). If you analyze the movement of the former, futures traders expect roughly nine rate hikes by the Fed in 2022.
However, if you focus your attention on the right side of the chart, you can see that the FCI has declined materially from its highs. Therefore, financial conditions are easier now than they were before the March FOMC meeting.
Please remember that loose financial conditions impair the Fed’s ability to achieve its inflation goal. As such, we should expect tighter financial conditions over the medium term, and the FOMC made that point clear in the minutes.
Please see below:
 Source: U.S. Fed
Therefore, please remember that loose financial conditions are bullish for the PMs, while tighter financial conditions are bearish. With Fed officials actively trying to push the blue line above higher, several asset classes should suffer from the Fed’s hawkish disposition. In a nutshell: lower stock and commodity prices and a stronger U.S. dollar help the Fed achieve its inflation goal. The opposite does not.
Also noteworthy, with inflation a political liability for the Biden Administration (which I’ve noted on several occasions), the chances of a dovish pivot are slim to none. Thus, is it wise to fight the Fed?
Please see below:
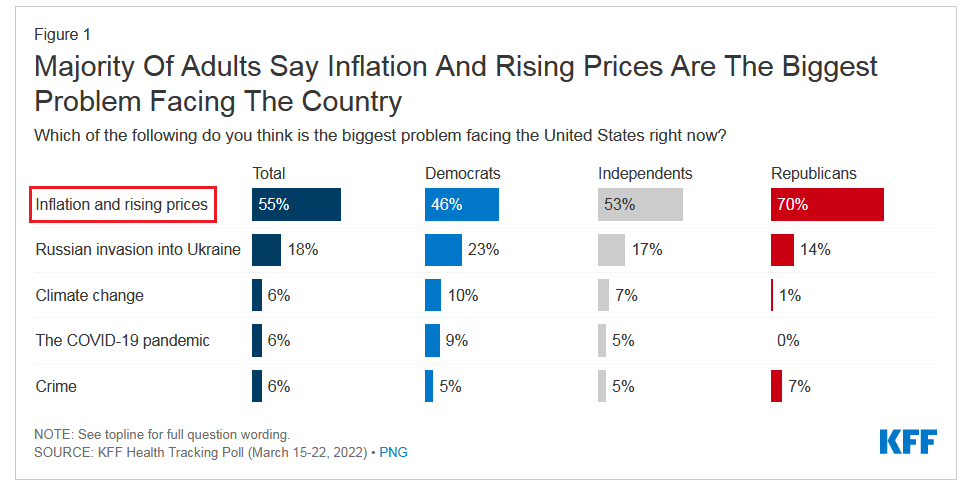
To explain, the Kaiser Family Foundation’s (KFF) poll released on Mar. 31 stated that “more than half of the public (55%) say inflation and rising prices is the biggest problem facing the U.S. right now, more than three times the share who say the same about any other issue included in the survey.”
As a result, the Fed has the political authority to reduce inflation by any means necessary. If history is any indication, the power struggle should light plenty of fireworks over the medium term. To explain, I wrote on Mar. 23:
When Fed officials dial up the hawkish rhetoric, their “messaging” is supposed to shift investors’ expectations. As such, the threat of raising interest rates is often as impactful as actually doing it. However, when investors don’t listen, the Fed has to turn the hawkish dial up even more. If history is any indication, a calamity will eventually unfold.
Please see below:
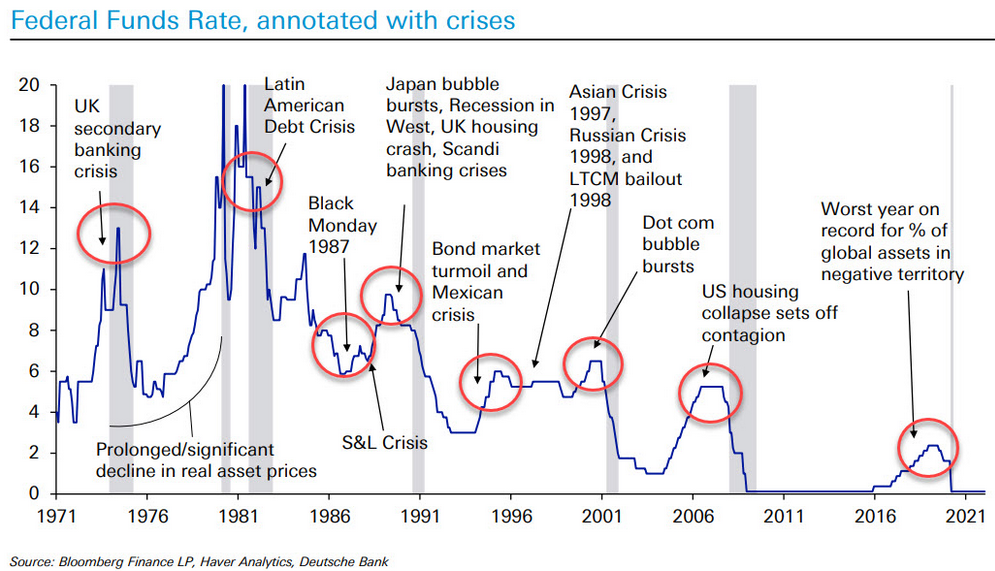
To explain, the blue line above tracks the U.S. federal funds rate, while the various circles and notations above track the global crises that erupted during the Fed’s rate hike cycles. As a result, standard tightening periods often result in immense volatility.
However, with investors refusing to let asset prices fall, they’re forcing the Fed to accelerate its rate hikes to achieve its desired outcome (calm inflation). As such, the next several months could be a rate hike cycle on steroids.
In addition, while I noted that we’re likely in the early innings of this thesis, a slow shift is already unfolding. Moreover, once the PMs realize that they are as vulnerable as the S&P 500, investors’ sentiment should follow.
Please see below:
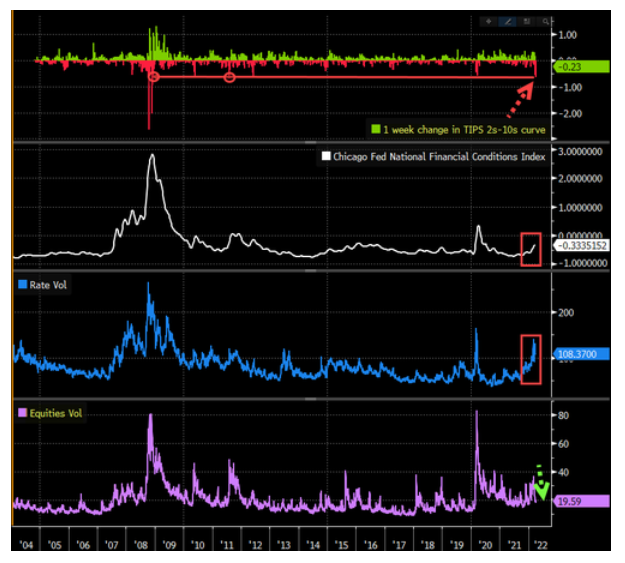 Source: Bloomberg/Zero Hedge
To explain, the four charts above depict various shifts in financial conditions. Whether its inflation expectation spreads, the Chicago Fed’s National Financial Conditions Index, or bond market volatility, the Fed’s message is slowly seeping in. However, with equity volatility (the purple line) quite muted relative to bond volatility (the blue line), the former should crack as the Fed continues its hawkish stampede.
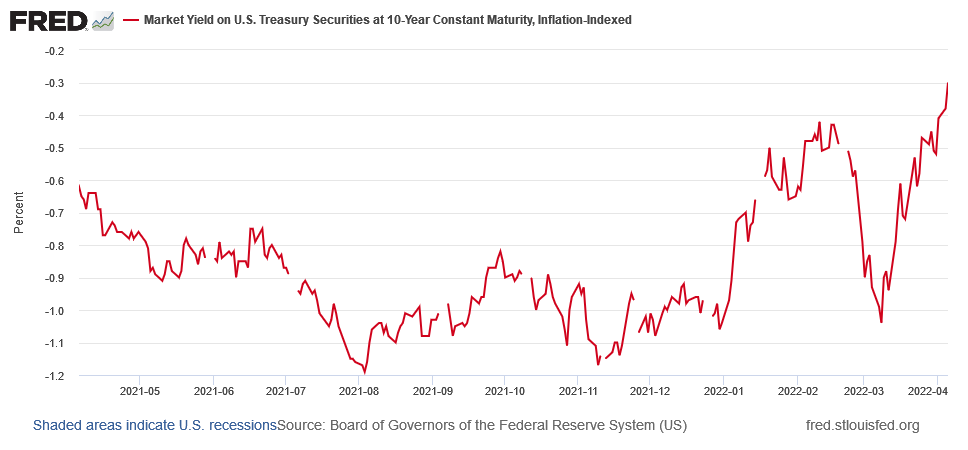
Finally, please note that the PMs often move inversely to U.S. real yields, and with the U.S. 10-Year real yield hitting another 2022 high of -0.30%, the Fed’s “rapid” liquidity drain should lift the metric toward 0% over the medium term.
The bottom line? While the Fed’s hawkish disposition aligns perfectly with my expectations, investors’ denial of the fundamental ramifications has delayed the PMs’ likely drawdowns. However, as the financial market impact of the Russia-Ukraine conflict subsides and the Fed’s rate hike cycle takes its toll on the U.S. economy, commodities’ fervor should dissipate. Moreover, the fundamental constraints confronting the PMs now are even worse than they were at the end of 2021.
In conclusion, the PMs declined on Apr. 6, as a sea of red flooded Wall Street. However, with rising real yields and a stronger USD Index akin to fundamental Kryptonite, gold, silver, and mining stocks face many economic headwinds. As such, while the short term remains uncertain, the bearish medium-term thesis is becoming clearer by the day.
What to Watch for Next Week
With another full slate of U.S. economic data releases next week, the most important ones are as follows:
- Apr. 12: NFIB Small Business Optimism Index, Consumer Price Index (CPI)
While the CPI will garner all of investors’ attention, it’s important to remember that it’s a lagging indicator. As a result, we want to know where inflation is going, not where it’s been. To provide clues, the NFIB Small Business Optimism Index is important to monitor. With small businesses being the lifeblood of the U.S. economy, their current and future pricing plans, as well as potential wage inflation, will help determine whether pricing pressures are improving or worsening.
- Apr: 13: Producer Price Index (PPI)
With the PPI often leading the CPI, it’s another important inflation metric. Moreover, with the Russia-Ukraine conflict increasing commodity prices, the PPI will provide important clues into the extent of the inflationary damage.
- Apr. 14: Retail sales, University of Michigan’s Consumer Sentiment Index
Retail sales provide a window into the health of U.S. consumers. Moreover, their spending, or lack thereof, will let us know how easy it is for businesses to pass on higher input costs. In addition, the University of Michigan’s Consumer Sentiment Index provides a window into the psyche of U.S. consumers. And with many fretting about inflation, more anxiety should put more pressure on the Fed.
- Apr. 15: Empire State Manufacturing Survey
The regional survey will let us know how growth, inflation, and employment are faring in New York State. Moreover, business surveys are important because they’re leading indicators of future government data.
All in all, economic data releases impact the PMs because they impact monetary policy. Moreover, if we continue to see higher employment and inflation, the Fed should keep its foot on the hawkish accelerator. And if that occurs, the outcome is profoundly bearish for the PMs.
Let’s start today’s technical discussion with a quick check on copper prices.
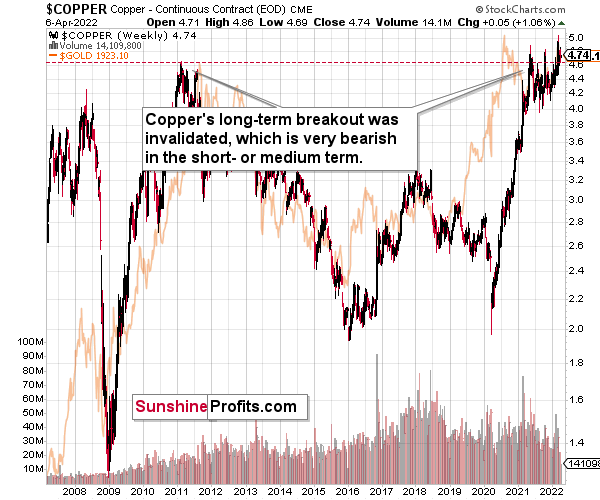
Copper recently invalidated another attempt to move above its 2011 high. This is a very strong technical sign that copper (one of the most popular commodities) is heading lower in the medium term.
Right now, copper is trying to break above its 2011 high once again, but given the previous invalidations, it’s doubtful that this attempt will be successful, especially given the situation in interest rates.
The interest rates are going up, just like they did before the 2008 slide. What did copper do before the 2008 slide? It failed to break above the previous (2006) high, and it was the failure of the second attempt to break higher that triggered the powerful decline. What happened then? Gold declined, but silver and mining stocks truly plunged. The GDXJ was not trading at the time, so we’ll have to use a different proxy to see what this part of the mining stock sector did.
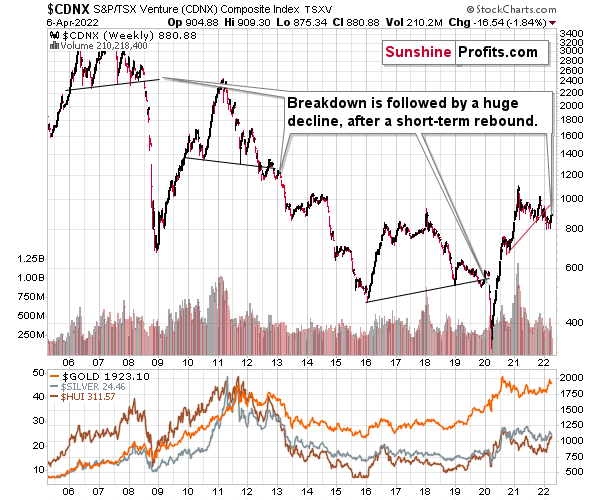
The Toronto Stock Exchange Venture Index includes multiple junior mining stocks. It also includes other companies, but juniors are a large part of it, and they truly plunged in 2008.
In fact, they plunged in a major way after breaking below their medium-term support lines and after an initial corrective upswing. Guess what – this index is after a major medium-term breakdown and a short-term corrective upswing. It’s likely ready to fall – and to fall hard.
So, what’s likely to happen? We’re about to see a huge slide, even if we don’t see it within the next few days.
In fact, the outlook for the next few days is rather unclear, as different groups of investors can interpret yesterday’s developments differently. However, once the dust settles, the precious metals sector is likely to go down significantly.
What happened during yesterday’s session?
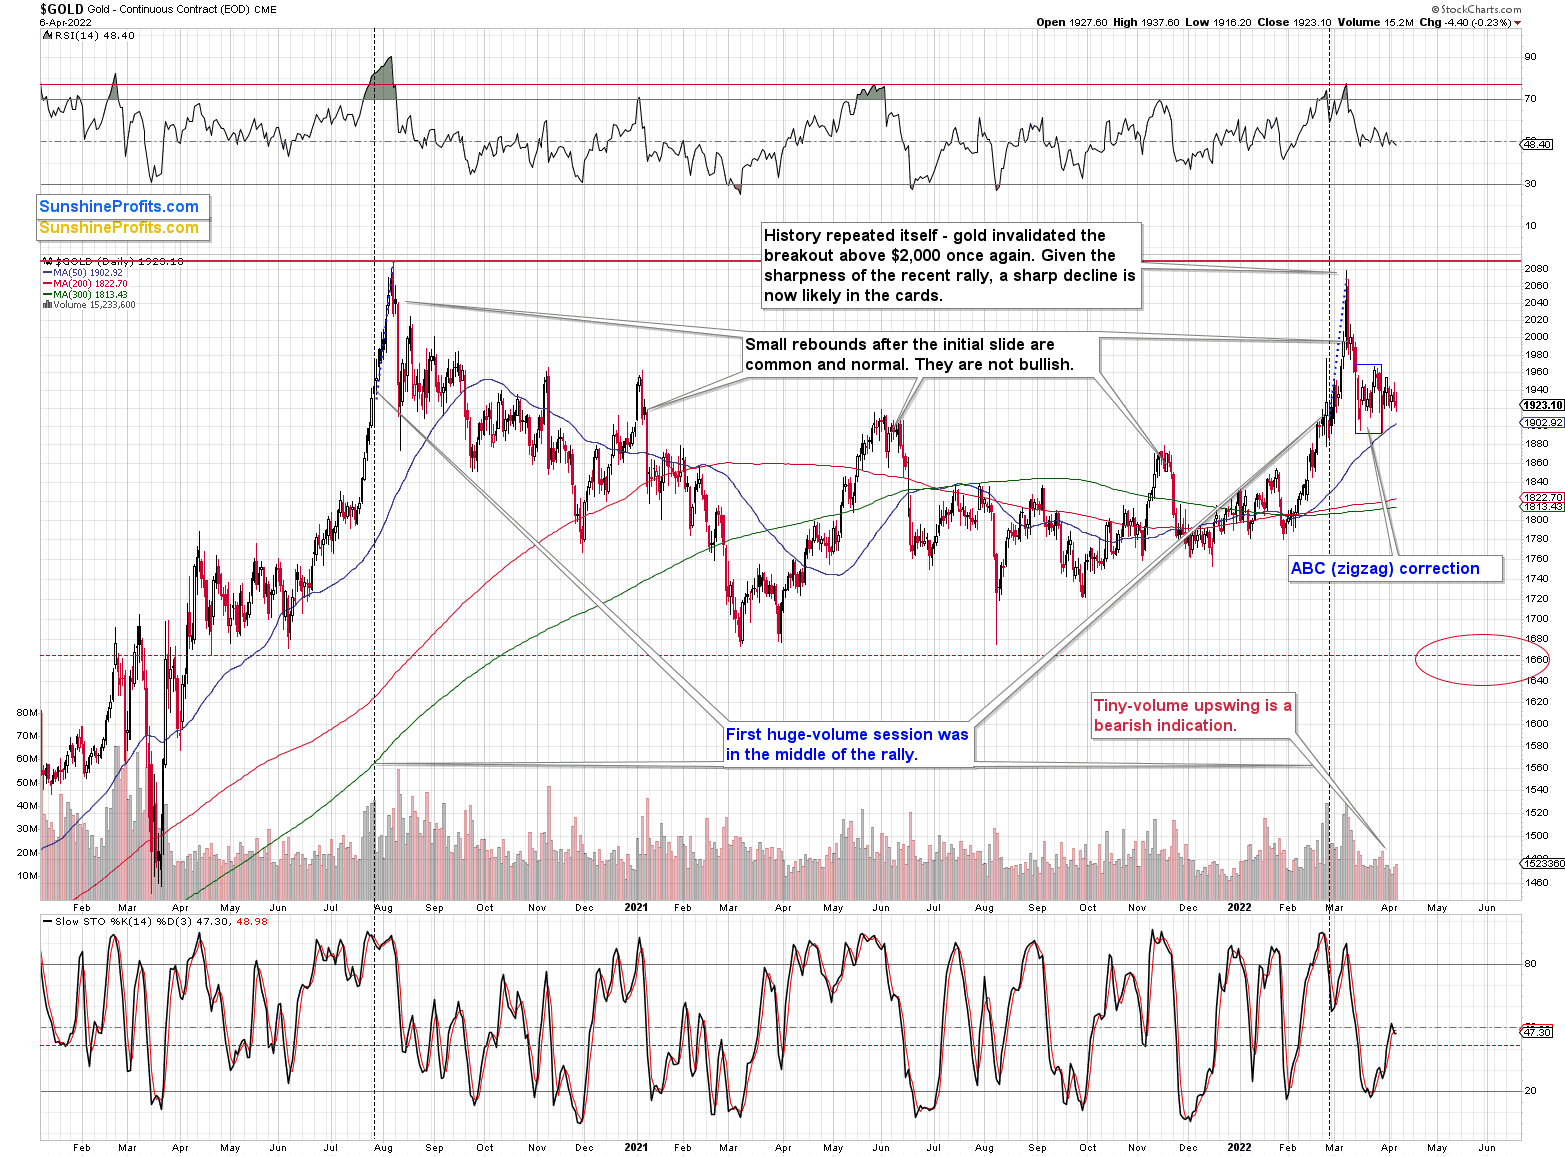
Gold once again did little, and that was bearish as it was a small decline that took place within a consolidation. The bearish thing about this consolidation is that it’s in line with what happened after a decline that was similar to what we saw recently.
Namely, back in 2020, after the yearly top and the decline that followed it, gold moved back and forth for a while before declining more visibly. We’re seeing the same thing right now.
Let’s keep in mind that between 2020 and now, quite a lot happened, quite a lot of money was printed, and we saw a war breaking out in Europe. Yet, gold failed to rally to new highs.
In fact, it’s trading very close to its 2011 high, which tells you something about the strength of this market. It’s almost absent.
Truth be told, what we see in gold is quite in tune with what we saw after the 2011 top, and in particular, shortly after the 2012 top. The long-term gold price chart below provides details.
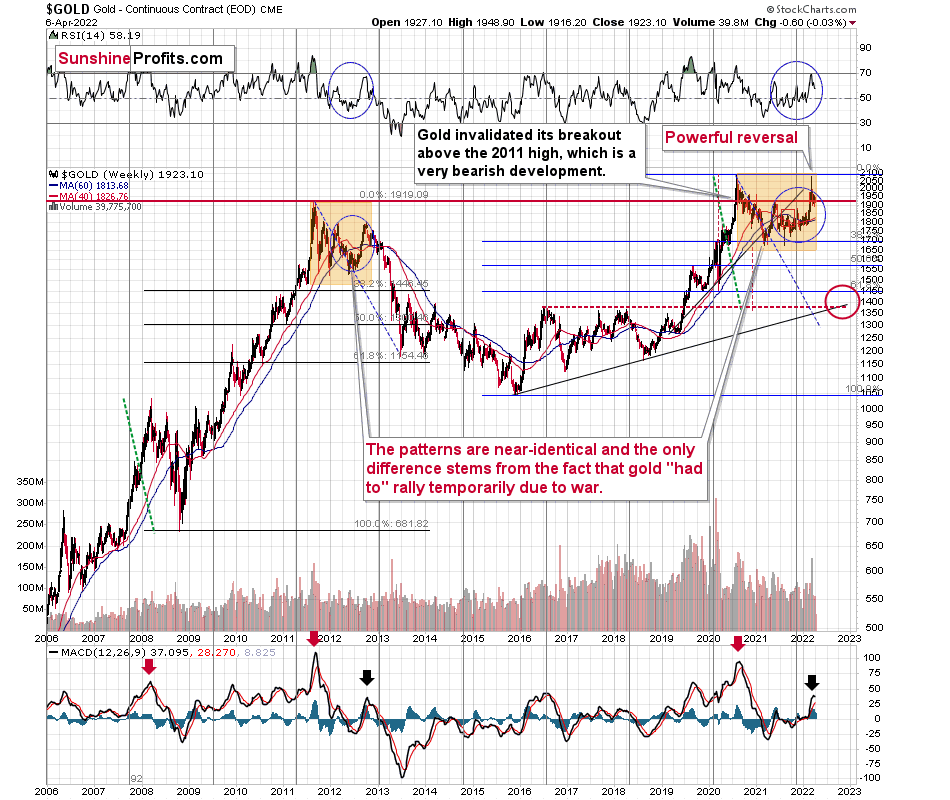
It seems that if it weren’t for the war in Europe, gold wouldn’t be able to move above $2,000 and instead it would have topped close to its previous highs, which provided strong resistance.
The extraordinary thing about that is that that’s exactly what happened in 2012. Gold moved higher but only until it reached its previous highs, which happened in the second half of 2012.
This time the RSI was a bit higher, but it was close to 70, just like what we saw in 2012.
The moves that we see in the long-term MACD indicator (lower part of the above chart) also confirm the analogy between now and 2012. The indicator is between 25 and 50, and it’s above its previous local top (early 2012 and mid-2021), and this local top formed after a profound decline from the ultimate top.
Yes, this time gold move back to the previous high, but:
- This happened based on a geopolitical event (war in Europe) and geopolitically-driven rallies are generally unsustainable;
- When gold reached its previous highs, it also formed a profound weekly reversal, which formed on huge volume, and that’s very bearish.
So, the current outlook for gold is very bearish – the recent back and forth movement (the consolidation) appears analogous to the back-and-forth part of the decline that we saw right after the 2012 top. That was the beginning of a huge medium-term downswing.
Meanwhile, silver declined a bit, which is not that important on its own, but it is important given the fact that it’s yet another daily close back below silver’s January 2022 high in terms of the closing prices.
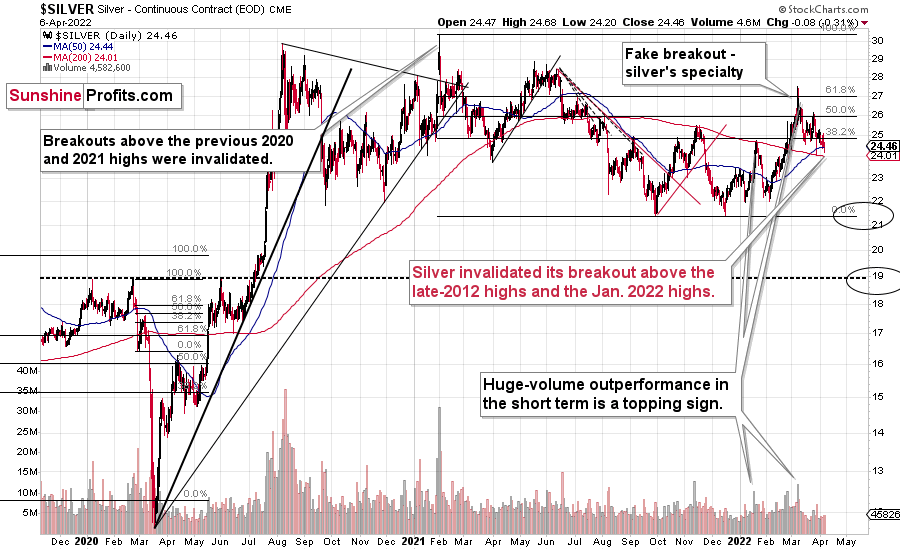
That’s another way of saying that silver definitely invalidated the breakout to new 2022 highs. This is bearish, and it’s in tune with other indications that we have gotten previously from the price of the white metal.
First of all, when silver got really popular in early 2021, it still failed to hold the breakout above the previous highs. Back then, very few people wanted to listen to this, but I warned that this is the exact wrong moment to buy silver and that better buying opportunities are likely ahead. Well, it turns out that those buying close to $30 have bought close to a yearly+ top. As practically everyone interested had already gotten in, the price declined as there was nobody (of course, that’s just an oversimplification) else who wanted to buy, and the market needs to attract fresh buying power if the price is to rally.
Anyway, after that invalidation, silver never managed to get very close to the $30 level.
Sure, it will likely surpass it, and then the previous all-time high, and then move to three digits, but it doesn’t mean that it has to happen very soon, as well as that silver can’t slide profoundly before that happens.
In fact, gold is not the only precious metal that is repeating its 2012 performance right now, and you can see more details on silver’s long-term chart.
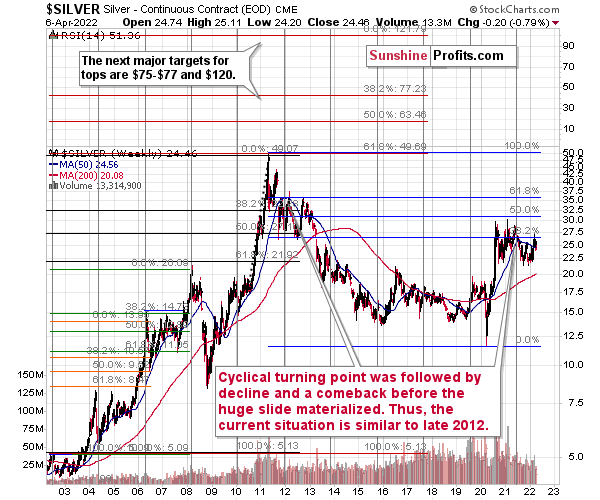
As you can see on the above chart, silver corrected about 50% of the previous downswing, and this correction ended at about $30, a long time ago. Ever since, silver has been declining, and even the outbreak of war in Europe didn’t make silver rally above that level.
On the above chart, you can see how silver first topped in 2011, then declined and formed another top at the cyclical turning point. Next, it declined once again – to the previous lows. After that, silver rallied (in 2012 and 2022), and it topped between its 50-week moving average (marked in blue) and the previous top. Now silver is declining in a back-and-forth manner (you can see it more clearly on the previous short-term silver chart).
Back in 2012, these were just the early days of a gargantuan decline, and the same appears likely to be the case this time. Interest rates are going up after all, and the Fed is determined to quench inflation.
Let’s not forget that rising interest rates are likely to negatively impact not just commodities, but practically all industries. This will likely cause silver’s price to decline profoundly, as silver’s industrial demand could be negatively impacted by lower economic growth (or a decline in economic activity).
Besides, please note that silver didn’t even manage to rally as much as copper (which tried to move to new highs recently) or most other commodities, thus being rather weak.
Consequently, it seems that silver will need to decline profoundly before it rallies (to new all-time highs) once again.
Having said that, let’s take a look at what happened in junior mining stocks.
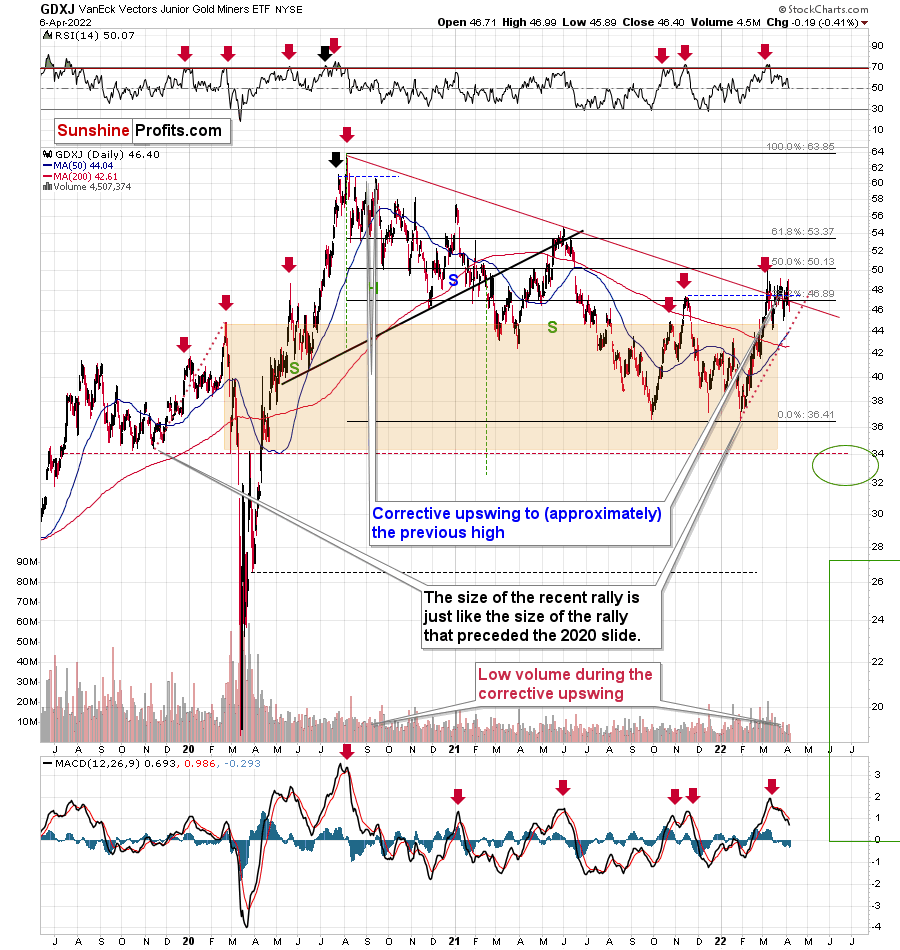
The GDXJ ETF declined, and it did so after trying to rally above the previous highs. With this attempt, it seems that we have just seen another short-term top.
The sell signal from the MACD indicator clearly confirms that. These signals were highly effective at detecting major short-term tops, and the fact that we just saw one makes the outlook for mining stocks even more bearish.
Interestingly, the GDXJ closed only slightly below its declining medium-term support/resistance line and below its 38.2% Fibonacci retracement. It closed visibly below its late-2021 highs, though. Consequently, given only a little more weakness, junior miners will move below the key support levels, which will pave the way for much bigger declines.
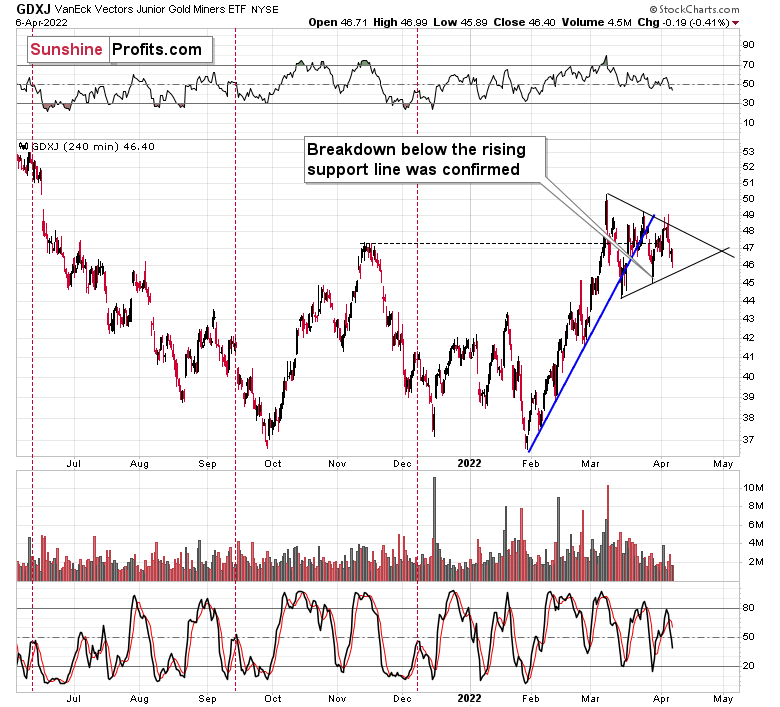
This would be in tune with GDXJ’s breakdown below its short-term (blue) support line. The breakdown is now fully confirmed, so it already makes the above-mentioned breakdowns more likely.
Junior miners recently found resistance in the form of the declining line based on the previous March highs. After a tiny attempt to break above this line, the GDXJ declined and the breakout was invalidated, suggesting that the rally is over.
Now, the above-mentioned resistance line appears to be the upper border of the triangle pattern, which might concern you because triangles are usually a “continuation pattern.” In other words, the move that preceded the triangle is usually the type of move that follows it. The preceding move higher was up, so the following move could be to the upside as well.
However, for this to happen, junior miners would first need to confirm the breakout above the line, and we saw the opposite taking place yesterday – the breakout above the line was invalidated. Twice.
If – instead – we see a decline below the lower border of the triangle, the pattern would likely be followed by a decline. Please note that I wrote “usually” and now “always” with regard to the bullish implications of triangles.
Also, let’s not forget about the forest while looking at individual trees. By that, I mean looking at how gold stocks perform relative to gold. That’s one of the major indications that the current situation is just like what we saw at the 2012 top. In other words, my last week's comments on the chart below remain up-to-date.
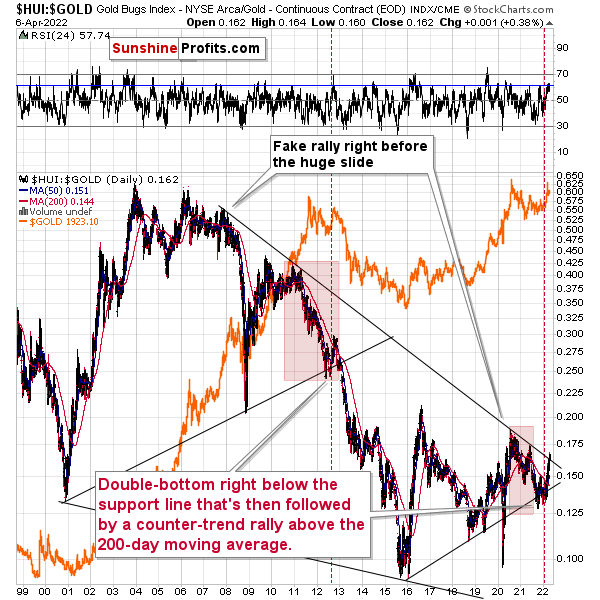
Gold stocks (GDX, GDXJ, and HUI Index) have recently been quite strong relative to gold. OK, but is this necessarily bullish? It might be, until one considers the fact that we saw the same thing at the 2012 top! This changes everything, and it does so, because the links between now and that top are almost everywhere: in gold, in silver, in gold stocks, and even in their ratios.
As it turns out, the gold stocks to gold ratio is behaving almost identically as it was behaving at the 2012 top in the precious metals sector.
In both cases, the ratio moved below the rising medium-term support line, then formed a double-bottom below the line, and invalidated the breakdown, which resulted in a counter-trend rally. The rally ended shortly after the ratio moved above its 200-day moving average (marked in red). That’s what happened recently. What happened next in 2012? The decline not only continued – it accelerated!
Consequently, the recent action in the ratio is not really bullish. In other words, the fact that gold stocks were recently (in the short run only) strong relative to gold doesn’t make the medium-term outlook for the precious metals sector bullish. However, it remains bearish.
Interestingly, the ratio itself moved to its declining resistance line (and it even moved slightly above it, but the move is too small to be viewed as reliable yet), indicating that the corrective upswing might already be over or almost over. We get the same indication from the RSI indicator. It’s not above 70, but in the case of most local tops, the RSI didn’t have to move above 70. It just moved to more or less the same levels – I marked it with a horizontal blue line.
The above is actually a confirmation of the analogy that is visible directly in all three key components of the precious metals sector: gold, silver, and mining stocks.
I already discussed the ones in gold and silver, so let’s take a look at the analogy in the HUI Index – a proxy for gold stocks.
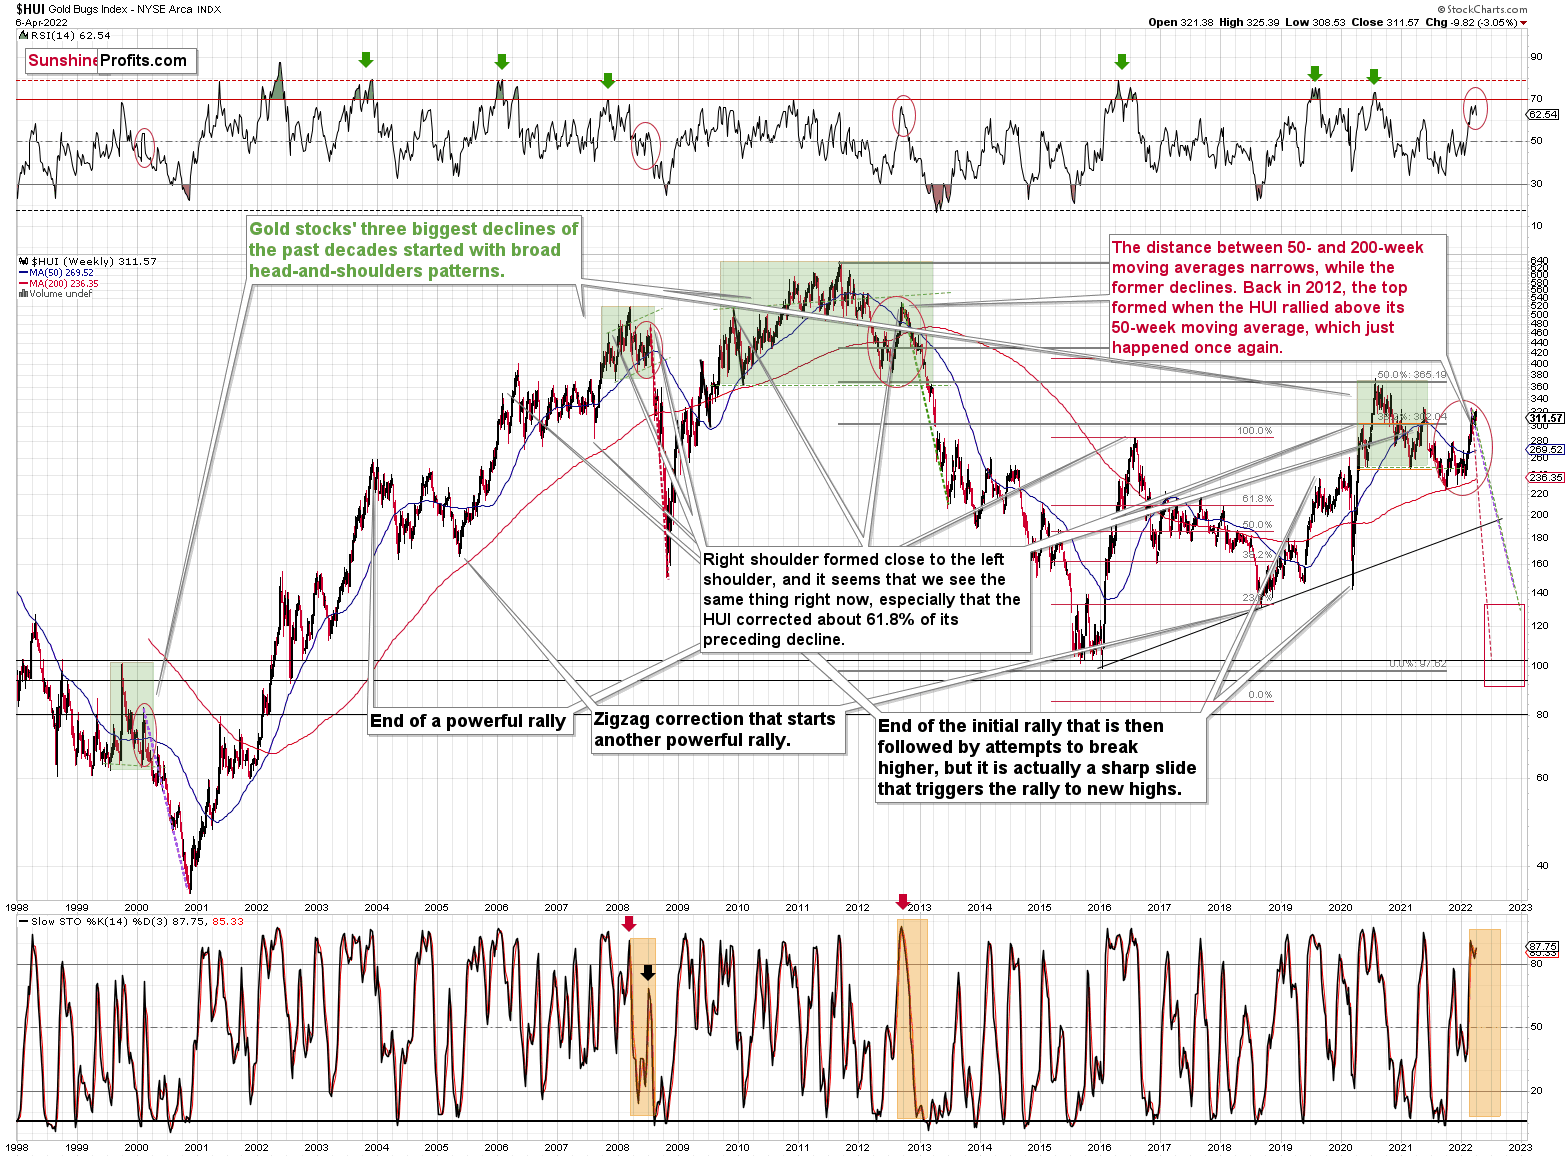
If you look at the areas marked with red circles (especially now, 2012/2013, and 2008), you’ll notice that they are very similar. These are the sizable short-term rallies that we saw after / in the final parts of the broad head-and-shoulders patterns.
The moves were quite sizable – the 2012 rally was even bigger than the current one, even though there was no war in Europe at that time.
Based on how broad the pattern is and the self-similarity present in gold, it seems that the analogy to what happened in 2012 is most important right now.
Looking at the moving averages, we see that the 50-week moving average (blue) and 200-week moving average (red) performed quite specifically in late 2012, and we see the same thing this year.
The distance between 50- and 200-week moving averages is currently narrowing, while the former is declining. Back in 2012, the top formed when the HUI rallied above its 50-week moving average, which just happened once again.
The RSI indicator (above the price chart), based on the HUI Index’s weekly chart, provides us with another confirmation of the analogy, and the same goes for the stochastic indicator (below the price chart). The former is just below the 70 level – exactly what we saw at the 2012 top, and the latter is above 90 – again, something that we saw at the 2012 top.
As history tends to rhyme, gold stocks are likely to slide, similarly to how they declined in 2012 and 2013.
Still, if the general stock market slides, and that appears likely for the following weeks and months, then we might have a decline that’s actually similar to what happened in 2008. Back then, gold stocks declined profoundly, and they have done so very quickly.
The dashed lines that start from the recent prices are copy-paste versions of the previous declines that started from the final medium-term tops. If the decline is as sharp and as big as what we saw in 2008, gold stocks would be likely to decline sharply, approximately to their 2016 low. If the decline is more moderate, then they could decline “only” to 120-150 or so. Either way, the implications are very, very, very bearish for the following weeks.
Also, we saw a fresh sell signal from the weekly stochastic indicator, which (unlike its 4-hour version) is quite efficient. This is a very bearish development for the medium term. After all, the last two times we saw this signal, were at the 2021 and 2020 tops.
Let’s take a brief look at the stock market indices.
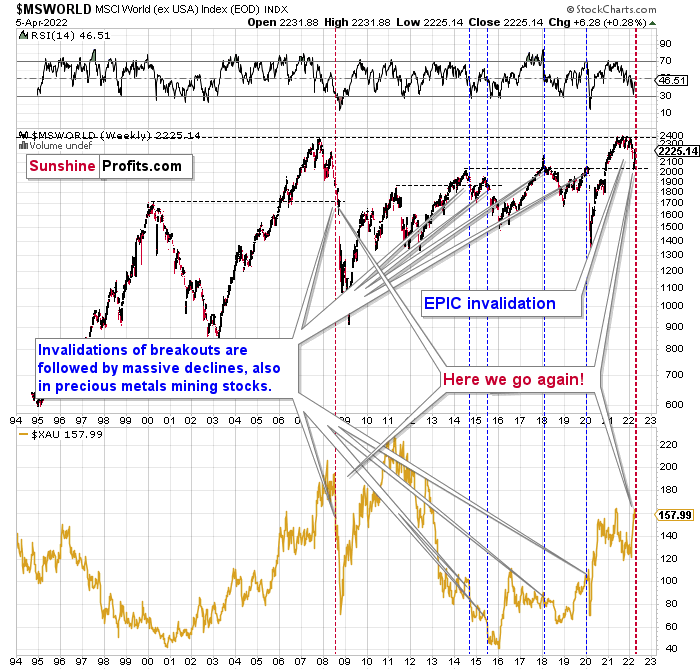
The technical picture in the case of world stocks remains extremely bearish, and my previous comments on it remain up-to-date:
World stocks have already begun their decline, and based on the analogy to the previous invalidations, the decline is not likely to be small. In fact, it’s likely to be huge.
For context, I explained the ominous implications on Nov. 30. I wrote:
Something truly epic is happening in this chart. Namely, world stocks tried to soar above their 2007 high, they managed to do so and… they failed to hold the ground. Despite a few attempts, the breakout was invalidated. Given that there were a few attempts and that the previous high was the all-time high (so it doesn’t get more important than that), the invalidation is a truly critical development.
It's a strong sell signal for the medium- and quite possibly for the long term.
From our – precious metals investors’ and traders’ – point of view, this is also of critical importance. All previous important invalidations of breakouts in world stocks were followed by massive declines in mining stocks (represented by the XAU Index).
Two of the four similar cases are the 2008 and 2020 declines. In all cases, the declines were huge, and the only reason why they appear “moderate” in the lower part of the above chart is that it has a “linear” and not a “logarithmic” scale. You probably still remember how significant and painful (if you were long, that is) the decline at the beginning of 2020 was.
Now, all those invalidations triggered big declines in the mining stocks, and we have “the mother of all stock market invalidations” at the moment, so the implications are not only bearish, but extremely bearish.
What does it mean? It means that it is time to get out of the short position in mining stocks to get a few extra dollars from immediate-term trades that might be risky. The possibility that the omicron variant of COVID makes vaccination ineffective is too great to be ignored as well. If that happens, we might see 2020 all over again – to some extent. In this environment, it looks like the situation is “pennies to the upside and dollars to the downside” for mining stocks. Perhaps tens of dollars to the downside… You have been warned.
World stocks have declined to their previous highs, and when something similar happened in 2008, it meant that both stocks and gold and silver mining stocks (lower part of the chart) were about to slide much further. In particular, that’s when the corrective upswing in the miners ended and the huge slide started. The implications for mining stocks are extremely bearish.
Here's how the situation currently looks from the U.S. point of view. The chart below features the S&P 500 futures.
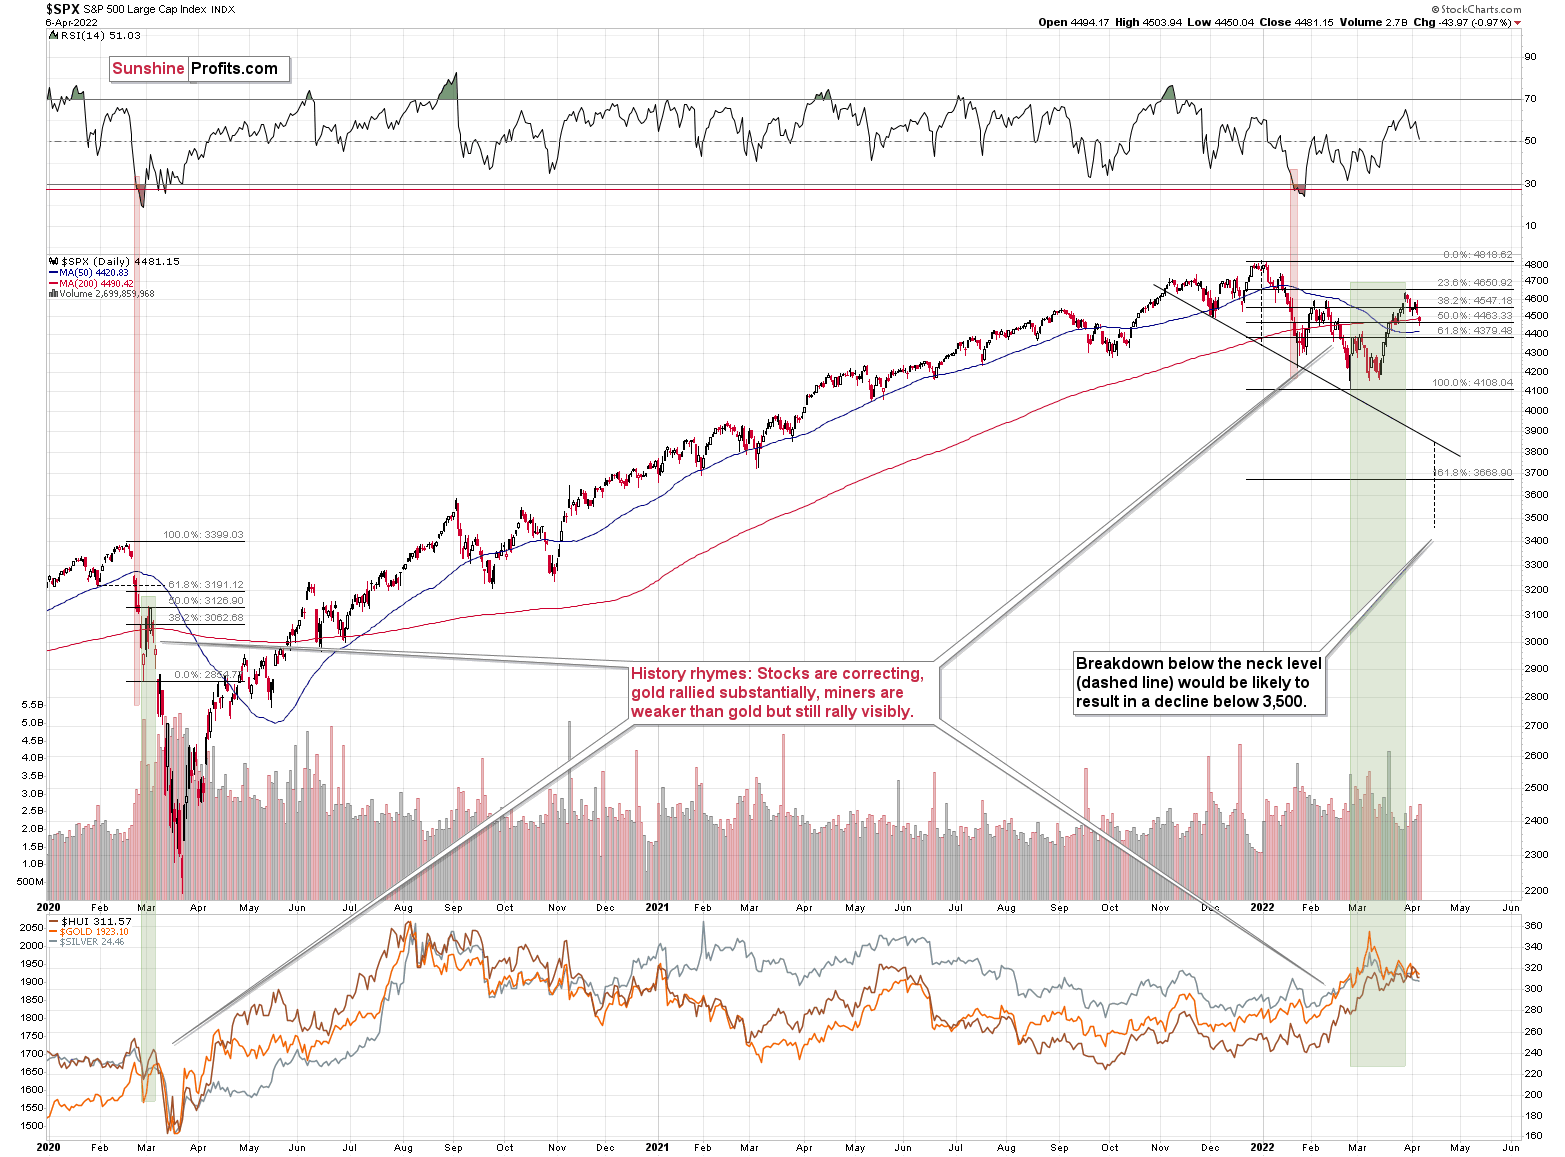
On March 30 (and the following days), I wrote about the above chart:
The S&P 500 rose yesterday and even managed to move above its February highs. At first sight, this appears bullish, but is it really so? Given that the riskiest stocks rallied the most, not necessarily.
Besides, stocks closed below the final of their regular Fibonacci ratios – the less known, but still important 76.4%, so they might reverse as early as today, once this resistance is reached. If that happens and the – unconfirmed (!) – breakout above the February/late-January highs is invalidated, we’ll have a strong sell signal.
While stocks rallied and the investing public (probably) entered the market, they might have also moved other assets that have been performing poorly recently. By “other assets”, I mean mining stocks. Yes, they rallied along with gold, but they were weak relative to it. Gold moved to its previous all-time high recently, and junior miners were able to rally just above their late-2021 high. They are now below this high, anyway.
Stocks just failed to break above the February high, and this invalidation is a strong sell signal for the near term. The decline in stocks is likely to have a particularly bearish effect on junior mining stocks.
Stocks have not yet declined significantly below the previous lows, but it seems that they are on the verge of doing so (the rates are rising and they are about to rise much more based on the fact that inflation has gotten very political). If 2020 could teach us anything, it would be that the following slide could be huge and sharp.
The volatility won’t necessarily match the 2020 one, but the decline is likely to be significant, anyway.
Let’s keep in mind that interest rates are likely to go higher, and that sanctions on Russia could impact global trade in multiple ways, thus negatively affecting the stock market.
This would be likely to have a very negative impact on the precious metals market, in particular on junior mining stocks (initially) and silver (a bit later).
Having said that, let’s take a look at the USD Index as it’s been breaking to new yearly highs recently.
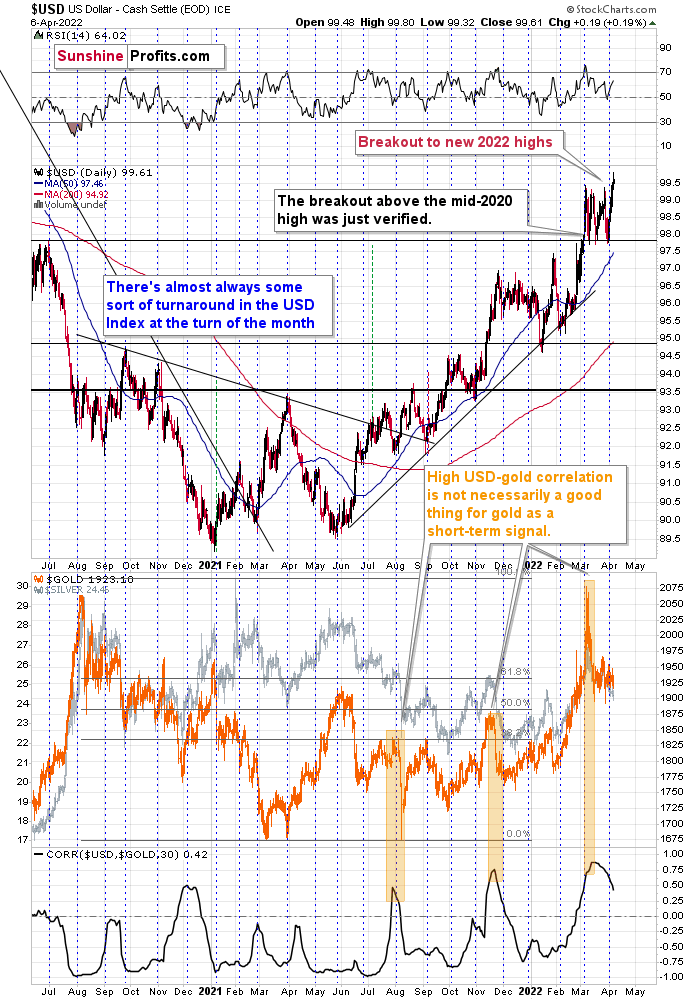
In my previous analyses, I commented on the USD Index in the following way:
If we focus on the USD Index alone, we’ll see that yesterday’s decline was absolutely inconsequential with regard to changing the outlook for the USDX. It simply continues to consolidate after a breakout above the mid-2020 highs. Breakout + consolidation = increasing chances of rallies’ continuation. A big wave up in the USD Index is likely just around the corner, and the precious metal sector is likely to decline when it materializes.
As the war-based premiums in gold and the USD appear to be waning, a high-interest-rate-driven rally in the USD is likely to trigger declines in gold. The correlation between these two assets has started to decline. When that happened during the last two cases (marked with orange), gold plummeted profoundly shortly thereafter.
The USD Index rallied yesterday, and it now appears to be verifying its breakout above the March highs. Once the verification is complete (perhaps as early as this week), another big wave up is likely to follow. This might be the trigger that pushes the precious metals sector into full-decline mode.
All in all, technicals favor a decline in the precious metals sector sooner rather than later.
Overview of the Upcoming Part of the Decline
- It seems to me that the post-decline consolidation is now over or very close to being over , and that gold, silver, and mining stocks are now likely to continue their medium-term decline.
- It seems that the first (bigger) stop for gold will be close to its previous 2021 lows, slightly below $1,800 . Then it will likely correct a bit, but it’s unclear if I want to exit or reverse the current short position based on that – it depends on the number and the nature of the bullish indications that we get at that time.
- After the above-mentioned correction, we’re likely to see a powerful slide, perhaps close to the 2020 low ($1,450 - $1,500).
- If we see a situation where miners slide in a meaningful and volatile way while silver doesn’t (it just declines moderately), I plan to – once again – switch from short positions in miners to short positions in silver. At this time, it’s too early to say at what price levels this could take place, and if we get this kind of opportunity at all – perhaps with gold close to $1,600.
- I plan to exit all remaining short positions once gold shows substantial strength relative to the USD Index while the latter is still rallying. This may be the case with gold close to $1,350 - $1,400. I expect silver to fall the hardest in the final part of the move. This moment (when gold performs very strongly against the rallying USD and miners are strong relative to gold after its substantial decline) is likely to be the best entry point for long-term investments, in my view. This can also happen with gold close to $1,375, but at the moment it’s too early to say with certainty.
- As a confirmation for the above, I will use the (upcoming or perhaps we have already seen it?) top in the general stock market as the starting point for the three-month countdown. The reason is that after the 1929 top, gold miners declined for about three months after the general stock market started to slide. We also saw some confirmations of this theory based on the analogy to 2008. All in all, the precious metals sector is likely to bottom about three months after the general stock market tops.
- The above is based on the information available today, and it might change in the following days/weeks.
You will find my general overview of the outlook for gold on the chart below:
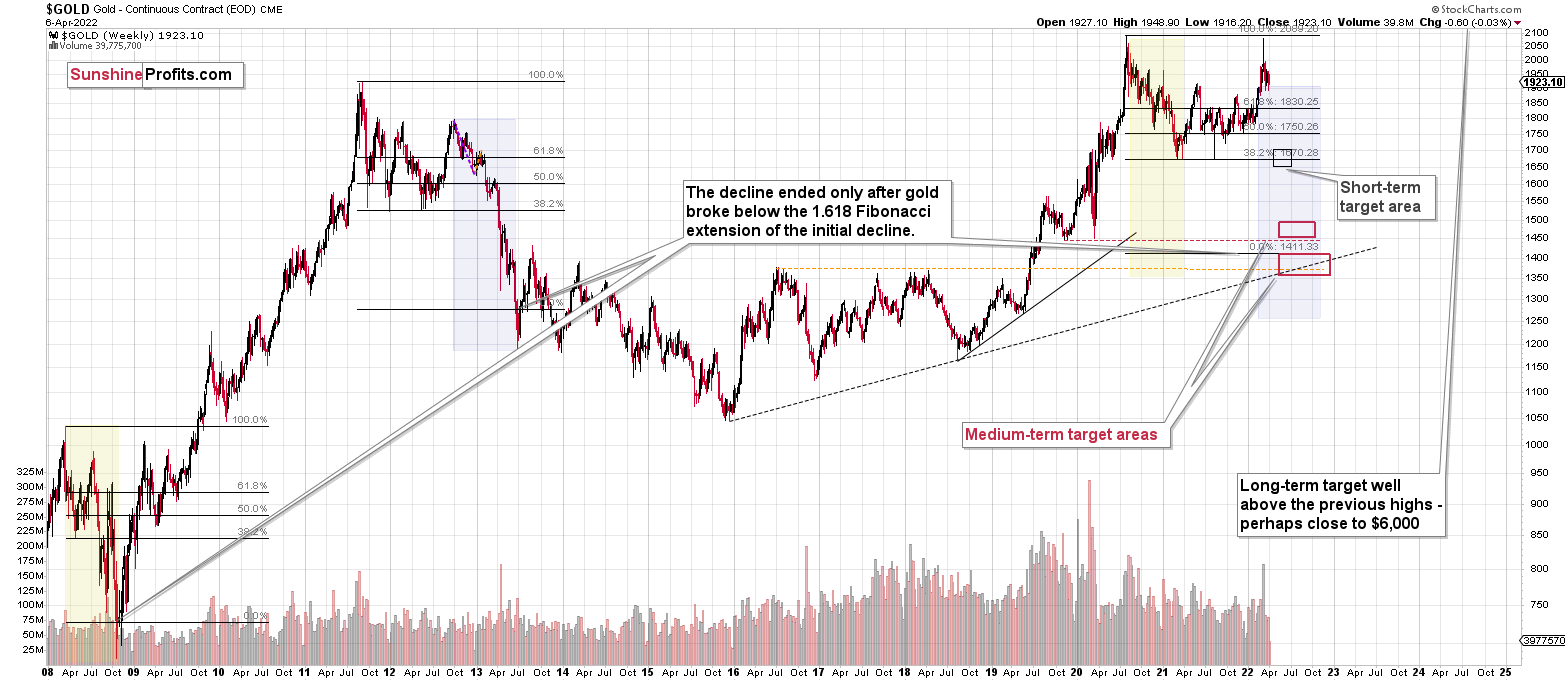
Please note that the above timing details are relatively broad and “for general overview only” – so that you know more or less what I think and how volatile I think the moves are likely to be – on an approximate basis. These time targets are not binding or clear enough for me to think that they should be used for purchasing options, warrants or similar instruments.
Summary
Summing up, despite the recent rally in gold, the outlook for junior mining stocks remains exactly as I described previously.
Crude oil’s extreme outperformance, the stock market’s weakness, and critical medium-term resistance levels reached by gold (all-time high!) and junior mining stocks – all indicate that the tops are at hand or have just formed.
Investing and trading are difficult. If it was easy, most people would be making money – and they’re not. Right now, it’s most difficult to ignore the urge to “run for cover” if you physically don’t have to. The markets move on “buy the rumor and sell the fact.” This repeats over and over again in many (all?) markets, and we have direct analogies to similar situations in gold itself. Junior miners are likely to decline the most, also based on the massive declines that are likely to take place (in fact, they have already started) in the stock markets.
From the medium-term point of view, the two key long-term factors remain the analogy to 2013 in gold and the broad head and shoulders pattern in the HUI Index. They both suggest much lower prices ahead.
It seems that our profits from short positions are going to become truly epic in the coming months.
After the sell-off (that takes gold to about $1,350-$1,500), I expect the precious metals to rally significantly. The final part of the decline might take as little as 1-5 weeks, so it's important to stay alert to any changes.
As always, we'll keep you - our subscribers - informed.
To summarize:
Trading capital (supplementary part of the portfolio; our opinion): Full speculative short positions (300% of the full position) in junior mining stocks are justified from the risk to reward point of view with the following binding exit profit-take price levels:
Mining stocks (price levels for the GDXJ ETF): binding profit-take exit price: $34.63; stop-loss: none (the volatility is too big to justify a stop-loss order in case of this particular trade)
Alternatively, if one seeks leverage, we’re providing the binding profit-take levels for the JDST (2x leveraged) and GDXD (3x leveraged – which is not suggested for most traders/investors due to the significant leverage). The binding profit-take level for the JDST: $14.98; stop-loss for the JDST: none (the volatility is too big to justify a SL order in case of this particular trade); binding profit-take level for the GDXD: $25.48; stop-loss for the GDXD: none (the volatility is too big to justify a SL order in case of this particular trade).
For-your-information targets (our opinion; we continue to think that mining stocks are the preferred way of taking advantage of the upcoming price move, but if for whatever reason one wants / has to use silver or gold for this trade, we are providing the details anyway.):
Silver futures downside profit-take exit price: $19.12
SLV profit-take exit price: $17.72
ZSL profit-take exit price: $38.28
Gold futures downside profit-take exit price: $1,683
HGD.TO – alternative (Canadian) inverse 2x leveraged gold stocks ETF – the upside profit-take exit price: $11.79
HZD.TO – alternative (Canadian) inverse 2x leveraged silver ETF – the upside profit-take exit price: $29.48
Long-term capital (core part of the portfolio; our opinion): No positions (in other words: cash
Insurance capital (core part of the portfolio; our opinion): Full position
Whether you already subscribed or not, we encourage you to find out how to make the most of our alerts and read our replies to the most common alert-and-gold-trading-related-questions.
Please note that we describe the situation for the day that the alert is posted in the trading section. In other words, if we are writing about a speculative position, it means that it is up-to-date on the day it was posted. We are also featuring the initial target prices to decide whether keeping a position on a given day is in tune with your approach (some moves are too small for medium-term traders, and some might appear too big for day-traders).
Additionally, you might want to read why our stop-loss orders are usually relatively far from the current price.
Please note that a full position doesn't mean using all of the capital for a given trade. You will find details on our thoughts on gold portfolio structuring in the Key Insights section on our website.
As a reminder - "initial target price" means exactly that - an "initial" one. It's not a price level at which we suggest closing positions. If this becomes the case (like it did in the previous trade), we will refer to these levels as levels of exit orders (exactly as we've done previously). Stop-loss levels, however, are naturally not "initial", but something that, in our opinion, might be entered as an order.
Since it is impossible to synchronize target prices and stop-loss levels for all the ETFs and ETNs with the main markets that we provide these levels for (gold, silver and mining stocks - the GDX ETF), the stop-loss levels and target prices for other ETNs and ETF (among other: UGL, GLL, AGQ, ZSL, NUGT, DUST, JNUG, JDST) are provided as supplementary, and not as "final". This means that if a stop-loss or a target level is reached for any of the "additional instruments" (GLL for instance), but not for the "main instrument" (gold in this case), we will view positions in both gold and GLL as still open and the stop-loss for GLL would have to be moved lower. On the other hand, if gold moves to a stop-loss level but GLL doesn't, then we will view both positions (in gold and GLL) as closed. In other words, since it's not possible to be 100% certain that each related instrument moves to a given level when the underlying instrument does, we can't provide levels that would be binding. The levels that we do provide are our best estimate of the levels that will correspond to the levels in the underlying assets, but it will be the underlying assets that one will need to focus on regarding the signs pointing to closing a given position or keeping it open. We might adjust the levels in the "additional instruments" without adjusting the levels in the "main instruments", which will simply mean that we have improved our estimation of these levels, not that we changed our outlook on the markets. We are already working on a tool that would update these levels daily for the most popular ETFs, ETNs and individual mining stocks.
Our preferred ways to invest in and to trade gold along with the reasoning can be found in the how to buy gold section. Furthermore, our preferred ETFs and ETNs can be found in our Gold & Silver ETF Ranking.
As a reminder, Gold & Silver Trading Alerts are posted before or on each trading day (we usually post them before the opening bell, but we don't promise doing that each day). If there's anything urgent, we will send you an additional small alert before posting the main one.
Thank you.
Przemyslaw Radomski, CFA
Founder, Editor-in-chief

