

Briefly: in our opinion, full (300% of the regular position size) speculative short positions in junior mining stocks are justified from the risk/reward point of view at the moment of publishing this Alert.
Not much happened in gold and silver yesterday in terms of changes in daily closing prices, but the intraday action was quite notable. The PMs reversed their early-session declines, and both gold and mining stocks ended the day higher.
The latter rallied even more visibly. So, was this a bullish reversal? Or was the daily strength of mining stocks bullish?
Before replying to these questions, let’s take a look at the markets from a fundamental point of view, as a lot of the details that are currently important are not visible on the charts.
With the general stock market back in bull mode, meme-stock fury has returned to Wall Street. With the riskiest corners of the financial markets performing the best in recent days, it’s like the summer of 2020 all over again (remember what happened to gold in August 2020? It topped…). However, while investors have performed random risk rallies since the pandemic erupted, the fundamental environment is much different now than it was then.
To explain, I’ve been bullish on the U.S. economy for some time. Since strong economic growth increases the Fed’s hawkish disposition, good data is profoundly bearish for the PMs. Moreover, with investors coming around to our way of thinking, the futures market is pricing in one of the fastest rate hike cycles in modern history.
Please see below:
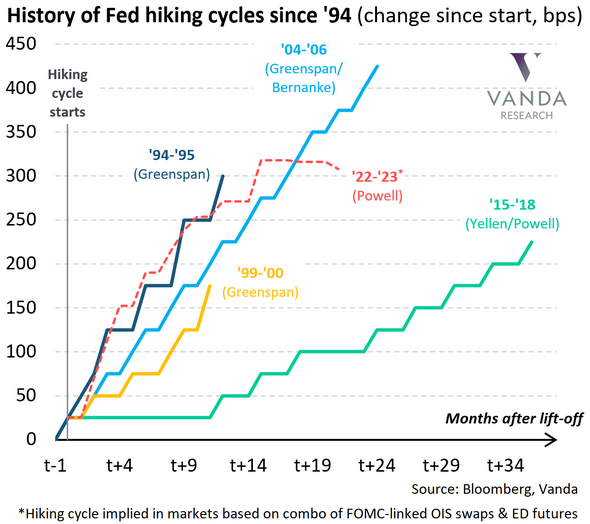
To explain, the various lines above track the length of time it took the U.S. federal funds rate to reach certain levels. If you analyze the green line above, you can see that the path to 225 basis points (2.25%) occurred gradually over three years.
However, if you focus your attention on the red dashed line above, you can see that a sharp move above 300 basis points (3%) is expected in early 2023. As a result, while investors assume that the Fed will fire all of these hawkish bullets without any collateral damage along the way, they’re likely in for a major surprise.
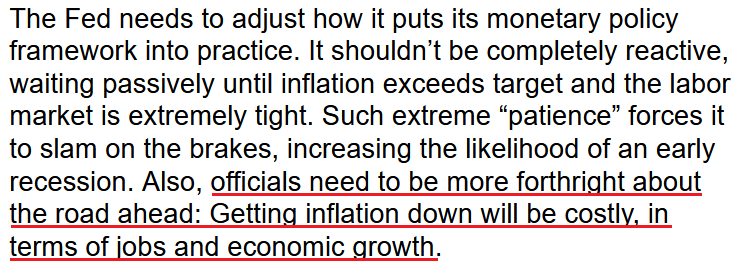
To that point, Fed Chairman Jerome Powell has talked a lot about a “soft landing.” For context, the phrase implies that the Fed can reduce inflation without impairing U.S. economic growth or the U.S. labor market. However, the expectation is much more semblance than substance.
For example, stimulus checks, record commercial bank deposits, and record job openings create an environment where consumers are flush with cash and willing to spend. However, this environment also created ~8% annualized inflation. Thus, should we expect the latter to decline without impacting the former? For context, I wrote on Mar. 28:
When the Fed tightens monetary policy, it's actively trying to slow down the U.S. economy. As a result, the tradeoff to calming inflation is less consumption, lower growth, and pressure on asset prices. However, while investors think the Fed will pull a rabbit out of its hat and materially slow inflation without hurting the U.S. economy, the prospect is unrealistic.
To that point, former New York Fed President Bill Dudley explained it perfectly on Mar. 29. He wrote:
“Powell is correct that the central bank tightened monetary policy significantly in 1965, 1984 and 1994 without precipitating a recession. In none of those episodes, though, did the Fed tighten sufficiently to push up the unemployment rate.”
“The current situation is very different. Consider the starting points: The unemployment rate is much lower (at 3.8 per cent), and inflation is far above the Fed’s 2 per cent target. To create sufficient economic slack to restrain inflation, the Fed will have to tighten enough to push the unemployment rate higher. Which leads us to the key point: The Fed has never achieved a soft landing when it has had to push up unemployment significantly.”
As a result:
 Source: Bill Dudley/Bloomberg
Thus, while the bulls rampage on Wall Street, they're missing the forest through the trees. The Fed needs to reduce asset prices to calm inflation. If not, higher equity and commodity prices will only contribute to the inflationary spiral.
Furthermore, I highlighted on Mar. 29 that the bond market is well ahead of the stock market in understanding what lies ahead. I wrote:
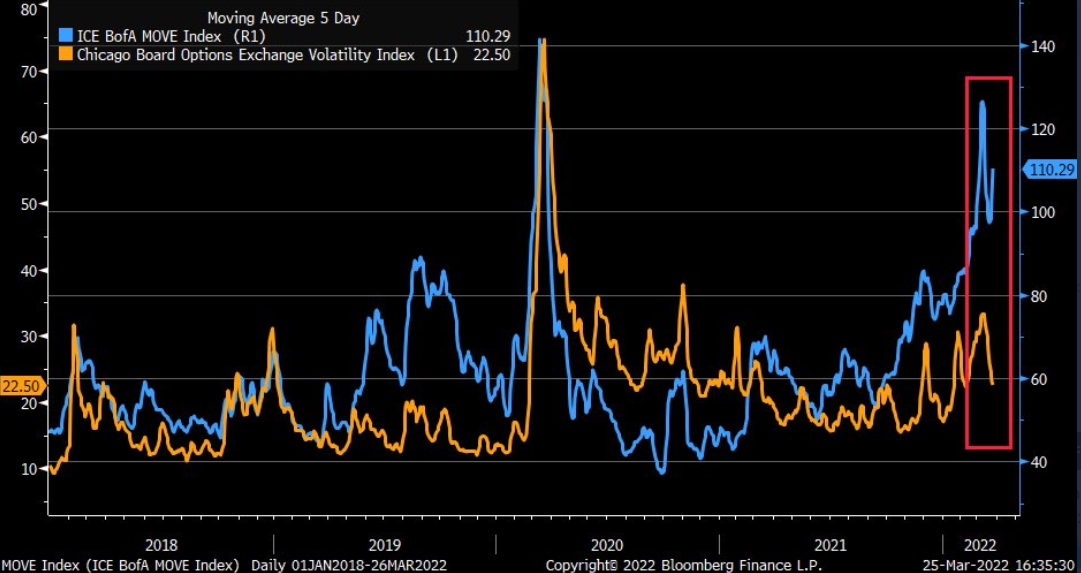
To explain, the orange line above tracks the Cboe Volatility Index (stock market volatility), while the blue line above tracks the MOVE Index (bond market volatility). If you analyze the relationship, you can see that stress in the credit market often reverberates across the equity market.
However, if you focus your attention on the right side of the chart, you can see that the pair has diverged in recent days. Thus, while inflation and the Fed’s hawkish disposition have rattled bond investors, stock bulls are behaving as if none of it matters. However, with the GDXJ ETF often suffering during periods of heightened volatility, more uncertainty should weigh on the junior miners over the medium term.
To that point, Bank of America noted how the spread between bond and equity volatility hit its highest level since the global financial crisis (GFC).
Please see below:
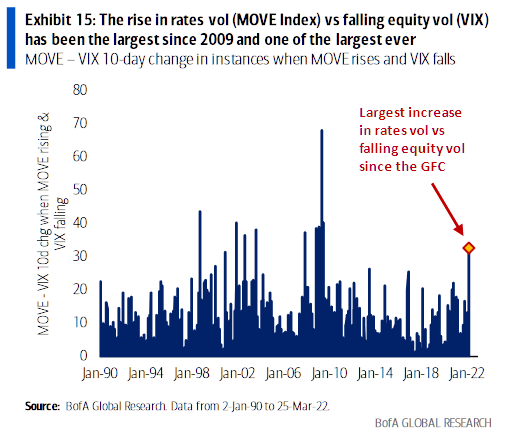
Dying a Slow Death
To explain, the blue bars above depict the spread between the MOVE Index and the 10-day change in the VIX. If you analyze the connection, you can see that the stock market rarely ignores tremors in the bond market. As a result, with interest rates poised to march higher, it sets the stage for material drawdowns of U.S. equities and the PMs.
However, please remember that there is a profound difference between where we are now and where we are likely heading. For example, with the Fed only on its first rate hike, the implications are largely immaterial. However, when the compounding effect of future rate hikes makes its presence felt, cracks in the U.S. economy should start to show.
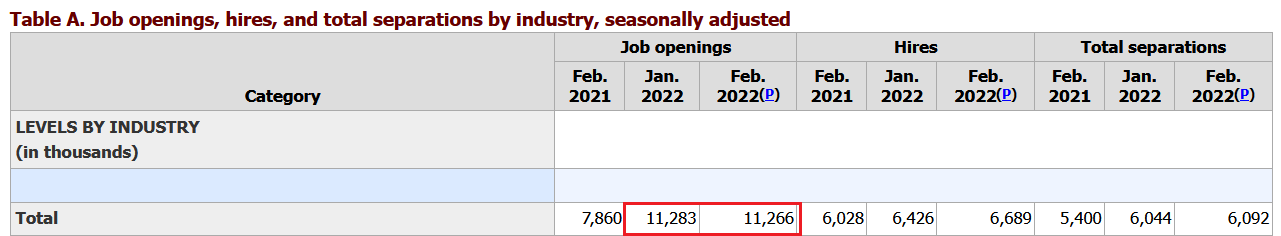
In the meantime, though, U.S. data remains resilient. However, since good news is bad news for the PMs, the better the data, the more hawkish the Fed will be. For example, one-half of the Fed’s dual mandate is maximum employment. With U.S. job openings only declining by 17,000 month-over-month (MoM), the U.S. labor market remains red hot. For context, the consensus estimate was 11 million, so the data outperformed expectations.
Please see below:
 Source: U.S. Bureau of Labor Statistics (BLS)
More importantly, though, another resilient report means that there are now 4.996 million more job openings in the U.S. than citizens unemployed.
Please see below:
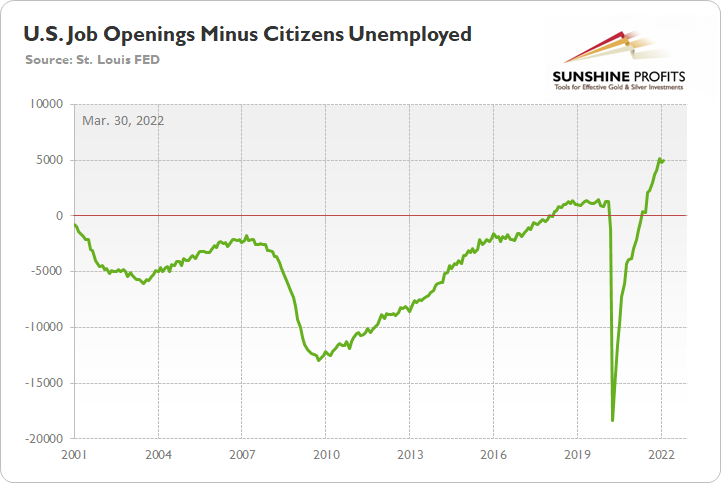
To explain, the green line above subtracts the number of unemployed U.S. citizens from the number of U.S. job openings. If you analyze the right side of the chart, you can see that the epic collapse has completely reversed, and the green line is near an all-time high. Thus, with more jobs available than people looking for work, the economic environment supports normalization by the Fed.
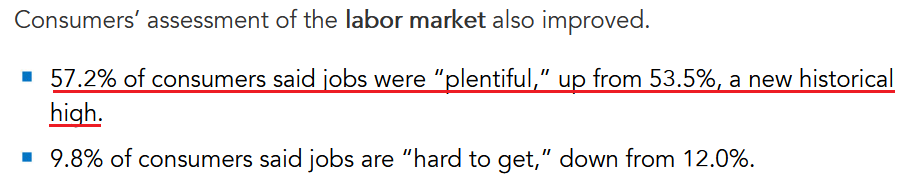
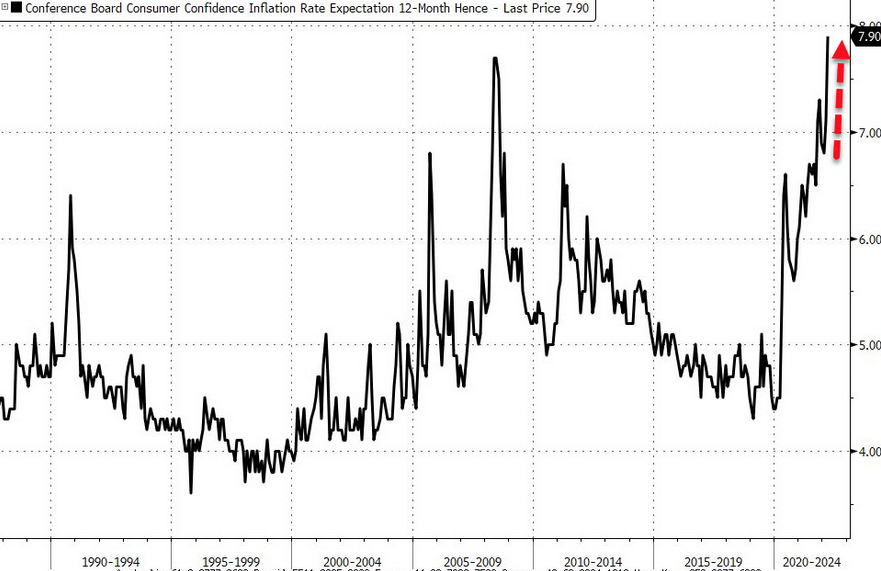
On top of that, The Confidence Board released its Consumer Confidence Survey on Mar. 29. While the headline index remains far from its highs, it increased from 105.7 in February to 107.2 in March. Likewise, finding a job has never been easier in the U.S.
Please see below:
 Source: The Confidence Board
In addition, the Conference Board's labor market differential also hit a new all-time high. For context, the metric subtracts "hard to get" responses from "plentiful" responses. In a nutshell: the higher the value, the more employment opportunities in the U.S.
Please see below:
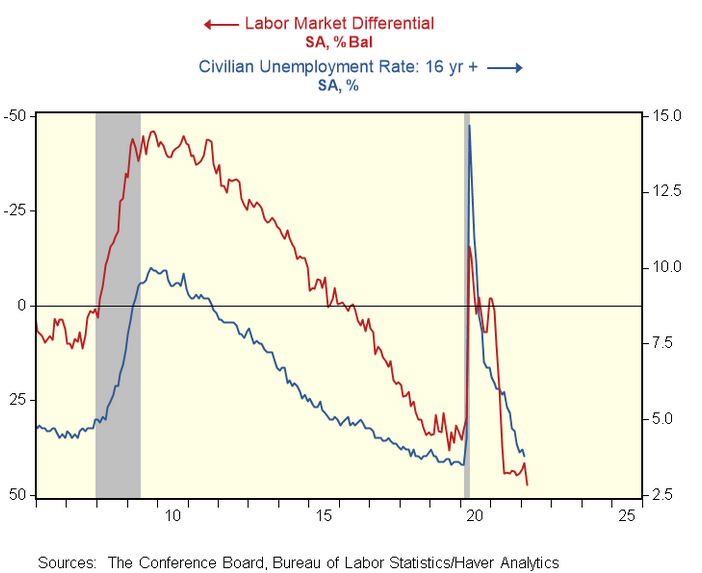
To explain, the blue line above tracks the 16+ civilian unemployment rate, while the red line above tracks the inverted labor market differential. As you can see, the metric points to a substantially lower unemployment rate in the coming months, and the prospect is extremely bullish for Fed policy.
If that wasn’t enough, Lynn Franco, Senior Director of Economic Indicators at The Conference Board, cited “expectations for inflation over the next 12 months reaching 7.9 percent - an all-time high.”
Thus, with inflation and employment boiling in the U.S., the Fed’s rate hike cycle remains alive and well.
Please see below:
Source: Bloomberg/Zero Hedge
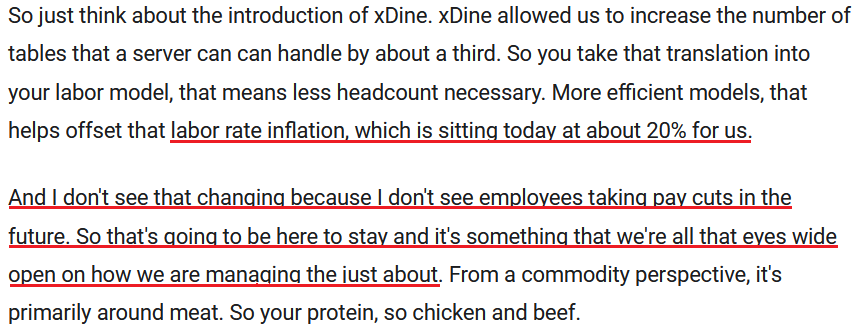
Finally, with investors materially underestimating what the Fed needs to do to calm inflation, the merry-go-round continues to spin. For example, Dave & Buster's released its fourth-quarter earnings on Mar. 28. For context, the restaurant and entertainment company has 144 locations in 40 states, Puerto Rico, and Canada.
Moreover, CFO Michael Quartieri said: "Even with headwinds from wage and commodity inflation, we've continued to grow margins." He added: "we're able to offset that with a slight increase in pricing on our F&B, which is only about 5%."
More importantly, though:
 Source: Dave & Buster’s/The Motley Fool
The bottom line? I've mentioned that too much of a good thing can be bad. With employment and inflation steaming in the U.S., the Fed's task of calming the pricing pressures without cracking the economy is nearly impossible.
For example, Dave & Buster's wage inflation is running at 20%, and with more money in consumers' pockets leading to more discretionary spending, how does the Fed reduce the metric to 2% without killing demand? As such, investors lack the foresight to see what's required to complete the task, as the Fed may have to orchestrate a recession to stop inflation's reign.
In conclusion, the PMs were mixed on Mar. 29, as mining stocks benefited from the bulls' stampede. However, with investors miscalculating the Fed's fury, it should be clear by now that inflation will not dissipate on its own. With killing demand the only option, Fed officials' war against inflation will likely result in plenty of casualties across the financial markets.
The Breakdown Unconfirmed
As I move to the technicals, I’d like to quote what I wrote at the beginning of the fundamentals section:
With the riskiest corners of the financial markets performing the best in recent days, it’s like the summer of 2020 all over again (remember what happened to gold in August 2020? It topped…).
The above indicates that it was the investment public that drove stock prices higher yesterday – not investment professionals – and that tends to happen close to market tops.
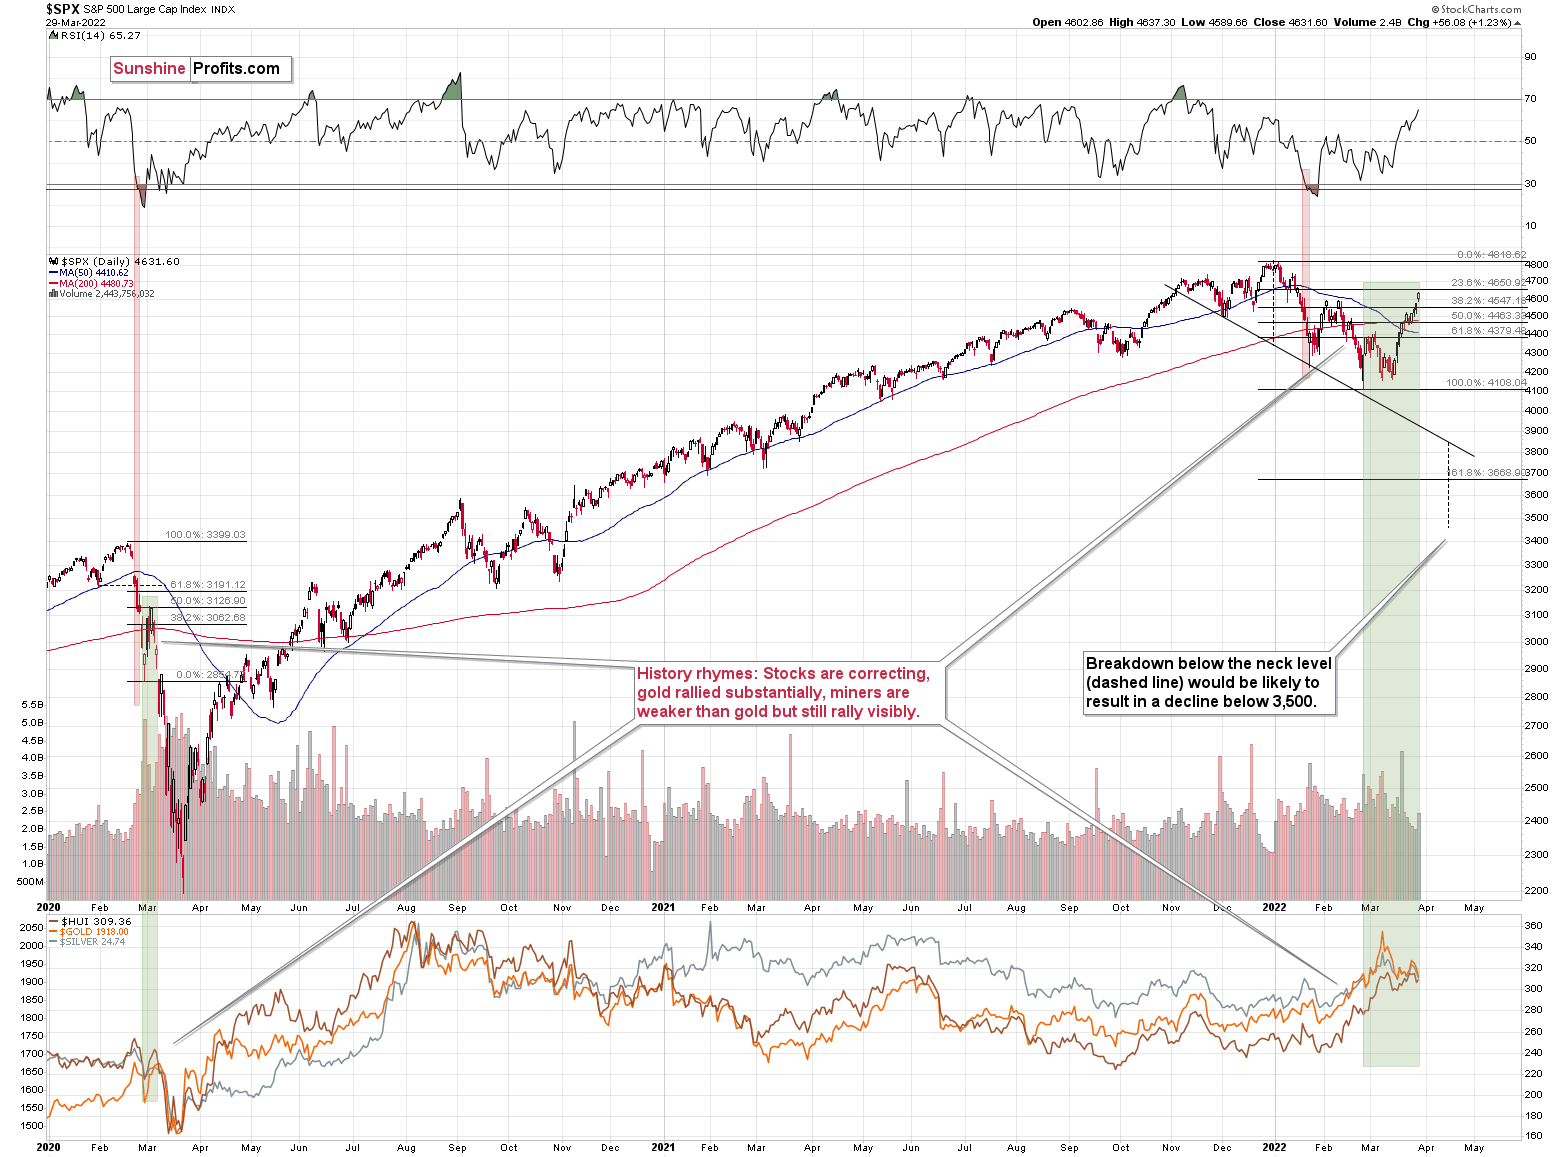
The S&P 500 rose yesterday and even managed to move above its February highs. At first sight, this appears bullish, but is it really so? Given that the riskiest stocks rallied the most, not necessarily.
Besides, stocks closed below the final of their regular Fibonacci ratios – the less known, but still important 76.4%, so they might reverse as early as today, once this resistance is reached. If that happens and the – unconfirmed (!) – breakout above the February/late-January highs is invalidated, we’ll have a strong sell signal.
While stocks rallied and the investment public (probably) entered the market, they might have also moved other assets that have been performing poorly recently. By “other assets”, I mean mining stocks. Yes, they rallied along with gold, but they were weak relative to it. Gold moved to its previous all-time high recently, and junior miners were able to rally just above their late-2021 high. They are now below this high, anyway.
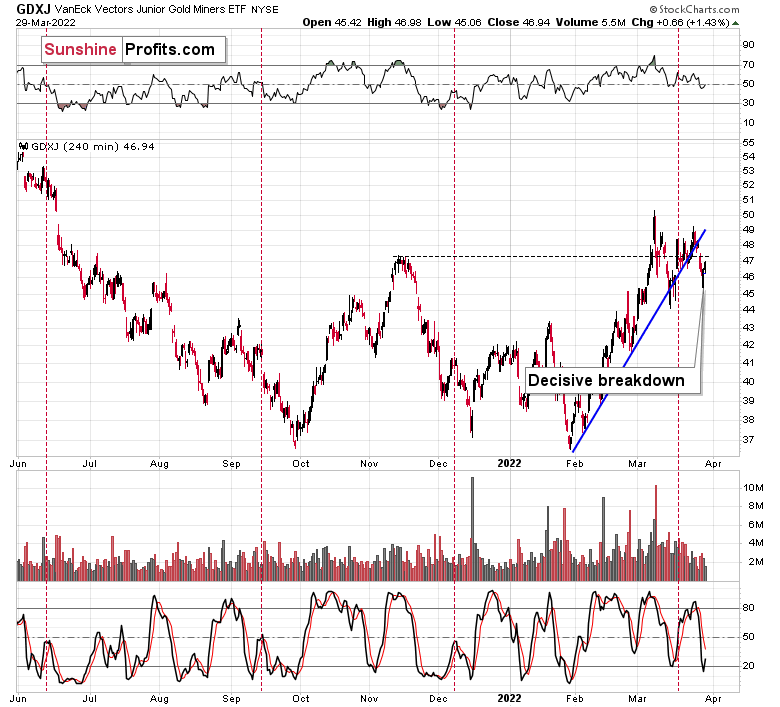
Yesterday’s breakdown below the rising support line was not invalidated.
We saw a move higher on volume that was not strong, which suggests that yesterday’s session was not a true reversal. Low volume suggests that it was a correction, and the fact that junior miners have just broken below their rising support line means that it makes perfect sense for them to correct now.
Consequently, yesterday’s action wasn’t really bullish for junior miners when we take the context into account. Speaking of context, let’s not forget about yesterday’s action in the USD Index.
The USD Index declined significantly yesterday, which means that gold, silver, and mining stocks “should have” rallied. After all, based on the USD’s decline, their prices (quoted in USD terms) became lower for non-USD buyers. So, the fact that silver and gold were practically flat yesterday is actually bearish for them, because it means they underperformed. Gold miners moved higher, but given that the USD Index declined visibly, and the general stock market rallied, it would be natural for miners to rally more than they did. Taking all this into account, miners were not really strong yesterday.
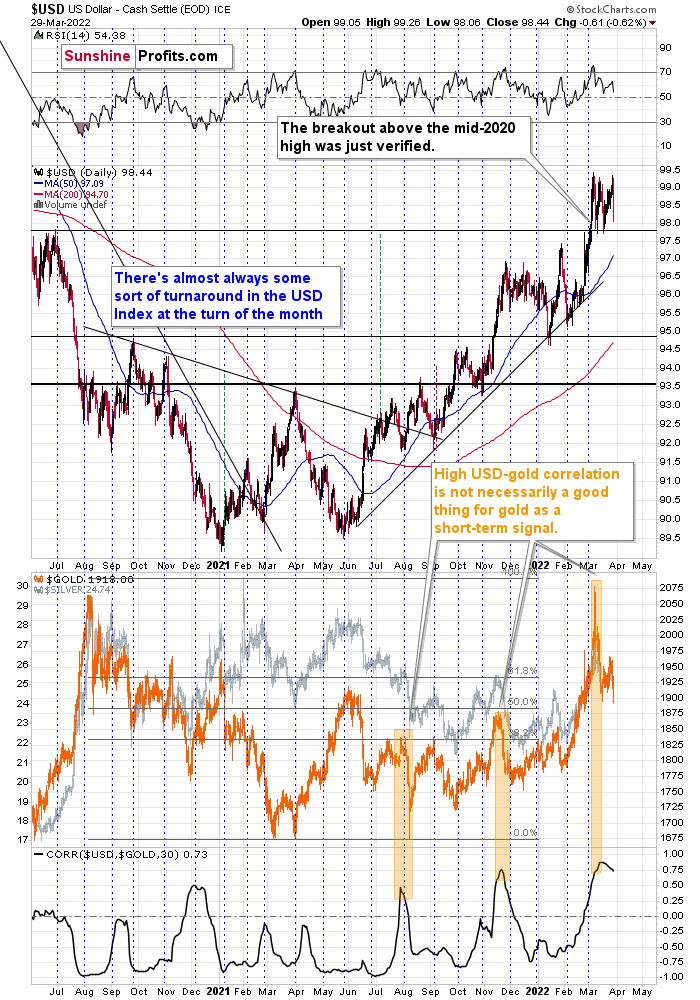
If we focus on the USD Index alone, we’ll see that yesterday’s decline was absolutely inconsequential with regard to changing the outlook for the USDX. It simply continues to consolidate after a breakout above the mid-2020 highs. Breakout + consolidation = increasing chances of rallies’ continuation. A big wave up in the USD Index is likely just around the corner, and the precious metal sector is likely to decline when it materializes.
As the war-based premiums in gold and the USD appear to be waning, a high-interest-rate-driven rally in the USD is likely to trigger declines in gold. The correlation between these two assets has started to decline. When that happened during the last two cases (marked with orange), gold plummeted profoundly shortly thereafter.
All in all, technicals favor a decline in the precious metals sector sooner rather than later.
Overview of the Upcoming Part of the Decline
- It seems to me that the corrective upswing is now over or very close to being over , and that gold, silver, and mining stocks are now likely to continue their medium-term decline.
- It seems that the first (bigger) stop for gold will be close to its previous 2021 lows, slightly below $1,800 . Then it will likely correct a bit, but it’s unclear if I want to exit or reverse the current short position based on that – it depends on the number and the nature of the bullish indications that we get at that time.
- After the above-mentioned correction, we’re likely to see a powerful slide, perhaps close to the 2020 low ($1,450 - $1,500).
- If we see a situation where miners slide in a meaningful and volatile way while silver doesn’t (it just declines moderately), I plan to – once again – switch from short positions in miners to short positions in silver. At this time, it’s too early to say at what price levels this could take place, and if we get this kind of opportunity at all – perhaps with gold close to $1,600.
- I plan to exit all remaining short positions once gold shows substantial strength relative to the USD Index while the latter is still rallying. This may be the case with gold close to $1,350 - $1,400. I expect silver to fall the hardest in the final part of the move. This moment (when gold performs very strongly against the rallying USD and miners are strong relative to gold after its substantial decline) is likely to be the best entry point for long-term investments, in my view. This can also happen with gold close to $1,375, but at the moment it’s too early to say with certainty.
- As a confirmation for the above, I will use the (upcoming or perhaps we have already seen it?) top in the general stock market as the starting point for the three-month countdown. The reason is that after the 1929 top, gold miners declined for about three months after the general stock market started to slide. We also saw some confirmations of this theory based on the analogy to 2008. All in all, the precious metals sector is likely to bottom about three months after the general stock market tops.
- The above is based on the information available today, and it might change in the following days/weeks.
You will find my general overview of the outlook for gold on the chart below:
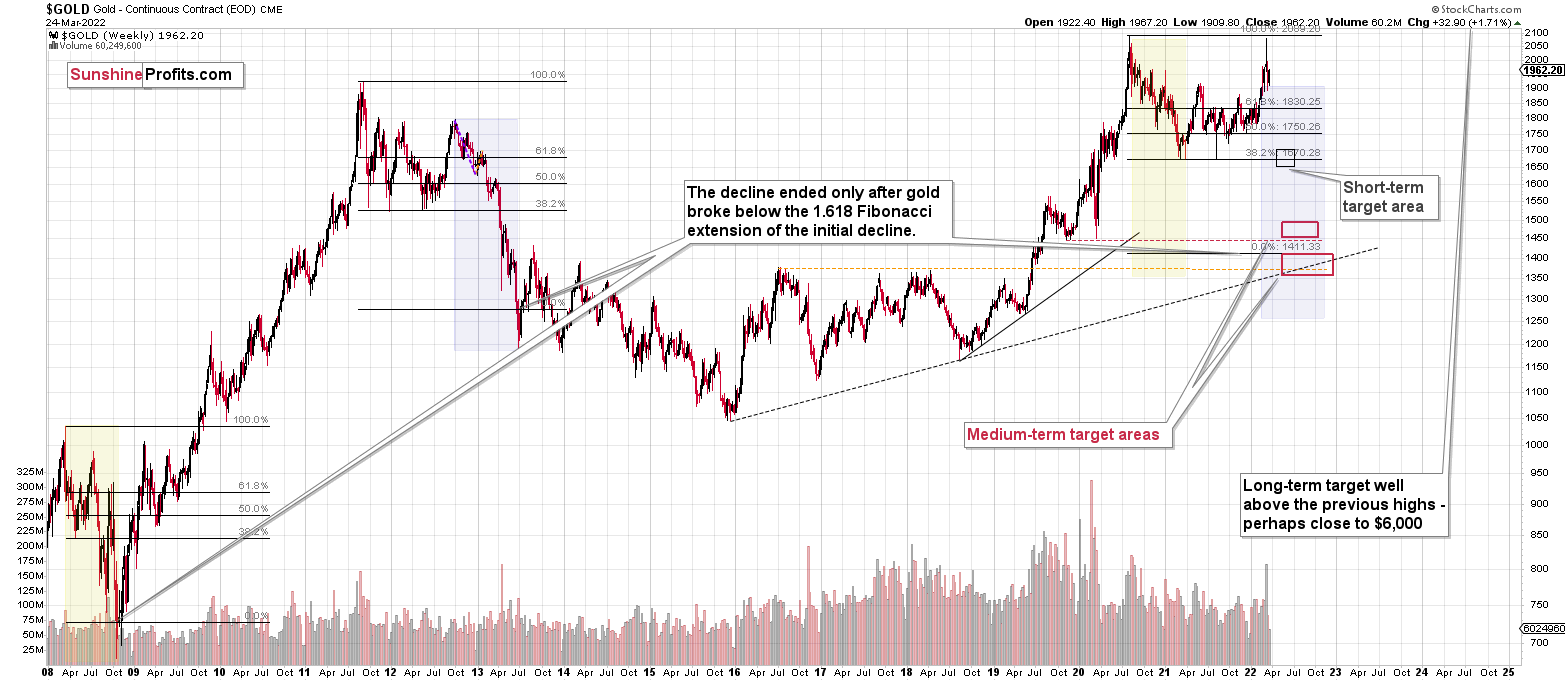
Please note that the above timing details are relatively broad and “for general overview only” – so that you know more or less what I think and how volatile I think the moves are likely to be – on an approximate basis. These time targets are not binding or clear enough for me to think that they should be used for purchasing options, warrants or similar instruments.
Summary
Summing up, despite the recent rally in gold, the outlook for junior mining stocks remains exactly as I described previously.
Crude oil’s extreme outperformance, the stock market’s weakness, and critical medium-term resistance levels reached by gold (all-time high!) and junior mining stocks, all indicate that the tops are at hand or have just formed. The huge-volume reversals in gold and (especially) mining stocks, along with silver’s short-term outperformance, all point to lower precious metals prices in the following days/weeks. It seems that the top is in.
Investing and trading are difficult. If it was easy, most people would be making money – and they’re not. Right now, it’s most difficult to ignore the urge to “run for cover” if you physically don’t have to. The markets move on “buy the rumor and sell the fact.” This repeats over and over again in many (all?) markets, and we have direct analogies to similar situations in gold itself. Junior miners are likely to decline the most, also based on the massive declines that are likely to take place (in fact, they have already started) in the stock markets.
From the medium-term point of view, the two key long-term factors remain the analogy to 2013 in gold and the broad head and shoulders pattern in the HUI Index. They both suggest much lower prices ahead.
It seems that our profits from short positions are going to become truly epic in the coming months.
After the sell-off (that takes gold to about $1,350-$1,500), I expect the precious metals to rally significantly. The final part of the decline might take as little as 1-5 weeks, so it's important to stay alert to any changes.
Most importantly, please stay healthy and safe. We made a lot of money last March and this March, and it seems that we’re about to make much more in the upcoming decline, but you have to be healthy to enjoy the results.
As always, we'll keep you - our subscribers - informed.
To summarize:
Trading capital (supplementary part of the portfolio; our opinion): Full speculative short positions (300% of the full position) in junior mining stocks are justified from the risk to reward point of view with the following binding exit profit-take price levels:
Mining stocks (price levels for the GDXJ ETF): binding profit-take exit price: $34.63; stop-loss: none (the volatility is too big to justify a stop-loss order in case of this particular trade)
Alternatively, if one seeks leverage, we’re providing the binding profit-take levels for the JDST (2x leveraged) and GDXD (3x leveraged – which is not suggested for most traders/investors due to the significant leverage). The binding profit-take level for the JDST: $14.98; stop-loss for the JDST: none (the volatility is too big to justify a SL order in case of this particular trade); binding profit-take level for the GDXD: $25.48; stop-loss for the GDXD: none (the volatility is too big to justify a SL order in case of this particular trade).
For-your-information targets (our opinion; we continue to think that mining stocks are the preferred way of taking advantage of the upcoming price move, but if for whatever reason one wants / has to use silver or gold for this trade, we are providing the details anyway.):
Silver futures downside profit-take exit price: $19.12
SLV profit-take exit price: $17.72
ZSL profit-take exit price: $38.28
Gold futures downside profit-take exit price: $1,683
HGD.TO – alternative (Canadian) inverse 2x leveraged gold stocks ETF – the upside profit-take exit price: $11.79
HZD.TO – alternative (Canadian) inverse 2x leveraged silver ETF – the upside profit-take exit price: $29.48
Long-term capital (core part of the portfolio; our opinion): No positions (in other words: cash
Insurance capital (core part of the portfolio; our opinion): Full position
Whether you already subscribed or not, we encourage you to find out how to make the most of our alerts and read our replies to the most common alert-and-gold-trading-related-questions.
Please note that we describe the situation for the day that the alert is posted in the trading section. In other words, if we are writing about a speculative position, it means that it is up-to-date on the day it was posted. We are also featuring the initial target prices to decide whether keeping a position on a given day is in tune with your approach (some moves are too small for medium-term traders, and some might appear too big for day-traders).
Additionally, you might want to read why our stop-loss orders are usually relatively far from the current price.
Please note that a full position doesn't mean using all of the capital for a given trade. You will find details on our thoughts on gold portfolio structuring in the Key Insights section on our website.
As a reminder - "initial target price" means exactly that - an "initial" one. It's not a price level at which we suggest closing positions. If this becomes the case (like it did in the previous trade), we will refer to these levels as levels of exit orders (exactly as we've done previously). Stop-loss levels, however, are naturally not "initial", but something that, in our opinion, might be entered as an order.
Since it is impossible to synchronize target prices and stop-loss levels for all the ETFs and ETNs with the main markets that we provide these levels for (gold, silver and mining stocks - the GDX ETF), the stop-loss levels and target prices for other ETNs and ETF (among other: UGL, GLL, AGQ, ZSL, NUGT, DUST, JNUG, JDST) are provided as supplementary, and not as "final". This means that if a stop-loss or a target level is reached for any of the "additional instruments" (GLL for instance), but not for the "main instrument" (gold in this case), we will view positions in both gold and GLL as still open and the stop-loss for GLL would have to be moved lower. On the other hand, if gold moves to a stop-loss level but GLL doesn't, then we will view both positions (in gold and GLL) as closed. In other words, since it's not possible to be 100% certain that each related instrument moves to a given level when the underlying instrument does, we can't provide levels that would be binding. The levels that we do provide are our best estimate of the levels that will correspond to the levels in the underlying assets, but it will be the underlying assets that one will need to focus on regarding the signs pointing to closing a given position or keeping it open. We might adjust the levels in the "additional instruments" without adjusting the levels in the "main instruments", which will simply mean that we have improved our estimation of these levels, not that we changed our outlook on the markets. We are already working on a tool that would update these levels daily for the most popular ETFs, ETNs and individual mining stocks.
Our preferred ways to invest in and to trade gold along with the reasoning can be found in the how to buy gold section. Furthermore, our preferred ETFs and ETNs can be found in our Gold & Silver ETF Ranking.
As a reminder, Gold & Silver Trading Alerts are posted before or on each trading day (we usually post them before the opening bell, but we don't promise doing that each day). If there's anything urgent, we will send you an additional small alert before posting the main one.
Thank you.
Przemyslaw Radomski, CFA
Founder, Editor-in-chief

