

Briefly: in our opinion, full (300% of the regular position size) speculative short positions in junior mining stocks are justified from the risk/reward point of view at the moment of publishing this Alert.
Today’s analysis is posted a bit later than usually, but there’s a good reason for it. I wanted to check today’s relative performance of gold, silver, and mining stocks, as it seemed to me that we might see topping confirmations. And we did. During the beginning minutes of today’s (Mar. 24) session, silver price shot up (SLV is up by 2%), while gold moved higher just somewhat (GLD is up by 0.41%), and gold stocks are underperforming (GDX is up by 0.23% and GDXJ is down by 0.08%). This is a very short-term indication that the top is likely in, or at hand.
Having said that, let’s discuss the relative valuations in greater detail, as – given the lack of significant directional action in the recent past - this is the most informative part of the current trading landscape in the precious metals sector.
Gold stocks (GDX, GDXJ, HUI Index) have recently been quite strong relative to gold. Ok, but is this necessarily bullish? It might be, until one takes into account the fact that we saw the same thing at the 2012 top! This changes everything, and it does so, because the links between now and that top are almost everywhere: in gold, in silver, in gold stocks, and even in their ratios.
And it is the gold stocks to gold ratio that I would like to start with today. That’s the flagship proxy for the relationship between these two markets.
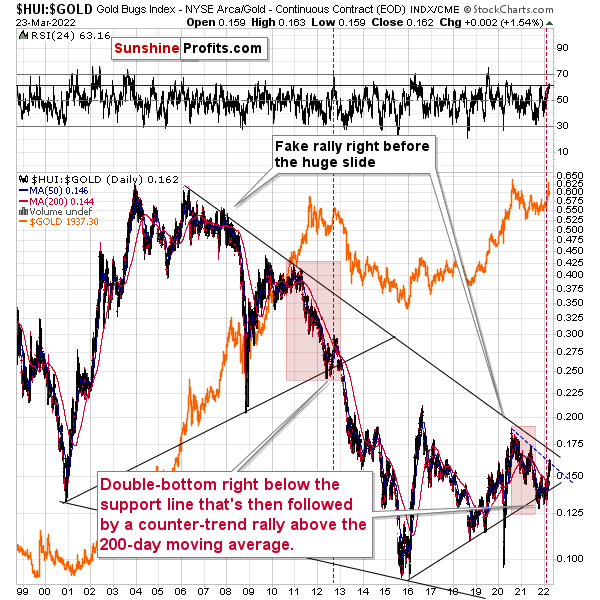
As it turns out, gold stocks to gold ratio are behaving almost identically as they were behaving at the 2012 top in the precious metals sector.
In both cases, the ratio moved below the rising medium-term support line, then formed a double-bottom below the line, and invalidated the breakdown, which resulted in a counter-trend rally. The rally ended shortly after the ratio moved above its 200-day moving average (marked with red). That’s what happened recently. What happened next in 2012? The decline not only continued – it accelerated!
Consequently, the recent action in the ratio is not really bullish. In other words, the fact that gold stocks were recently (in the short run only) strong relative to gold doesn’t make the medium-term outlook for the precious metals sector bullish. Conversely, it remains bearish.
Interestingly, the ratio itself moved to its declining resistance line, indicating that the corrective upswing might already be over or almost over. We get the same indication from the RSI indicator. It’s not above 70, but in case of most local tops, the RSI didn’t have to move above 70. It just moved to more or less the same levels – I marked it with a horizontal, blue line.
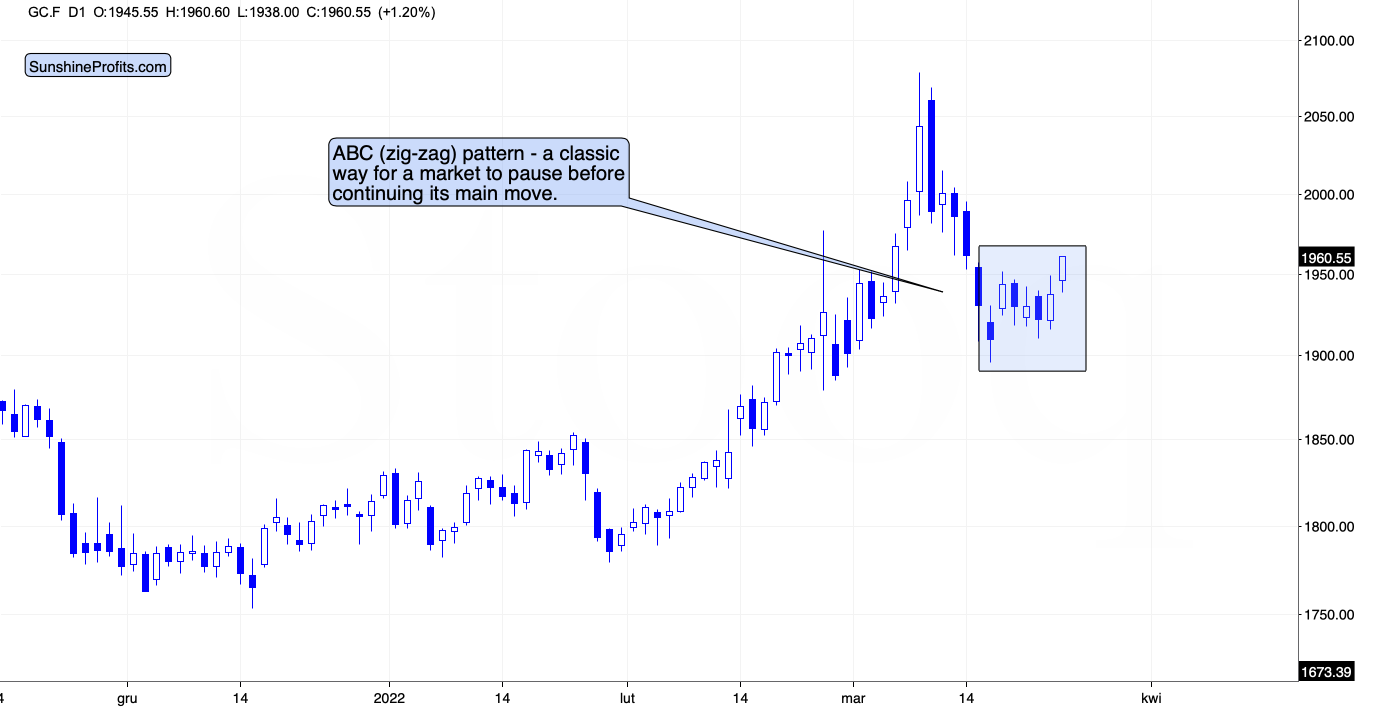
On a short-term basis, we see that gold price moved higher, but it’s well within what one might consider normal during corrections. In fact, gold appears to be forming a classic ABC (zigzag) pattern. This – along with today’s outperformance of silver and underperformance of mining stocks – is an indication that the big decline is about to continue.
Having said that, let’s take a look at the market from a more fundamental point of view.
Bear Market Rallies
While the S&P 500 made a relatively resilient comeback in recent weeks, the U.S. equity benchmark could be ripe for a reversal. And with the GDXJ ETF often more correlated with U.S. equities than the rest of the PMs, a profound drawdown could crack the junior miners’ seemingly solid sentiment.
To explain, I warned on Mar. 10 that when investors overplay their bearish hands, the outcome is often bullish. I wrote:
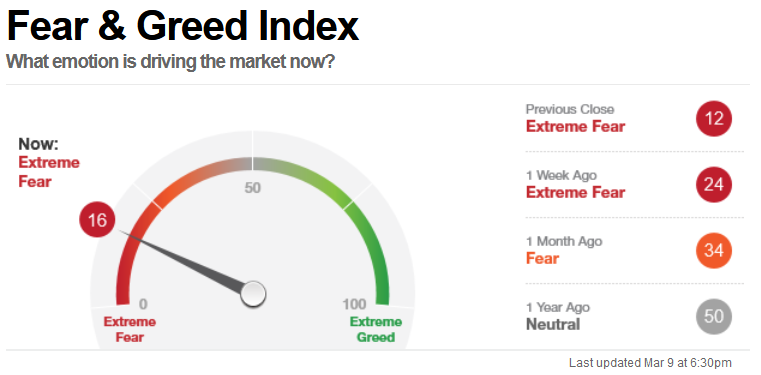
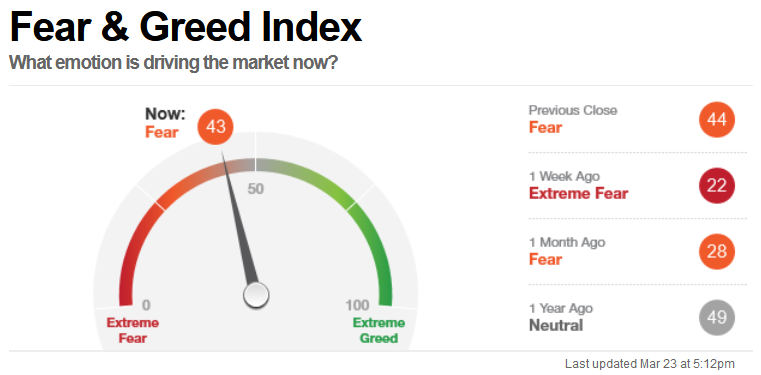
With the S&P 500 shifting from depressed to euphoric on a seemingly hourly basis, the rally on Mar. 9 did little to offset the “Extreme Fear” reading present on CNN’s Fear & Greed Index.
Please see below:
 Source: CNN
Moreover, after the index sunk to 12 on Mar. 8, investors’ fear hit its highest level since the COVID-19 crisis unfolded.
 Source: CNN
As a result, the Russia-Ukraine conflict has freaked out investors. And when geopolitical panic unfolds, they pile into safe havens like the PMs.
However, even if the short term proves more difficult, the medium-term fundamentals remain unchanged: the Fed should raise interest rates several times in the coming months, and the PMs will likely feel this pain when the Russia-Ukraine conflict no longer dominates the headlines.
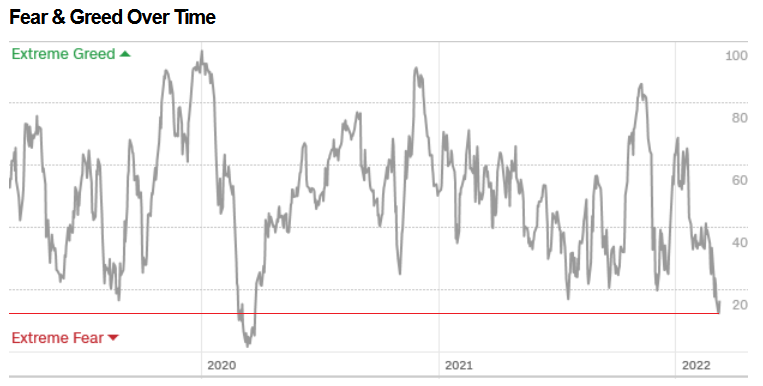
Furthermore, with the initial drawdown a function of Russia-Ukraine fears, stock market investors’ attention has shifted from geopolitical conflict to the Fed. In addition, with CNN’s Fear & Greed Index approaching the neutral zone, the setup is ripe for another sharp drawdown. As such, while the PMs remain uplifted due to the geopolitical tensions, they’re unlikely to sidestep the volatility for much longer.
Please see below:
 Source: CNN
To that point, after material relief rallies unfolded across Big Tech, the bear market bounce should give way to lower lows over the medium term.
Please see below:
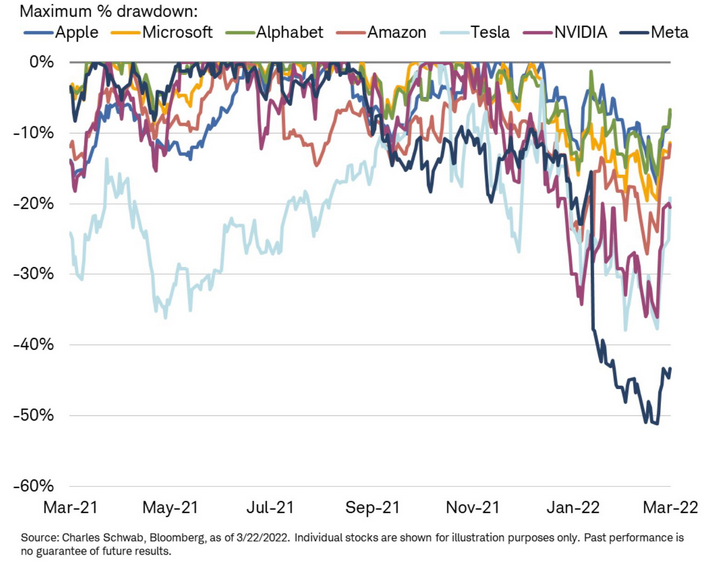
To explain, the various lines above track the performance of some of Big Tech’s major players over the last year. If you analyze the right side of the chart, you can see that oversold conditions led to corrective upswings. However, with the S&P 500 and the NASDAQ 100 still underwater year-to-date (YTD), more downside should materialize now that some extreme indicators have normalized. As such, the PMs should feel the pain as the drama unfolds.
As evidence, I’ve warned numerous times that investors are often the most bearish at the bottom and the most bullish at the top. Moreover, with the latest rally resulting in calls for new all-time highs, the psychological effect of higher prices often clouds investors’ judgment. However, haven’t we seen this movie before?
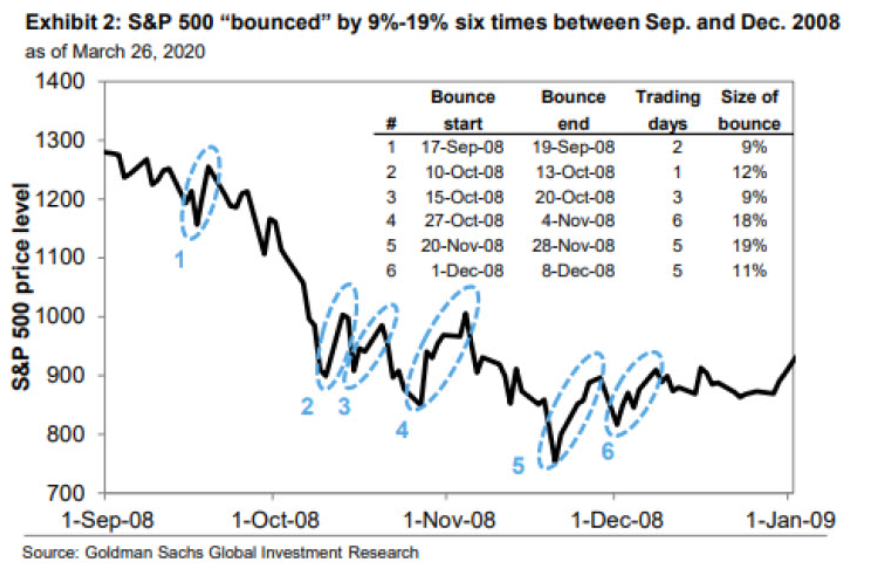
To explain, the black line above tracks the performance of the S&P 500 between September and December 2008. If you analyze the blue ellipses, you can see that the index recorded relief rallies of 9% to 19% during the tumultuous period. However, drawdowns ultimately followed, and four of the declines resulted in lower lows. As such, the stock market often lures investors in right before it pulls the rug from under them.
To that point, the S&P 500 and the NASDAQ 100 are still following their 2018 analogs. For context, I wrote on Feb. 22:
When the Fed’s rate hike cycle roiled the NASDAQ 100 in 2017-2018, the GDXJ ETF suffered too. Thus, while the Russia-Ukraine drama has provided a distraction, the fundamentals that impacted both asset classes back then are present now.
Please see below:
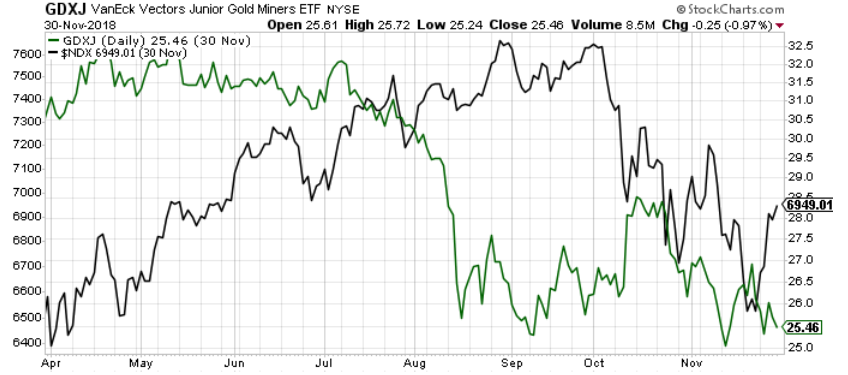
To explain, the green line above tracks the GDXJ ETF in 2018, while the black line above tracks the NASDAQ 100. If you analyze the performance, you can see that the Fed’s rate hike cycle initially rattled the former and the latter rolled over soon after. However, the negativity persisted until Fed Chairman Jerome Powell performed a dovish pivot and both assets rallied. As a result, with the Fed Chair unlikely to perform a dovish pivot this time around, the junior miners have some catching up to do.
Furthermore, while the GDXJ ETF hasn’t participated in the general stock market’s recent suffering, the junior miners’ mettle should be tested if (when) the next bout of volatility unfolds.
Please see below:
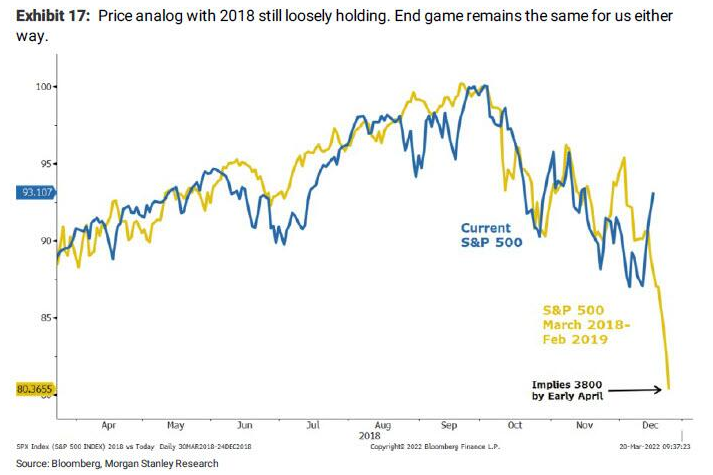
To explain, the gold line above tracks the S&P 500's performance from March 2018 to February 2019, while the blue line above tracks the S&P 500's current performance. If you analyze the relationship, it's a near-splitting image. Moreover, with the next leg down implying an S&P 500 of 3,800, the GDXJ ETF may not stand so tall this time around.
Also noteworthy, Morgan Stanley's Chief U.S. Equity Strategist Mike Wilson told clients that "last week was nothing more than a vicious bear market rally, in our view, and while it may not be completely finished, it is a rally to sell."
Moreover, in line with what I've been warning about for some time, he added:
"We are likely to undershoot our 18x [S&P 500 forward PE] target, to the downside. The Fed (and other central banks) are very focused on inflation, and Russia's invasion of Ukraine only increases the pressure on prices, especially food and energy. Meanwhile, the situation is weighing further on both consumer and business confidence, which is not good for growth, nor is it priced."
Speaking of valuation, Bank of America's Global EPS (earnings per share) Model implies negative year-over-year (YoY) percentage growth by December 2022.
Please see below:
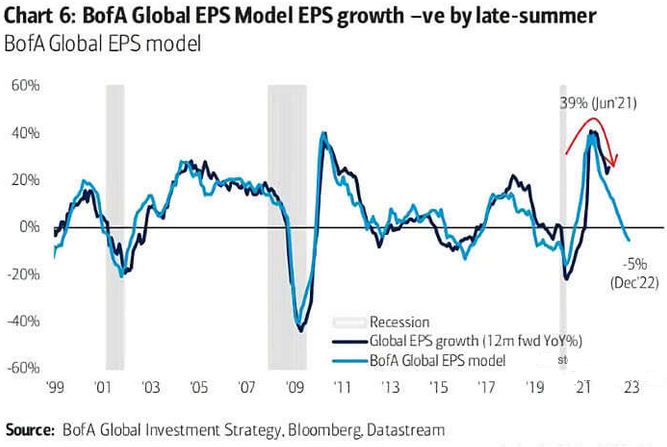
To explain, the dark blue line above tracks the YoY percentage change in global EPS, while the light blue line above tracks the 12-month forward expected YoY percentage change implied by Bank of America's model.
If you analyze the relationship, it's a rather tight fit. More importantly, though, if you focus your attention on the right side of the chart, you can see that the light blue line paints a dark portrait of global EPS growth over the next 12 months. As a result, sentiment and valuation could collide for a profound drawdown of the S&P 500.
Furthermore, Bank of America predicts that earnings won't justify the S&P 500's lofty valuation, aligning with Wilson's expectations. For context, Wilson puts an 18x PE multiple on his 12-month earnings estimate. However, even though Bank of America's multiple is more generous, the outcome is still the same.
Please see below:
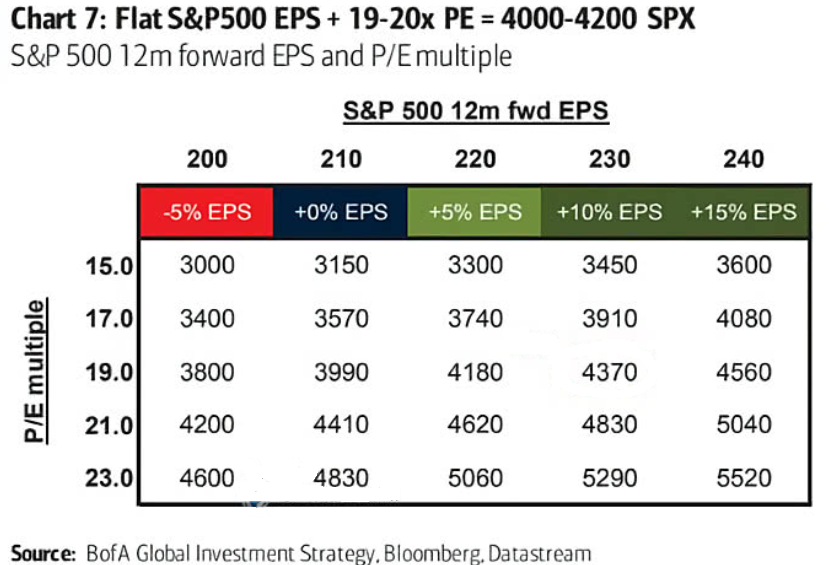
To explain, the matrix above outlines hypothetical S&P 500 values based on 12-month EPS figures and growth. For example, applying Bank of America’s Global EPS Model forecast, a 5% YoY decline and a 19x multiple puts the S&P 500 at 3,800. Moreover, if we assume 5% YoY growth and a 19x multiple, it still works out to 4,180.
In addition, if bearish sentiment results in an “undershoot” of Wilson’s 18x multiple, 5% YoY growth and a 17x multiple implies an S&P 500 of 3,740. As such, the general stock market may play a profound role in driving the PMs lower over the next few months.
Continuing the theme, rising U.S. Treasury yields are also a major headwind for U.S. equities. For context, U.S. Treasuries are considered ‘risk-free’ securities due to the unlikely potential for a U.S. sovereign default. However, when assets with lower risk profiles increase their returns, why incur the S&P 500’s volatility?
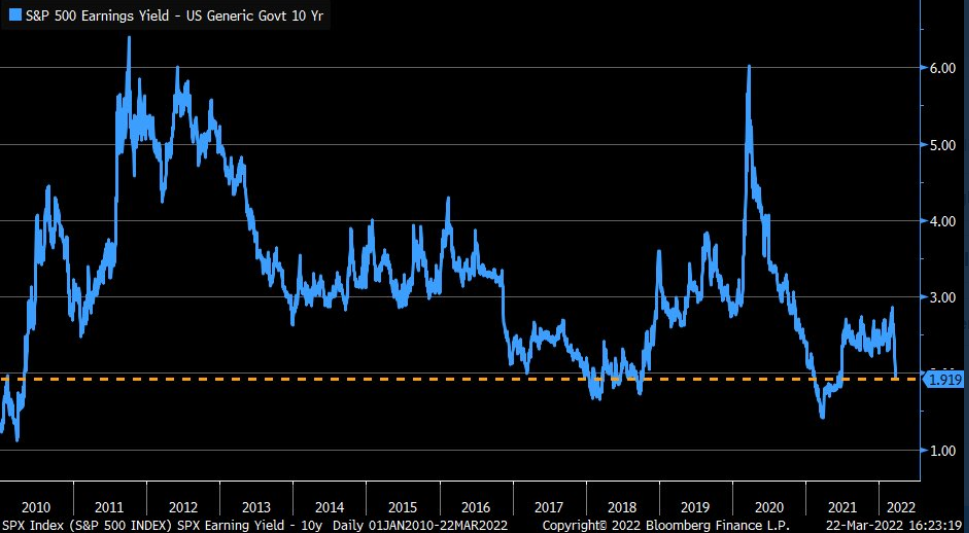
To explain, the blue line above tracks the spread of the S&P 500's earnings yield (EPS divided by price) minus the U.S. 10-Year Treasury yield. If you analyze the right side of the chart, you can see that the recent rally in bond yields has pushed the spread to relative lows. As a result, the S&P 500's earnings return over U.S. Treasuries has declined, and investors assume more relative risk to remain in the stock market.
Finally, I've sounded the alarm on the Fed's hawkish disposition for some time. And with many global central banks embarking on their own rate hike cycles, the risk of a potential shock has increased.
Please see below:
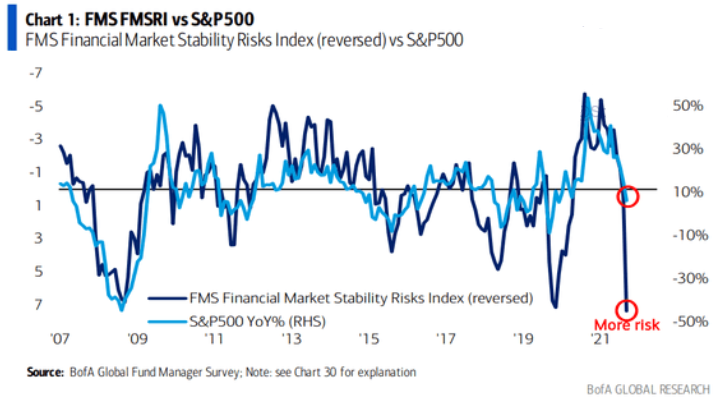
To explain, the light blue line above tracks the YoY percentage change in the S&P 500, while the dark blue line above tracks institutional investors’ perception of financial market stability risks (inverted). If you analyze the right side of the chart, you can see that concerns over stability are at crisis levels. However, the YoY percentage change in the S&P 500 remains relatively elevated. As a result, the data adds more fuel to the bearish fire.
The bottom line? The next leg down should begin now that the S&P 500 has bounced and sentiment has normalized. Remember, asset prices don’t move in a straight line, and corrective upswings are almost always present during bear markets. Moreover, with the GDXJ ETF remaining elevated due to the Russia-Ukraine conflict, it has plenty of room to move lower. As a result, the next few months should be much less cheerful for the PMs.
In conclusion, the PMs rallied on Mar. 23, as another spike in crude helped uplift the commodity complex. However, the PMs’ domestic fundamentals couldn’t be more bearish, and if the general stock market plunges, it will likely increase the negativity. As a result, while the PMs remain in investors’ good graces for now, a profound shift should occur over the medium term.
Overview of the Upcoming Part of the Decline
- It seems to me that the corrective upswing is now over or very close to being over , and that gold, silver, and mining stocks are now likely to continue their medium-term decline.
- It seems that the first (bigger) stop for gold will be close to its previous 2021 lows, slightly below $1,800 . Then it will likely correct a bit, but it’s unclear if I want to exit or reverse the current short position based on that – it depends on the number and the nature of the bullish indications that we get at that time.
- After the above-mentioned correction, we’re likely to see a powerful slide, perhaps close to the 2020 low ($1,450 - $1,500).
- If we see a situation where miners slide in a meaningful and volatile way while silver doesn’t (it just declines moderately), I plan to – once again – switch from short positions in miners to short positions in silver. At this time, it’s too early to say at what price levels this could take place, and if we get this kind of opportunity at all – perhaps with gold close to $1,600.
- I plan to exit all remaining short positions once gold shows substantial strength relative to the USD Index while the latter is still rallying. This may be the case with gold close to $1,350 - $1,400. I expect silver to fall the hardest in the final part of the move. This moment (when gold performs very strongly against the rallying USD and miners are strong relative to gold after its substantial decline) is likely to be the best entry point for long-term investments, in my view. This can also happen with gold close to $1,375, but at the moment it’s too early to say with certainty.
- As a confirmation for the above, I will use the (upcoming or perhaps we have already seen it?) top in the general stock market as the starting point for the three-month countdown. The reason is that after the 1929 top, gold miners declined for about three months after the general stock market started to slide. We also saw some confirmations of this theory based on the analogy to 2008. All in all, the precious metals sector is likely to bottom about three months after the general stock market tops.
- The above is based on the information available today, and it might change in the following days/weeks.
You will find my general overview of the outlook for gold on the chart below:
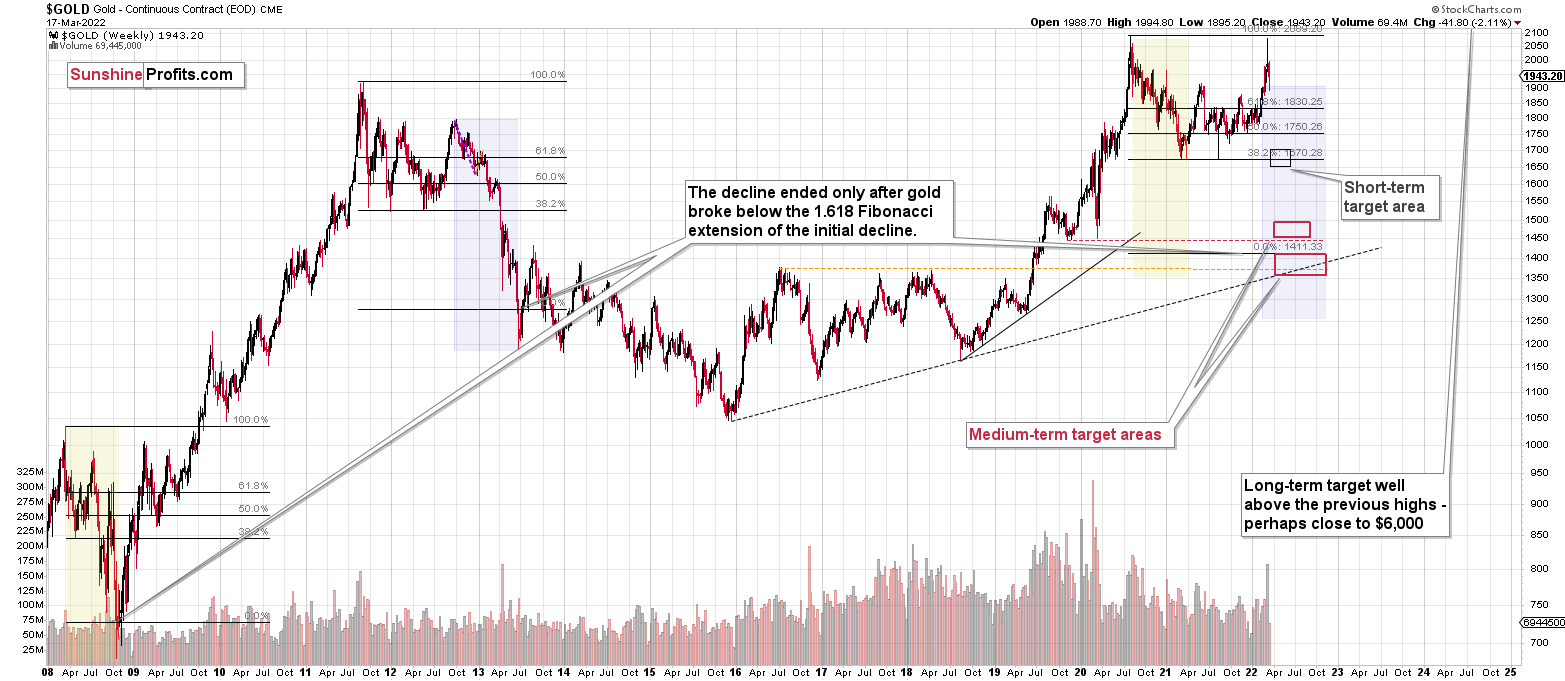
Please note that the above timing details are relatively broad and “for general overview only” – so that you know more or less what I think and how volatile I think the moves are likely to be – on an approximate basis. These time targets are not binding or clear enough for me to think that they should be used for purchasing options, warrants or similar instruments.
Summary
Summing up, despite the recent rally in gold, the outlook for junior mining stocks remains exactly as I described previously.
Crude oil’s extreme outperformance, the stock market’s weakness, and critical medium-term resistance levels reached by gold (all-time high!) and junior mining stocks, all indicate that the tops are at hand or have just formed. The huge-volume reversals in gold and (especially) mining stocks, along with silver’s short-term outperformance, all point to lower precious metals prices in the following days/weeks. It seems that the top is in.
Investing and trading are difficult. If it was easy, most people would be making money – and they’re not. Right now, it’s most difficult to ignore the urge to “run for cover” if you physically don’t have to. The markets move on “buy the rumor and sell the fact.” This repeats over and over again in many (all?) markets, and we have direct analogies to similar situations in gold itself. Junior miners are likely to decline the most, also based on the massive declines that are likely to take place (in fact, they have already started) in the stock markets.
From the medium-term point of view, the two key long-term factors remain the analogy to 2013 in gold and the broad head and shoulders pattern in the HUI Index. They both suggest much lower prices ahead.
It seems that our profits from short positions are going to become truly epic in the coming months.
After the sell-off (that takes gold to about $1,350-$1,500), I expect the precious metals to rally significantly. The final part of the decline might take as little as 1-5 weeks, so it's important to stay alert to any changes.
Most importantly, please stay healthy and safe. We made a lot of money last March and this March, and it seems that we’re about to make much more in the upcoming decline, but you have to be healthy to enjoy the results.
As always, we'll keep you - our subscribers - informed.
To summarize:
Trading capital (supplementary part of the portfolio; our opinion): Full speculative short positions (300% of the full position) in junior mining stocks are justified from the risk to reward point of view with the following binding exit profit-take price levels:
Mining stocks (price levels for the GDXJ ETF): binding profit-take exit price: $34.63; stop-loss: none (the volatility is too big to justify a stop-loss order in case of this particular trade)
Alternatively, if one seeks leverage, we’re providing the binding profit-take levels for the JDST (2x leveraged) and GDXD (3x leveraged – which is not suggested for most traders/investors due to the significant leverage). The binding profit-take level for the JDST: $14.98; stop-loss for the JDST: none (the volatility is too big to justify a SL order in case of this particular trade); binding profit-take level for the GDXD: $25.48; stop-loss for the GDXD: none (the volatility is too big to justify a SL order in case of this particular trade).
For-your-information targets (our opinion; we continue to think that mining stocks are the preferred way of taking advantage of the upcoming price move, but if for whatever reason one wants / has to use silver or gold for this trade, we are providing the details anyway.):
Silver futures downside profit-take exit price: $19.12
SLV profit-take exit price: $17.72
ZSL profit-take exit price: $38.28
Gold futures downside profit-take exit price: $1,683
HGD.TO – alternative (Canadian) inverse 2x leveraged gold stocks ETF – the upside profit-take exit price: $11.79
HZD.TO – alternative (Canadian) inverse 2x leveraged silver ETF – the upside profit-take exit price: $29.48
Long-term capital (core part of the portfolio; our opinion): No positions (in other words: cash
Insurance capital (core part of the portfolio; our opinion): Full position
Whether you already subscribed or not, we encourage you to find out how to make the most of our alerts and read our replies to the most common alert-and-gold-trading-related-questions.
Please note that we describe the situation for the day that the alert is posted in the trading section. In other words, if we are writing about a speculative position, it means that it is up-to-date on the day it was posted. We are also featuring the initial target prices to decide whether keeping a position on a given day is in tune with your approach (some moves are too small for medium-term traders, and some might appear too big for day-traders).
Additionally, you might want to read why our stop-loss orders are usually relatively far from the current price.
Please note that a full position doesn't mean using all of the capital for a given trade. You will find details on our thoughts on gold portfolio structuring in the Key Insights section on our website.
As a reminder - "initial target price" means exactly that - an "initial" one. It's not a price level at which we suggest closing positions. If this becomes the case (like it did in the previous trade), we will refer to these levels as levels of exit orders (exactly as we've done previously). Stop-loss levels, however, are naturally not "initial", but something that, in our opinion, might be entered as an order.
Since it is impossible to synchronize target prices and stop-loss levels for all the ETFs and ETNs with the main markets that we provide these levels for (gold, silver and mining stocks - the GDX ETF), the stop-loss levels and target prices for other ETNs and ETF (among other: UGL, GLL, AGQ, ZSL, NUGT, DUST, JNUG, JDST) are provided as supplementary, and not as "final". This means that if a stop-loss or a target level is reached for any of the "additional instruments" (GLL for instance), but not for the "main instrument" (gold in this case), we will view positions in both gold and GLL as still open and the stop-loss for GLL would have to be moved lower. On the other hand, if gold moves to a stop-loss level but GLL doesn't, then we will view both positions (in gold and GLL) as closed. In other words, since it's not possible to be 100% certain that each related instrument moves to a given level when the underlying instrument does, we can't provide levels that would be binding. The levels that we do provide are our best estimate of the levels that will correspond to the levels in the underlying assets, but it will be the underlying assets that one will need to focus on regarding the signs pointing to closing a given position or keeping it open. We might adjust the levels in the "additional instruments" without adjusting the levels in the "main instruments", which will simply mean that we have improved our estimation of these levels, not that we changed our outlook on the markets. We are already working on a tool that would update these levels daily for the most popular ETFs, ETNs and individual mining stocks.
Our preferred ways to invest in and to trade gold along with the reasoning can be found in the how to buy gold section. Furthermore, our preferred ETFs and ETNs can be found in our Gold & Silver ETF Ranking.
As a reminder, Gold & Silver Trading Alerts are posted before or on each trading day (we usually post them before the opening bell, but we don't promise doing that each day). If there's anything urgent, we will send you an additional small alert before posting the main one.
Thank you.
Przemyslaw Radomski, CFA
Founder, Editor-in-chief

