

Briefly: In our opinion, full (150% of the regular full position) speculative short positions in gold, silver and mining stocks are justified from the risk/reward perspective at the moment of publishing this alert.
Yesterday’s intraday actions resulted in little change in terms of the closing prices, but the reversal themselves were significant – they further validated some of the patterns that we’re seeing in gold and silver (triangles) and we even saw a “mutation” in the euro as the head and shoulders pattern just got an extra shoulder. What does all this mean for us – precious metals investors and traders – going forward?
Quite a few things and it seems better to explain them one by one after each chart – so let’s get to it (chart courtesy of http://stockcharts.com).
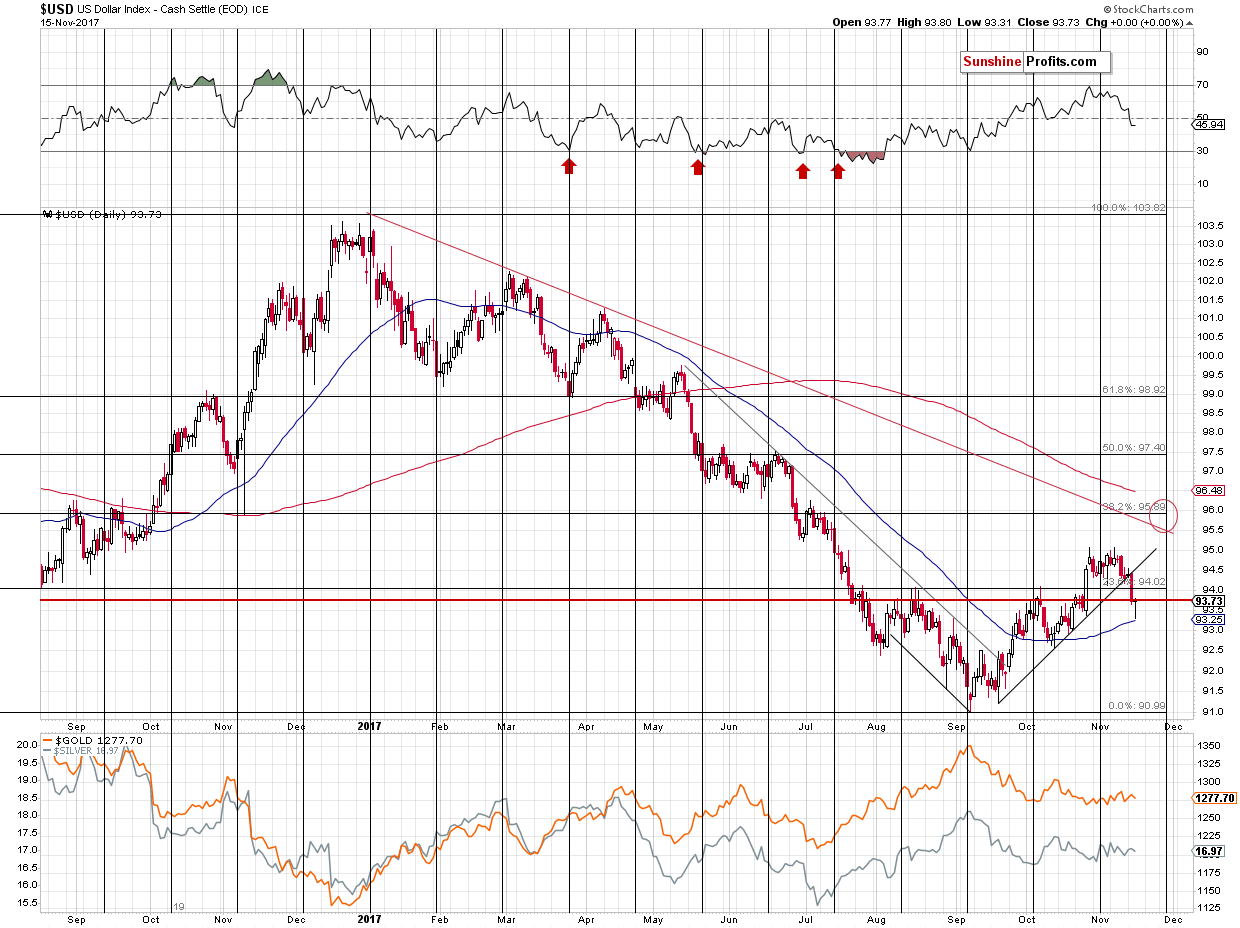
In the case of the USD Index, our yesterday’s comments remain up-to-date:
The USD Index finally closed the session below the October and August highs in terms of the intraday prices, however, there was no visible breakdown below the same highs in terms of the daily closing prices.
So, was the breakdown really a game changer? The above and the additional detail seem to invalidate this theory at least at this time. The additional detail is that the current rally (that started in September) has been to some extent a reflection of the previous months of declines. The line that’s analogous to the rising support line that was just broken is the declining line based on August and September lows. The early August low was also visibly below the line and a reflection thereof would be a temporary move below the current support line – that’s what we saw yesterday. The above analogy is not very clear so it’s not very strong, but still, that’s something to keep in mind.
The most important thing about yesterday’s decline in the fact that metals barely reacted to it and miners even managed to close below the previous day’s low. Since the reaction was so small and even negative in the case of miners, should one really be expecting the PMs to soar if the USD declines again? Not really.
But why did the USD Index decline at all? It wasn’t about weakness in the USD per se – it was about the strength in the euro. The Japanese yen has barely moved and at the same time gold’s price in terms of the euro declined sharply.
What actually happened in the euro?
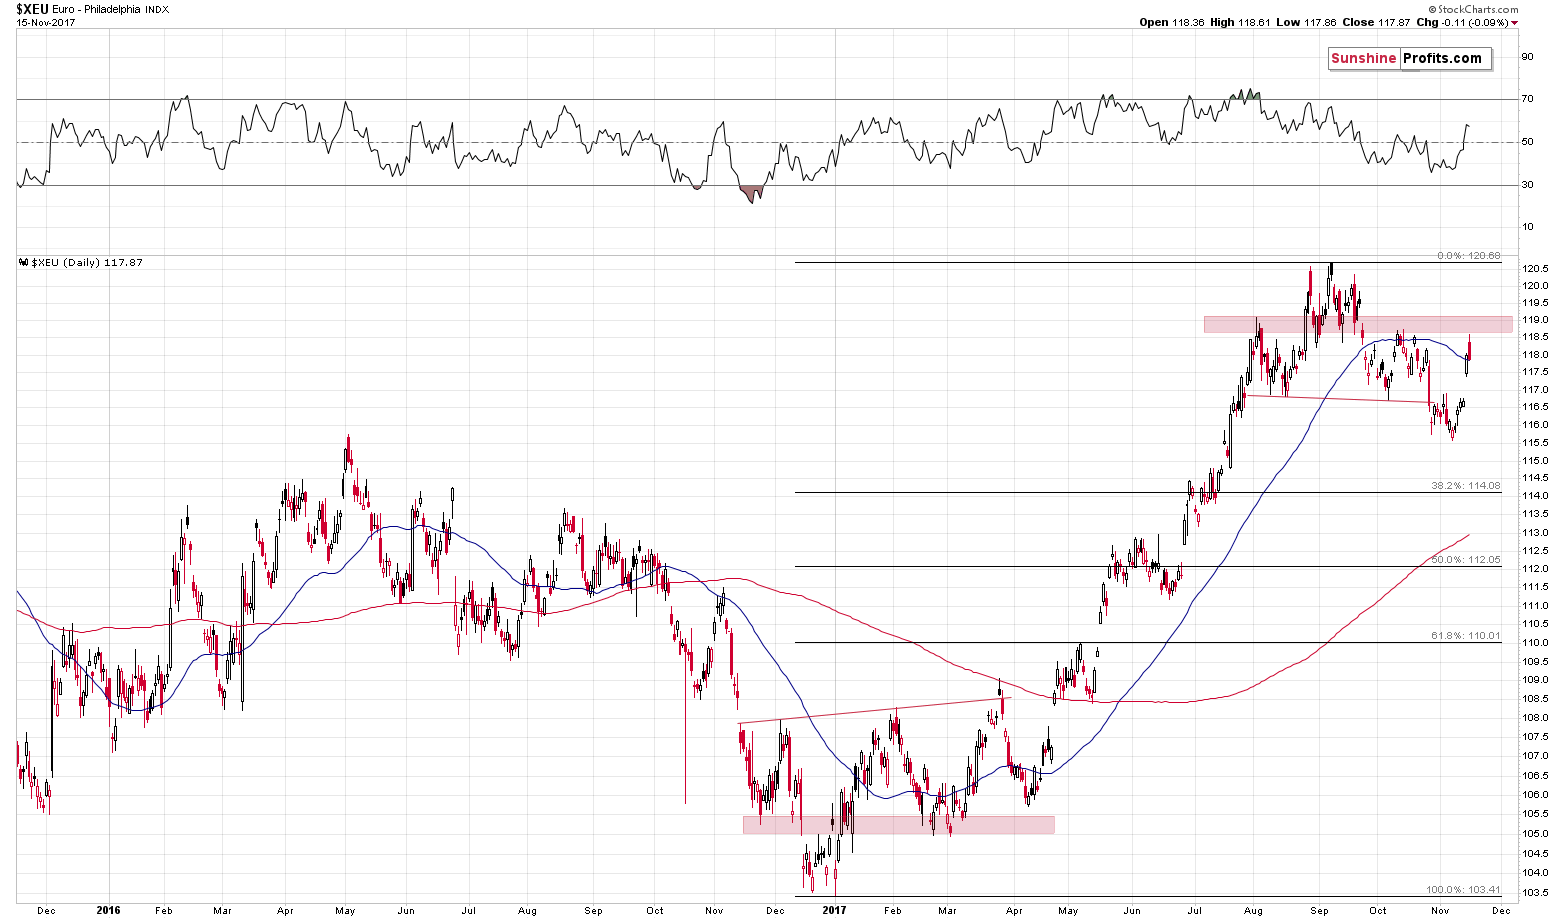
The euro soared back above the neck level of its head and shoulders formation and thus invalidating it. The invalidation was immediately followed by a rally (it’s usually prudent to wait for a confirmation of a breakdown, invalidations often result in immediate price moves) and a subsequent reversal that we saw yesterday. Are the implications going forward still bullish?
We have only one analogous situation in the recent past and that’s what happened between November 2016 and March 2017. Back then the formation was the reverse head and shoulders, which is analogous to the current one (only reversed). The size of the formation and the time that it took are similar, but that’s not all. That formation was also followed by an invalidation and a move close to the previous shoulders (red rectangle on the above chart). During this move the euro moved to the 50-day moving average and crossed it, but invalidated the move shortly.
So far the similarity continues. Please recall that the more similarities there are and the longer they continue, the more likely it is that the similarity will continue for the short term. If history is to rhyme, then what can we expect to happen next? Something analogous to what happened in April – a formation of another right shoulder (thus a “mutation”) and then a big move that was likely to happen based on the base version of the formation. In the current case, this means a downswing. Naturally, the implications are bullish for the USD Index and bearish for the prices of precious metals.
On a side note, why did the Teenage Mutant Ninja Turtles have to be teenage? It didn’t affect the story in any way… Anyway, back to gold. Gold in terms of the euro.
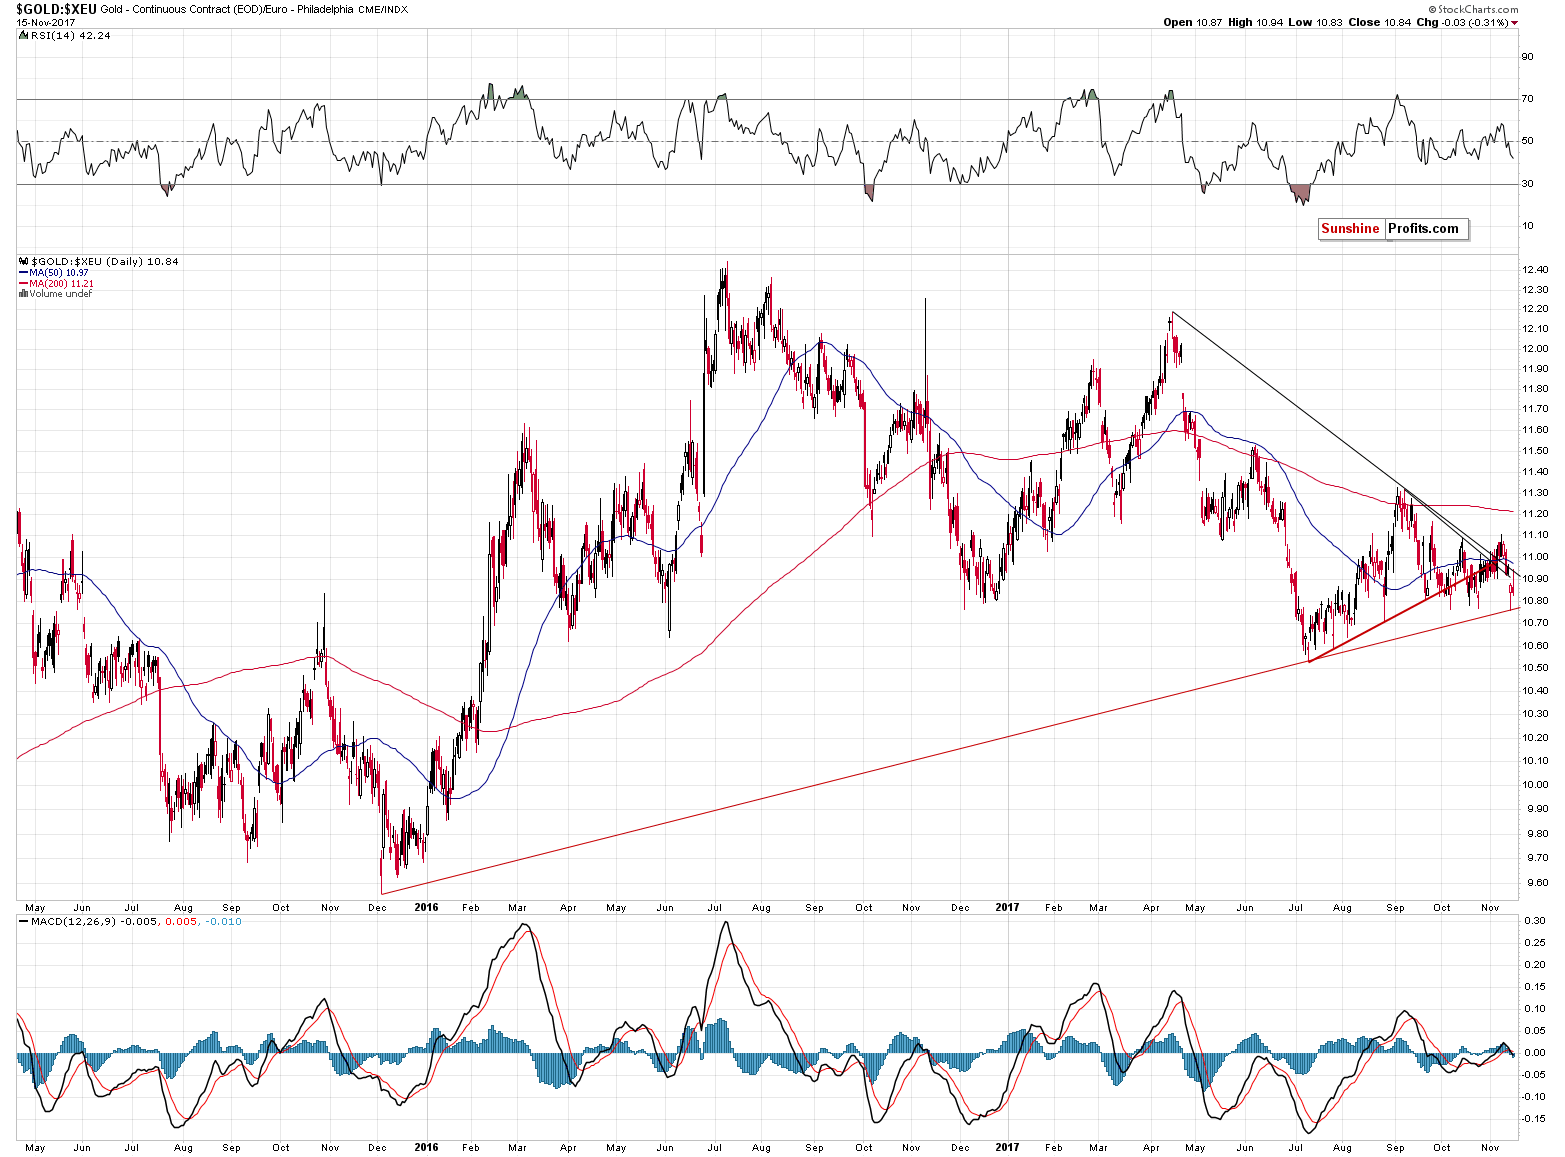
In yesterday’s alert, we wrote the following:
In terms of the European currency, the value of gold moved temporarily below the September and October lows and the MACD indicator flashed a small (but still) sell signal.
The above is not a bullish, but rather bearish piece of news for gold.
In today’s alert, we would like to add that nothing happened and that it further confirms the above. Why? Because in all previous cases, even including the late August low, when gold moved sharply lower to the current levels, it then reversed and rallied. That’s not what happened yesterday, so the situation is already different and the odds that it will manage to break below the support line based on the 2016 and 2017 lows increased further.
Moving to the regular USD perspective, we just saw a reversal that took place on volume that was the highest in 2 months. The implications are bearish and they are strengthened by the fact that the reversal was at the same time a small breakout above the very short-term resistance line and then an invalidation thereof.
The triangle based on the most recent lows points to a reversal in about 2 weeks and the same goes for silver.
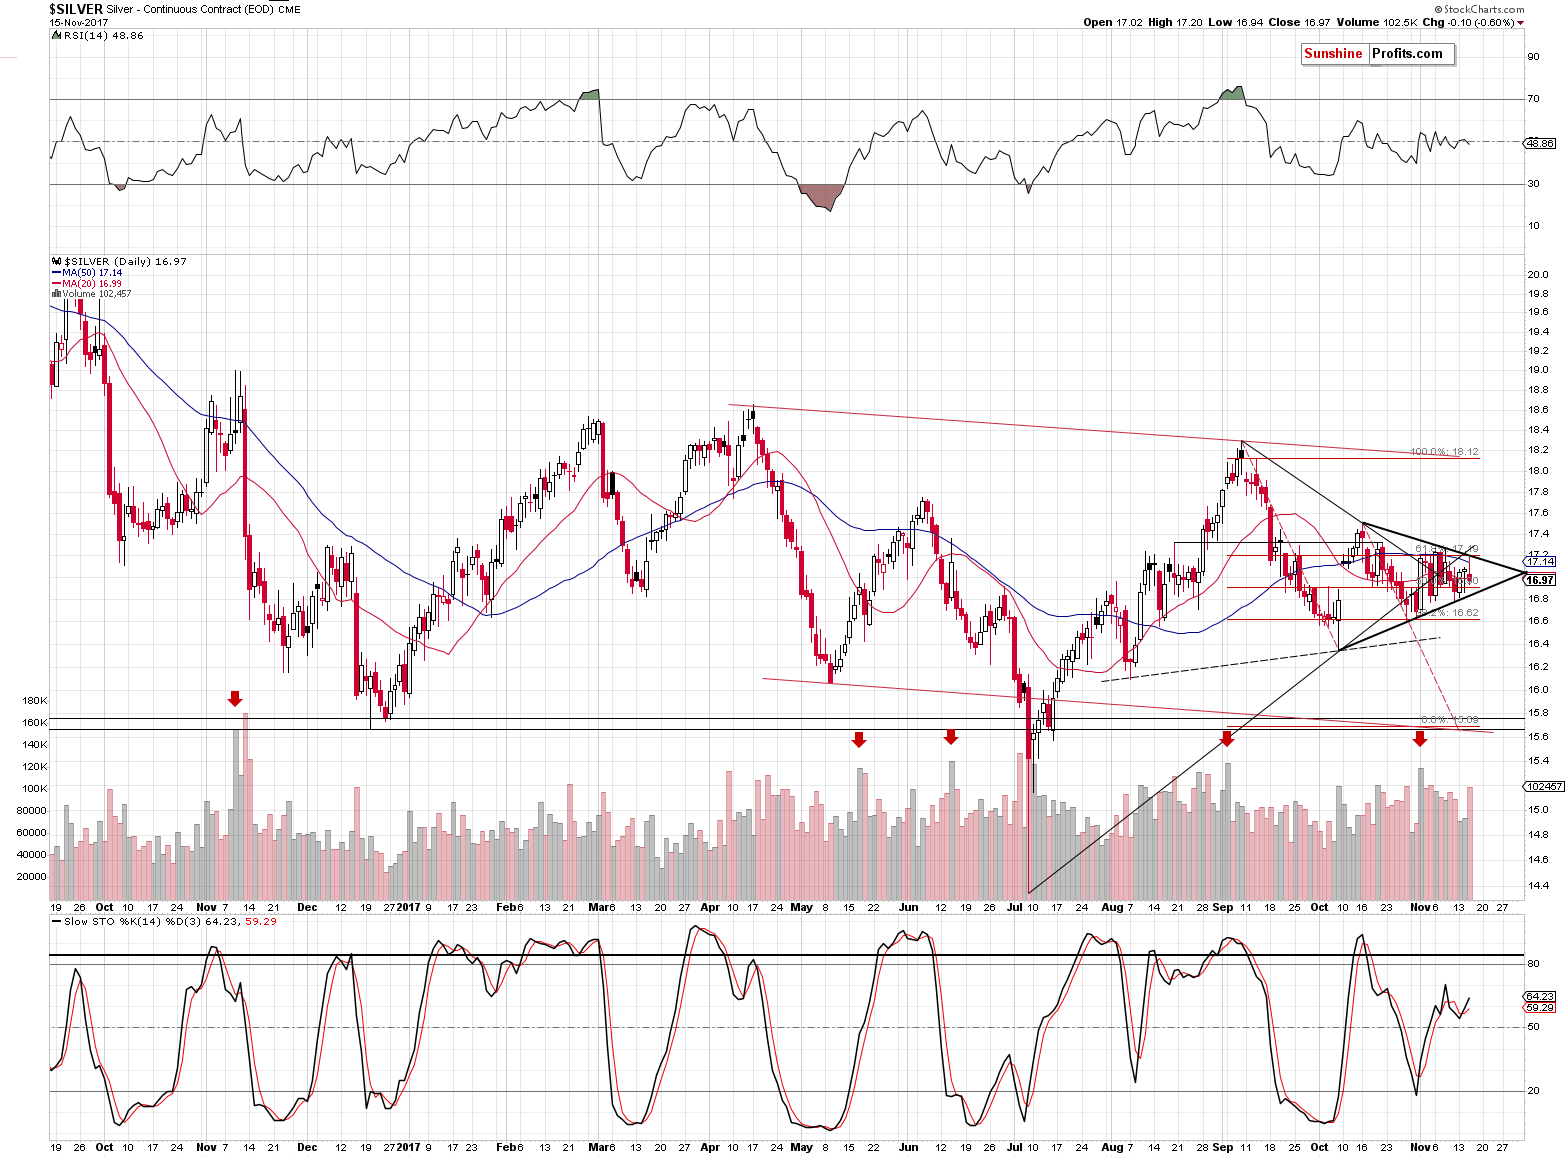
In the case of the white metal, the triangle is even more visible as yesterday’s intraday high took silver right to its upper border after which it reversed. The big volume confirmed the bearish implications of the reversal in this case as well.
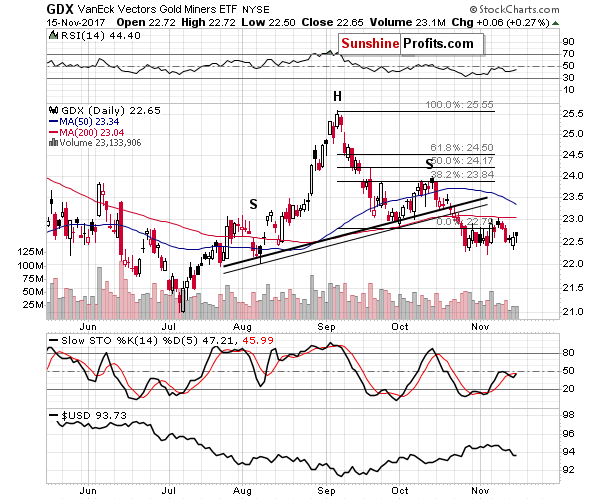
There were no changes in the case of mining stocks and our comments on the above chart remain up-to-date:
Gold stocks declined a bit while the GDX ETF moved a bit higher. None of the sell signals from the above were invalidated. The interesting factor here is that the volume on which GDX moved higher (just 3 cents, but still) yesterday was relatively low. That’s another confirmation that what happened yesterday was no show of strength in the precious metals market.
The GDX moved higher by 6 cents instead of 3, but that’s still next to nothing.
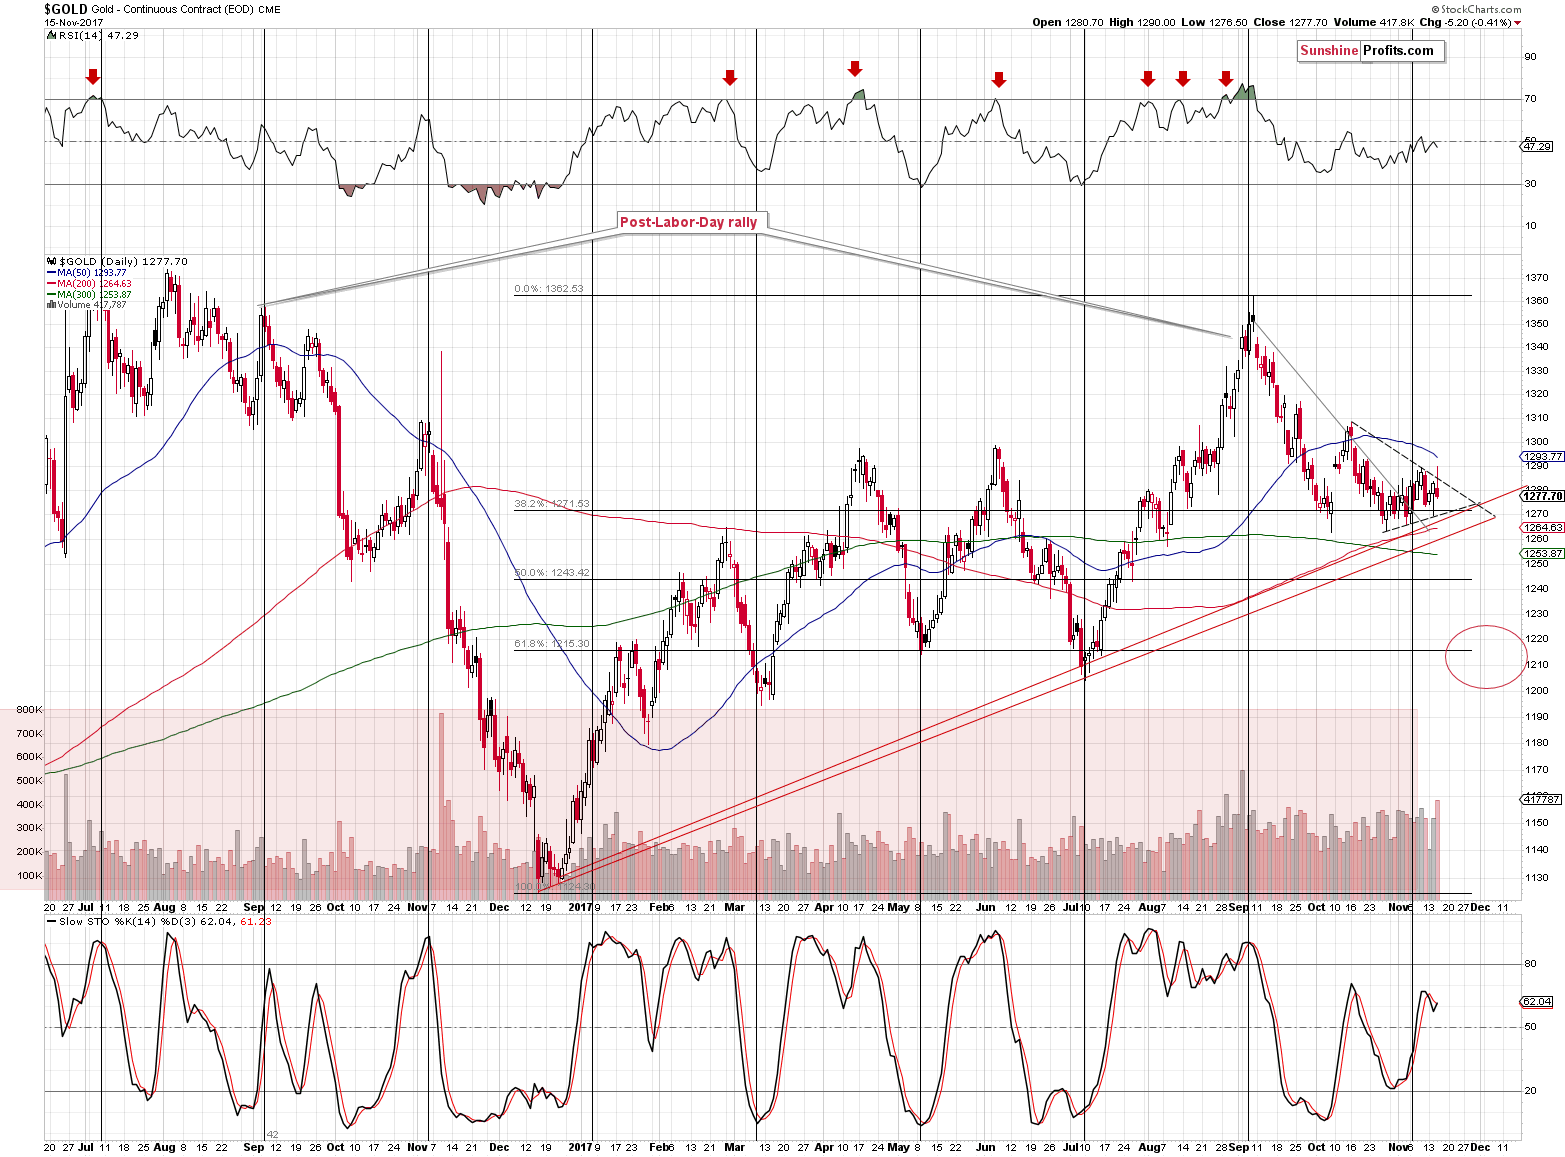
Summing up, the situation in the USD Index and the euro could be reversing shortly and based on it and many other factors the outlook for metals and miners remains bearish.
Since the USD Index is about 2 index points below its target price and gold is below $1,280 anyway, it seems that once again there is a greater chance that our original short-term target prices will stop the decline temporarily (!) than that there is a chance of a smaller decline to $1,250 - $1,260 or so.
The upcoming bottom is likely to be followed by a tradable rally, so we’re monitoring the market for confirmations and reliable signs of strength.
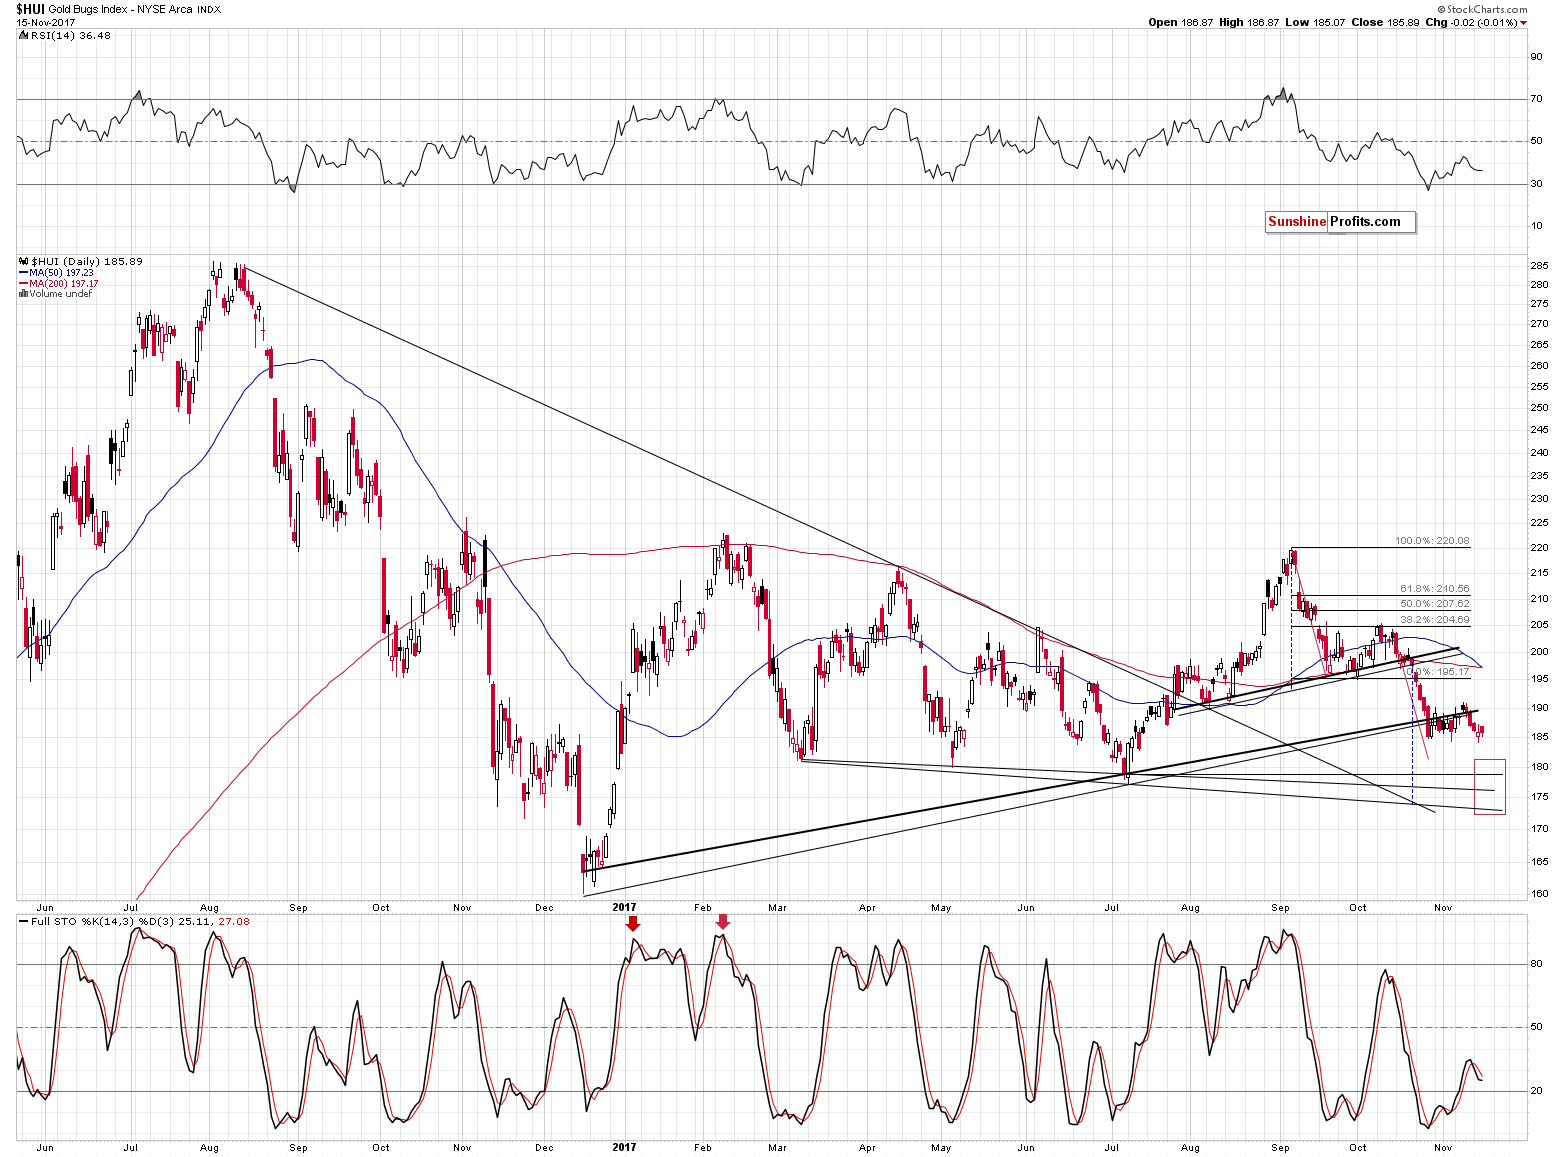
To be clear, the medium-term outlook remains bearish, especially that the analogy to the 2012-2013 decline remains in place and the previously discussed long-term signals remain in place: gold’s huge monthly volume, the analogy in the HUI Index, the analogy between the two most recent series of interest rate hikes, and the RSI signal from gold priced in the Japanese yen. However, it seems to be a good idea to take advantage of the upcoming short-term correction, should we get bullish confirmations from metals or miners.
As always, we will keep you – our subscribers – informed.
To summarize:
Trading capital (supplementary part of the portfolio; our opinion): Short positions (150% of the full position) in gold, silver and mining stocks are justified from the risk/reward perspective with the following stop-loss orders and exit price levels / profit-take orders:
- Gold: exit price: $1,218; stop-loss: $1,366; exit price for the DGLD ETN: $51.98; stop-loss for the DGLD ETN $38.74
- Silver: exit price: $15.82; stop-loss: $19.22; exit price for the DSLV ETN: $28.88; stop-loss for the DSLV ETN $17.93
- Mining stocks (price levels for the GDX ETF): exit price: $21.23; stop-loss: $26.34; exit price for the DUST ETF: $29.97; stop-loss for the DUST ETF $21.37
In case one wants to bet on junior mining stocks' prices (we do not suggest doing so – we think senior mining stocks are more predictable in the case of short-term trades – if one wants to do it anyway, we provide the details), here are the stop-loss details and exit prices:
- GDXJ ETF: exit price: $30.28; stop-loss: $45.31
- JDST ETF: exit price: $66.27; stop-loss: $43.12
Long-term capital (core part of the portfolio; our opinion): No positions (in other words: cash)
Insurance capital (core part of the portfolio; our opinion): Full position
Important Details for New Subscribers
Whether you already subscribed or not, we encourage you to find out how to make the most of our alerts and read our replies to the most common alert-and-gold-trading-related-questions.
Please note that the in the trading section we describe the situation for the day that the alert is posted. In other words, it we are writing about a speculative position, it means that it is up-to-date on the day it was posted. We are also featuring the initial target prices, so that you can decide whether keeping a position on a given day is something that is in tune with your approach (some moves are too small for medium-term traders and some might appear too big for day-traders).
Plus, you might want to read why our stop-loss orders are usually relatively far from the current price.
Please note that a full position doesn’t mean using all of the capital for a given trade. You will find details on our thoughts on gold portfolio structuring in the Key Insights section on our website.
As a reminder – “initial target price” means exactly that – an “initial” one, it’s not a price level at which we suggest closing positions. If this becomes the case (like it did in the previous trade) we will refer to these levels as levels of exit orders (exactly as we’ve done previously). Stop-loss levels, however, are naturally not “initial”, but something that, in our opinion, might be entered as an order.
Since it is impossible to synchronize target prices and stop-loss levels for all the ETFs and ETNs with the main markets that we provide these levels for (gold, silver and mining stocks – the GDX ETF), the stop-loss levels and target prices for other ETNs and ETF (among other: UGLD, DGLD, USLV, DSLV, NUGT, DUST, JNUG, JDST) are provided as supplementary, and not as “final”. This means that if a stop-loss or a target level is reached for any of the “additional instruments” (DGLD for instance), but not for the “main instrument” (gold in this case), we will view positions in both gold and DGLD as still open and the stop-loss for DGLD would have to be moved lower. On the other hand, if gold moves to a stop-loss level but DGLD doesn’t, then we will view both positions (in gold and DGLD) as closed. In other words, since it’s not possible to be 100% certain that each related instrument moves to a given level when the underlying instrument does, we can’t provide levels that would be binding. The levels that we do provide are our best estimate of the levels that will correspond to the levels in the underlying assets, but it will be the underlying assets that one will need to focus on regarding the signs pointing to closing a given position or keeping it open. We might adjust the levels in the “additional instruments” without adjusting the levels in the “main instruments”, which will simply mean that we have improved our estimation of these levels, not that we changed our outlook on the markets. We are already working on a tool that would update these levels on a daily basis for the most popular ETFs, ETNs and individual mining stocks.
Our preferred ways to invest in and to trade gold along with the reasoning can be found in the how to buy gold section. Additionally, our preferred ETFs and ETNs can be found in our Gold & Silver ETF Ranking.
As a reminder, Gold & Silver Trading Alerts are posted before or on each trading day (we usually post them before the opening bell, but we don't promise doing that each day). If there's anything urgent, we will send you an additional small alert before posting the main one.
=====
Latest Free Trading Alerts:
Last month, the World Gold Council published a new edition of its market update about Germany’s gold investment market. What can we learn from the report?
S&P 500 index lost 0.6% on Wednesday, as investors continued taking profits off the table. Is this a new downtrend or just downward correction before another leg up?
Bullish Expectations Following Yesterday's Decline, New Uptrend Or Just Bounce?
=====
Hand-picked precious-metals-related links:
PRECIOUS-Gold steady, investors weigh U.S. rate moves against fiscal outlook
Silver to switch to small surplus on softer fundamentals
=====
In other news:
Europe's longest stocks sell-off of the year abates
Don't expect the ECB to start increasing its bond buying, board member says
Morgan Stanley CEO: GOP plan for 20% corporate rate would stimulate the economy
Mark Cuban says tax rates have almost no impact on investment
FCC Plans December Vote to Kill Net Neutrality Rules
=====
Thank you.
Sincerely,
Przemyslaw Radomski, CFA
Founder, Editor-in-chief, Gold & Silver Fund Manager
Gold & Silver Trading Alerts
Forex Trading Alerts
Oil Investment Updates
Oil Trading Alerts

