

Briefly: in our opinion, full (250% of the regular size of the position) speculative short positions in gold, silver and mining stocks are justified from the risk/reward perspective at the moment of publishing this alert.
The price changes in the USD Index are one of the key determinants of the price moves in the precious metals sector – at least in the short run. Naturally, the price of gold is going to over- or underperform from time to time and the latter was one of the reasons that contributed to our significant profits on trading positions, but overall, when the USD Index is flashing an important signal, precious metals investors should pay attention to it. Yesterday, the value of the USD Index closed below the neck level of the reverse head-and-shoulders pattern, which seems to be a sell signal for the USD Index, and thus a buy signal for the PMs. Is it really the case?
Let’s start with the precious metals market and see what changed yesterday (charts courtesy of http://stockcharts.com).
Gold, Silver, and Platinum
The discussion will be brief in the case of the key precious metals as nothing really happened.
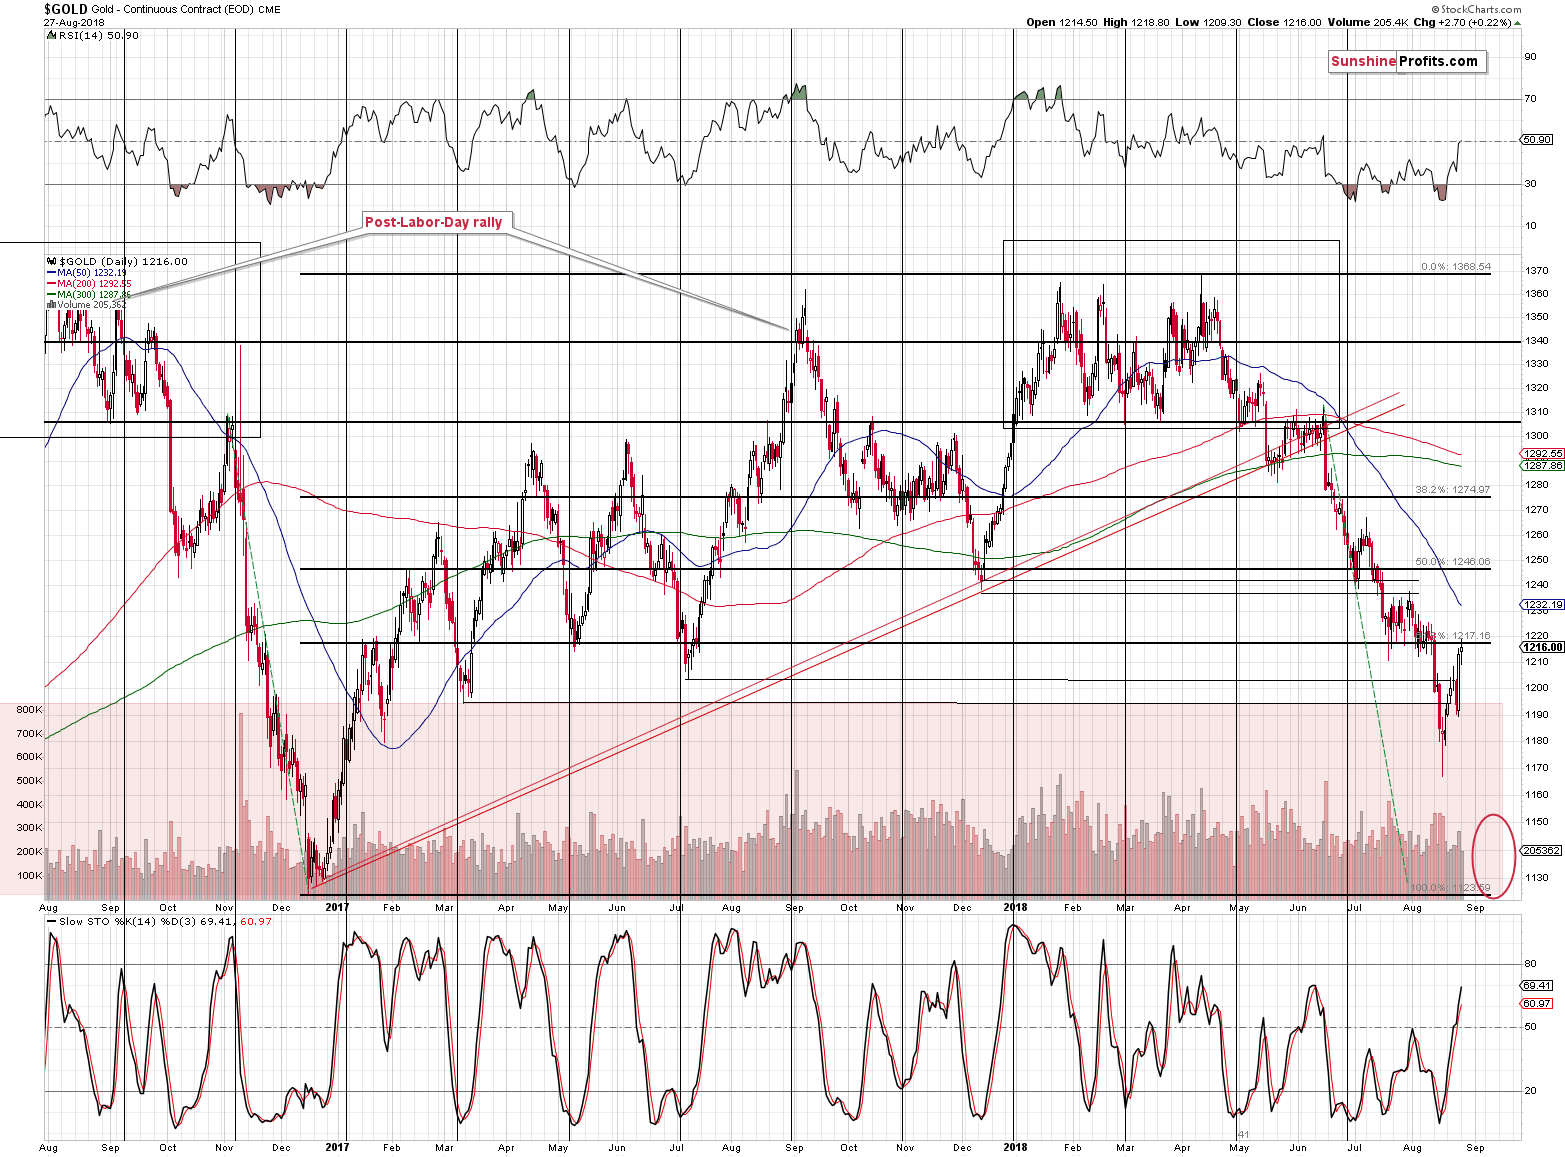
Gold didn’t move above the resistance levels that we described yesterday, so the outlook didn’t change:
Gold moved close to its previous lows and the previous support provided by the 61.8% Fibonacci retracement level. Gold closed above some of the 2017 bottoms, but not above the mentioned Fibonacci retracement and not above the July 2018 and early August lows. Consequently, while the move might have appeared significant, it didn’t change much from the technical point of view. It still seems to be just a correction within a bigger decline. Especially that the above is the most bullish chart that we have right now.
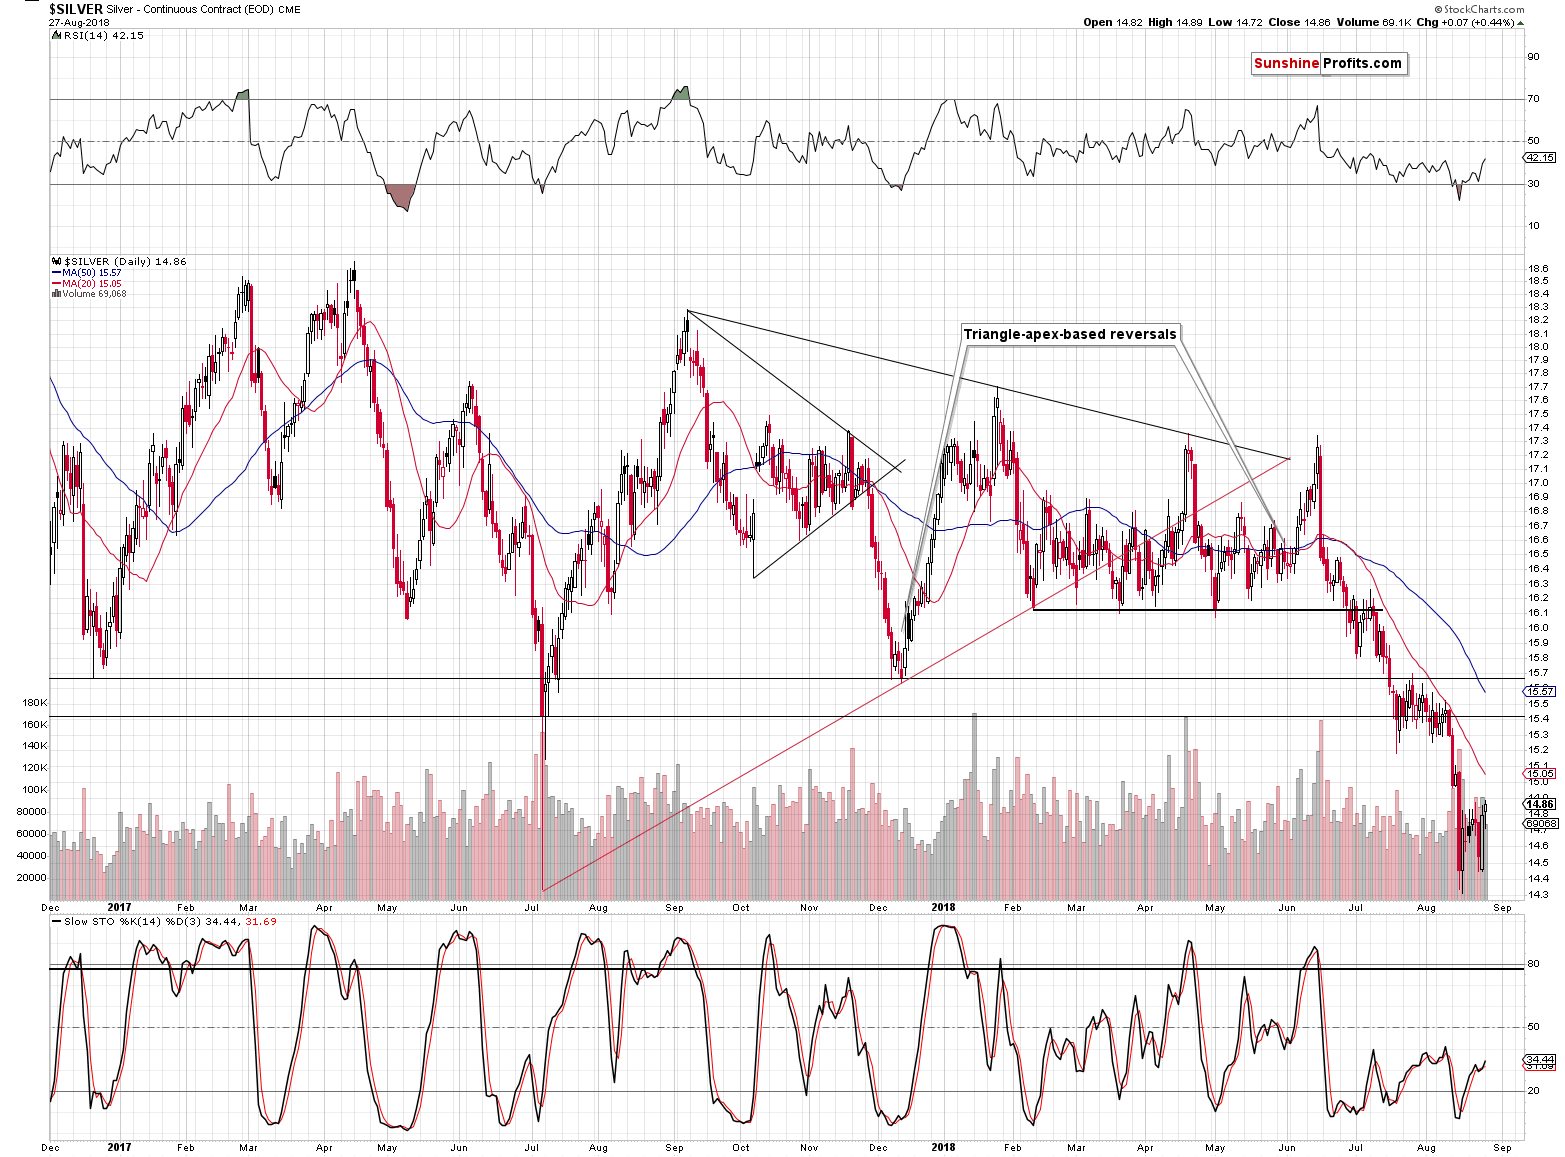
The white metal moved only a bit higher yesterday, so – as it is the case with gold – our yesterday’s comments remain up-to-date:
Silver didn’t move to new short-term intraday highs, so from the technical point of view, nothing changed. Silver paused after a very sharp decline and since it didn’t move back above the previously broken support, the implications remain bearish.
Silver didn’t outperform gold, but while silver’s short-term outperformance would serve as a bearish sign, the lack of it is not a bullish sign – it’s currently the normal course of action given the situation in the gold to silver ratio. We discussed the latter in detail in our previous Alert, and these comments remain up-to-date.
Silver is very close to the $15 level and it may want to verify this round price level as resistance before moving much lower. It seems that this is taking place today.
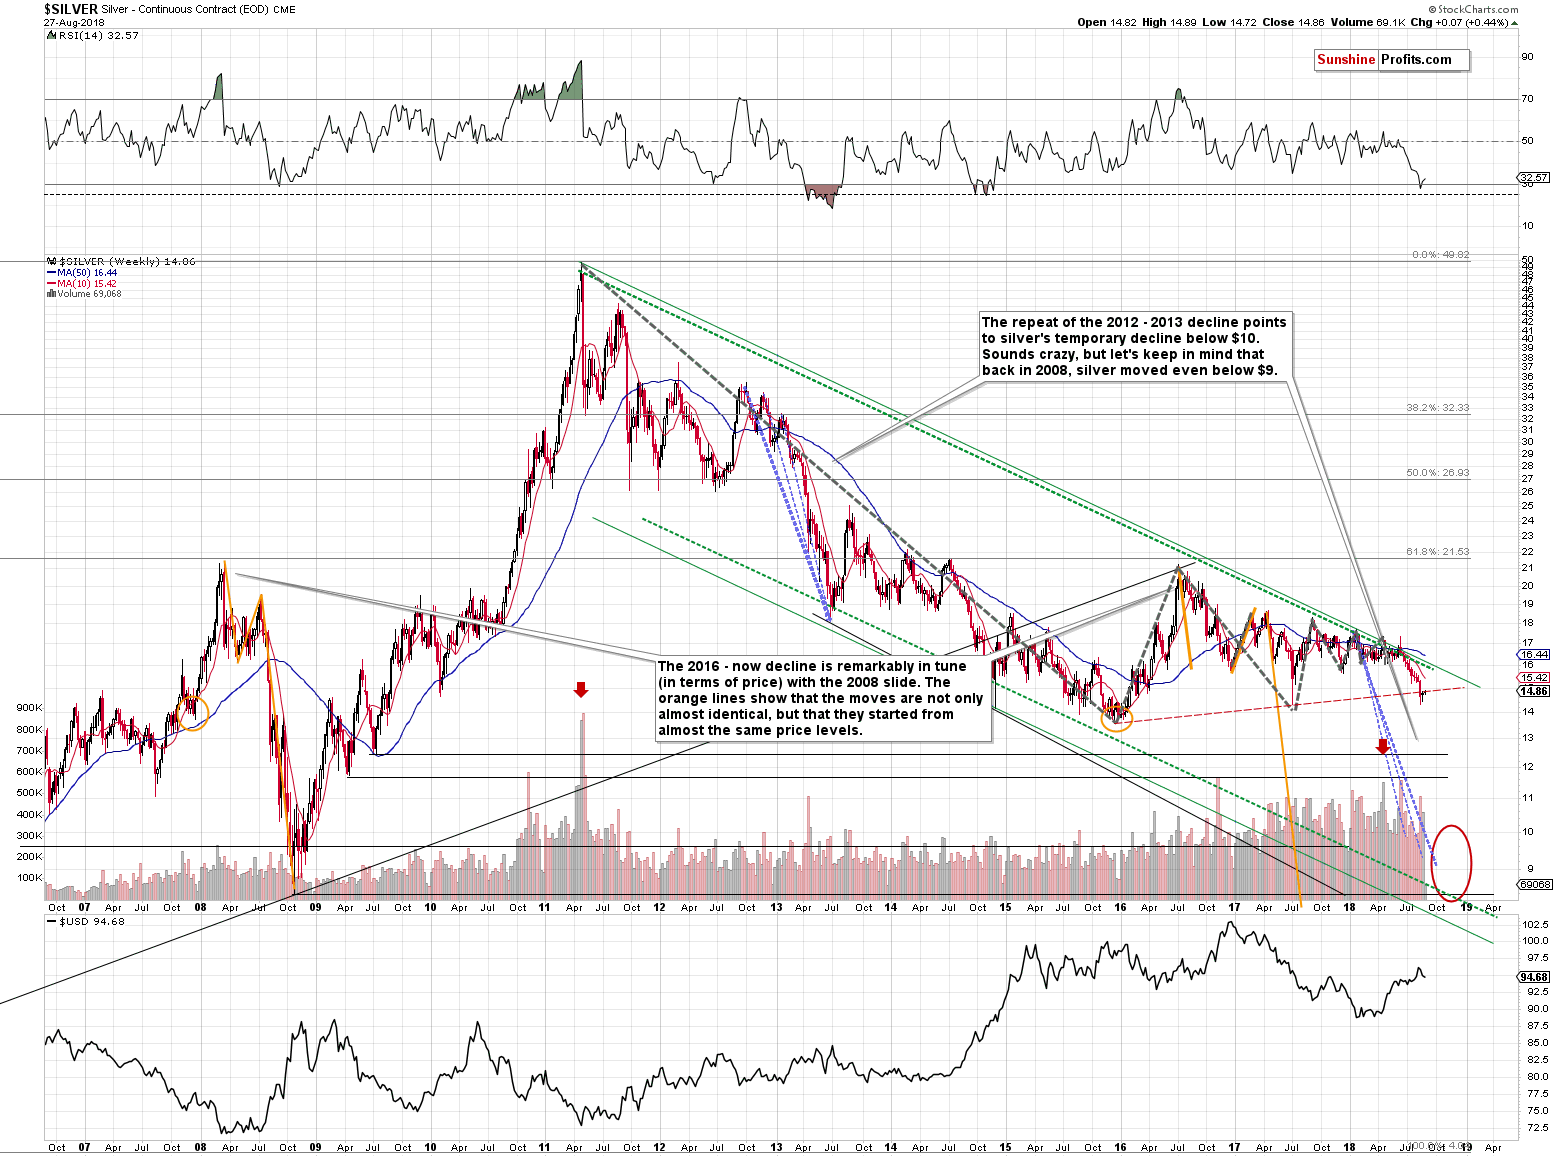
On the long-term silver chart, we can see that silver moved higher last week (by only $0.16, but still), but that wasn’t enough for the white metal to come back above the rising red resistance line based on the 2015 and 2017 bottoms. The implications of the breakdown remain in place and are strongly bearish.
Platinum’s Breakdown
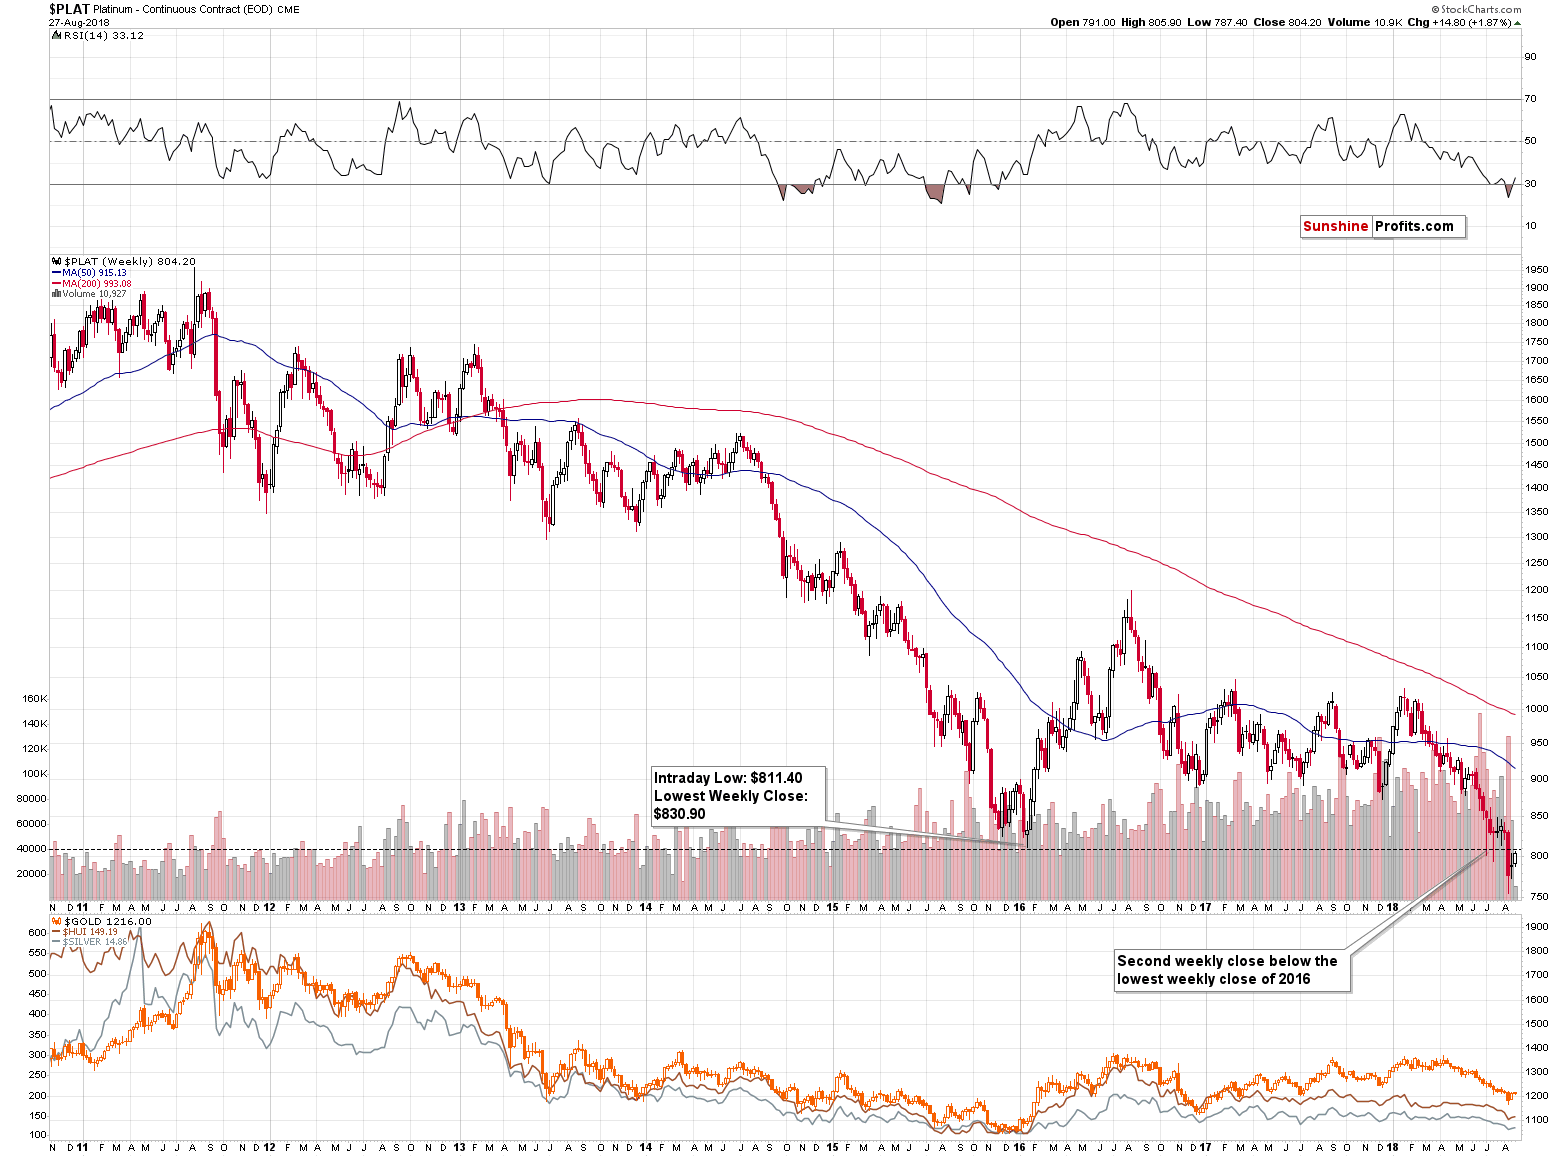
Another white metal – platinum – has just confirmed a breakdown below the 2015 lows in terms of weekly closing prices. Well, almost, because it would be best to have 3 weekly closes below a certain level, but since platinum closed below the 2015 low for many days, it seems that we can already say that the move is confirmed. The implications are clearly bearish for the platinum market, and to some extent to the rest of the precious metals sector as well, as the short-term moves tend to be aligned throughout the sector.
Platinum moved higher yesterday, but not back above the 2016 low, which means that a long-term resistance was just reached. This is a critical situation for platinum as it’s either going to decline from here, thus verifying the breakdown (more likely outcome), or invalidate the breakdown, which would have bullish implications for the short term (less likely outcome).
Mining Stocks’ Performance
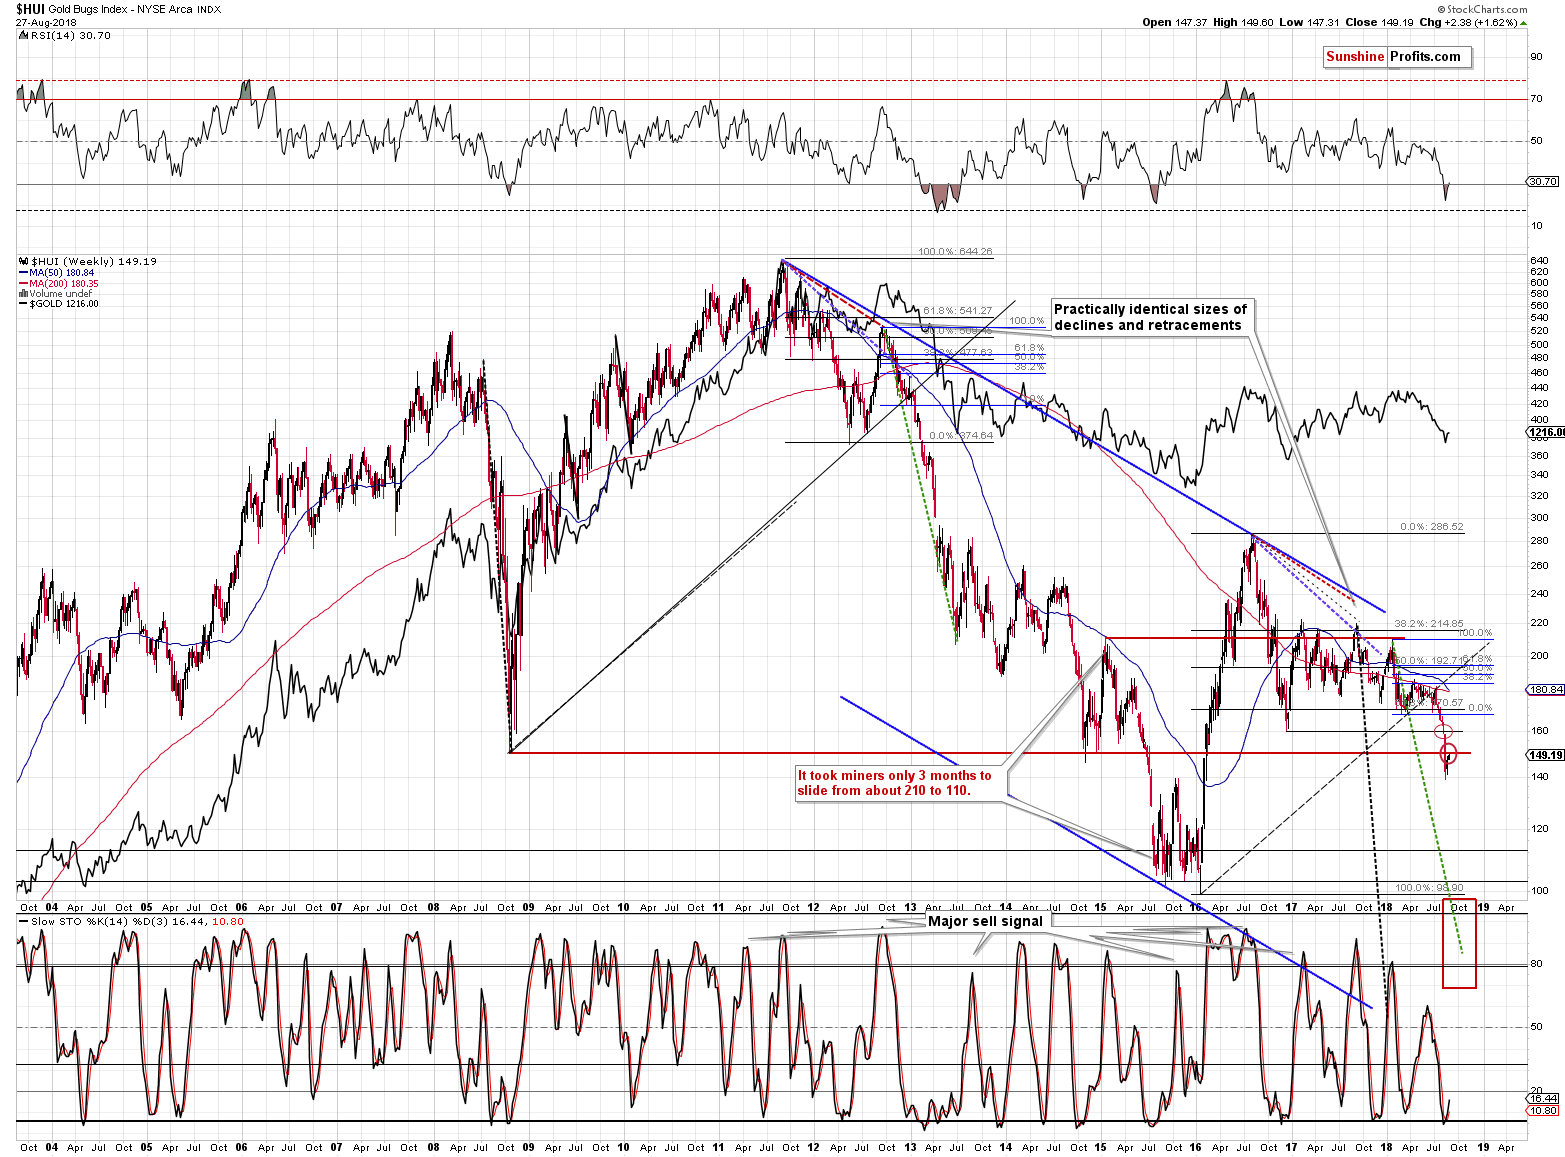
From the long-term point of view, nothing really changed. The HUI Index – proxy for gold stocks – is taking a breather after a volatile decline and a breakdown below the 2008 bottom. Gold rallied visibly last week, but mining stocks moved only a bit higher, thus once again indicating that what we saw was not the start of a new powerful upleg, but rather just a pause. Gold stocks had a good reason to rally and invalidate the previous breakdown but they didn’t manage to do it. The implications are bearish.
Yesterday, gold miners moved higher in a more visible way, but only if we focus on the short term. From the big perspective, we see that the HUI Index didn’t move back above the 2008 low – the 150 level. Consequently, nothing really changed from the technical point of view.
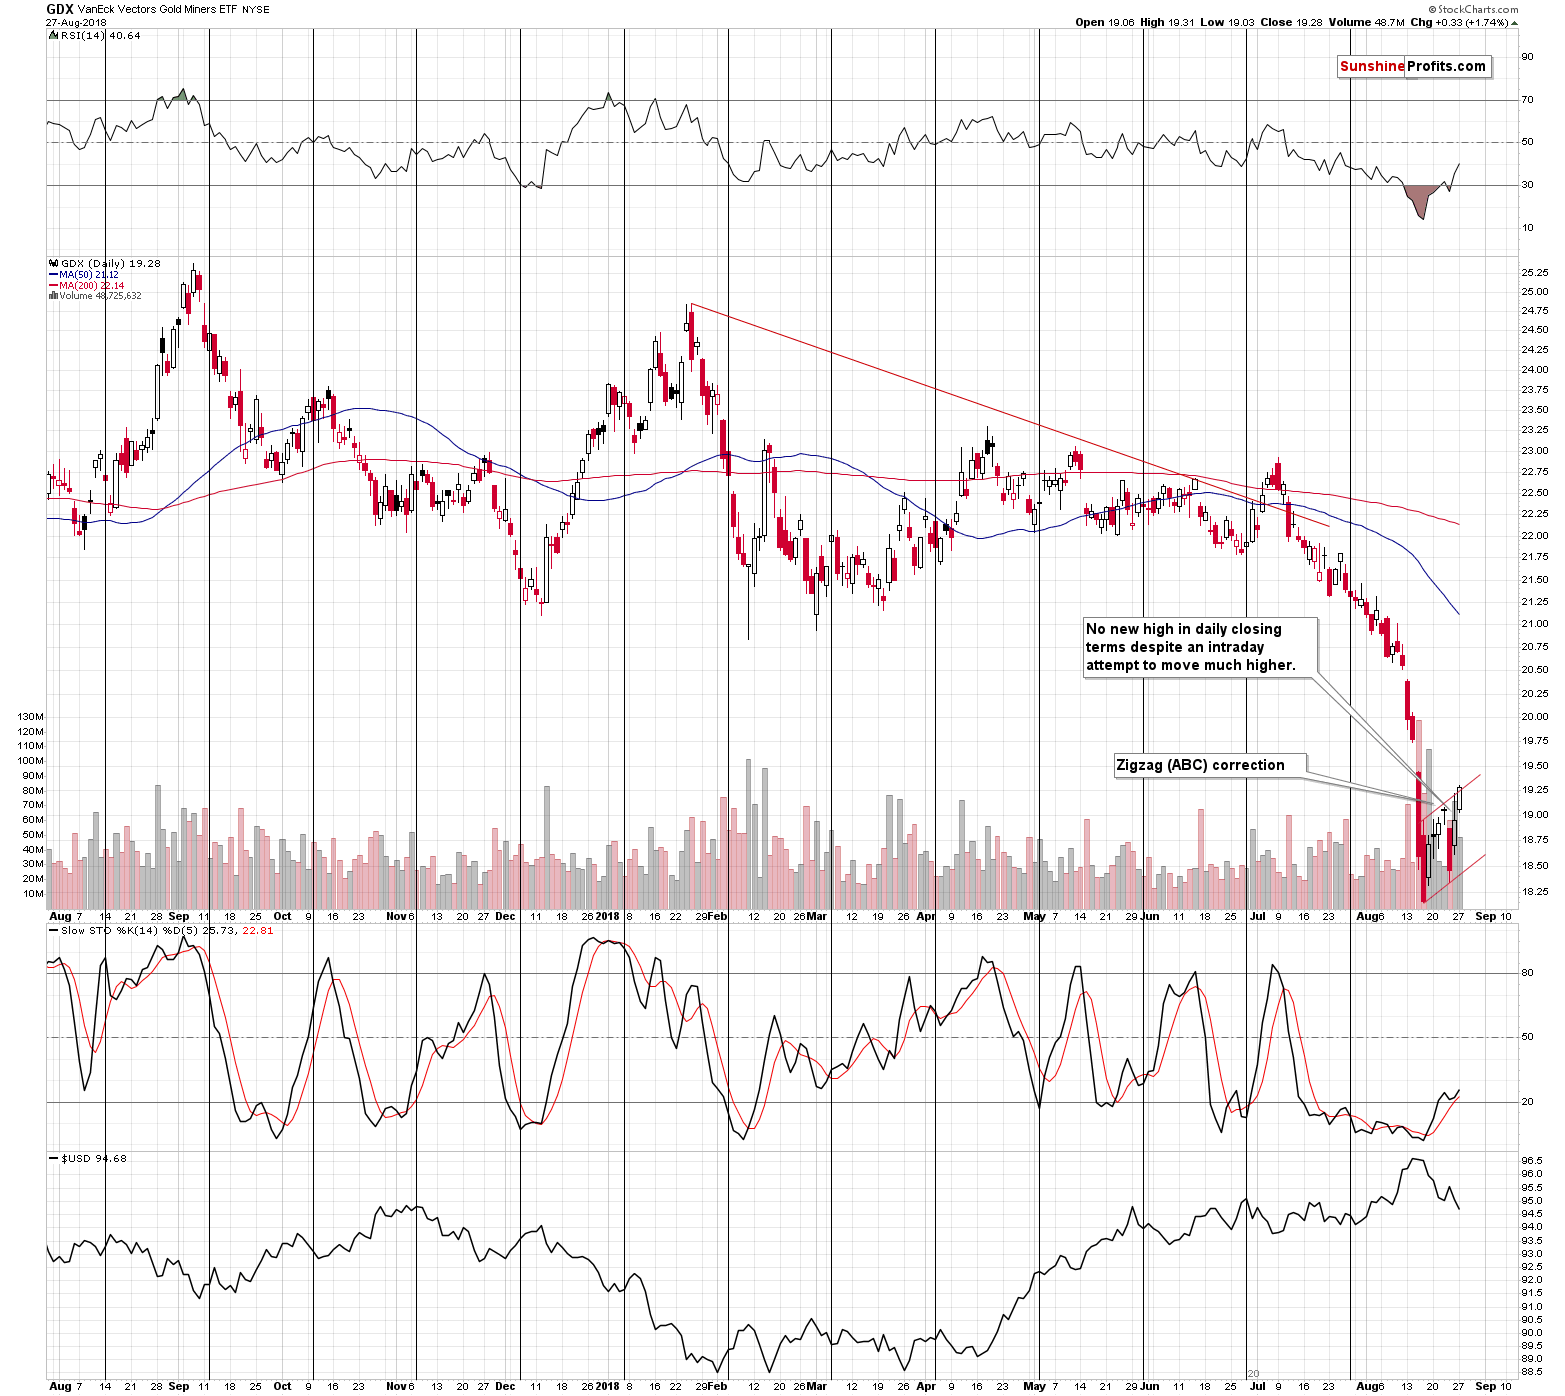
From the short-term point of view, we see that the GDX moved above last Wednesday’s closing price and finally managed to close above it, but it’s still nothing to call home about. Mining stocks are still very far from their early August lows and the current move higher appears to be a flag pattern that takes the form of a zigzag (ABC pattern). This pattern is quite common in the case of the precious metals sector (it was more common in the previous years, though) and it’s very possible that we’re seeing it once again here.
The first move to the upside (to last Wednesday’s high) was the A part of the move, then the Thursday’s decline serves as the B part of the pattern, and the current move higher is the final C part.
Overall, there was nothing particularly special about yesterday’s mining stock performance that would make the outlook bullish. Conversely, it remains bearish.
Having said that, let’s move to the part of the analysis you’ve been probably waiting for - the USD Index.
USD Index – Reverse H&S Update
In yesterday’s analysis, we commented on the above chart in the following way:
The most important thing about Friday’s price move is what didn’t happen. The USD Index moved lower, testing its early August lows (note how far the mining stocks are from their early August highs), but it didn’t close below the neck level of the reverse head-and-shoulders pattern.
That’s much more important than the daily decline itself, because the reverse head-and-shoulders pattern is what’s likely to determine the next big move in the USDX. Since the pattern was already confirmed by more than 3 daily closes above the neck level and the index is now verifying it once again by moving back to the neck level it tells us 2 things:
- The very bullish outlook remains in place
- The short-term downside is most likely very limited.
If the USD Index had broken visibly below the neck level and closed well below it, then we would say that the outlook for the short term had changed. But, that’s now what happened on Friday. The reverse head-and-shoulders pattern remains in place and so do its implications. They are very bullish for the USDX and very bearish for the precious metals sector.
The key question is if yesterday’s move was really visible. And the answer is that it’s not clear yet. At first sight, yes, the USD Index is below the dashed line that represents the neck level of the formation. But, the USDX was stopped by the rising, short-term support line and the continuation of the rally would be in tune with a much bigger self-similar pattern in the USD Index.

The current rally is very similar to 3 upswings – the ones that started in 2008, 2010 and 2014. The current short-term price movement is similar to what we saw in 2010 not only because of the shape of the short-term price moves, but also because of the proximity of the 200-day moving average (red line).
The self-similar patterns have not been invalidated, so they continue to point to higher USD values.
Zooming in, we also have a good reason to expect a reversal today.
In the August 22, Forex Trading Alert, we wrote the following as a description of this chart:
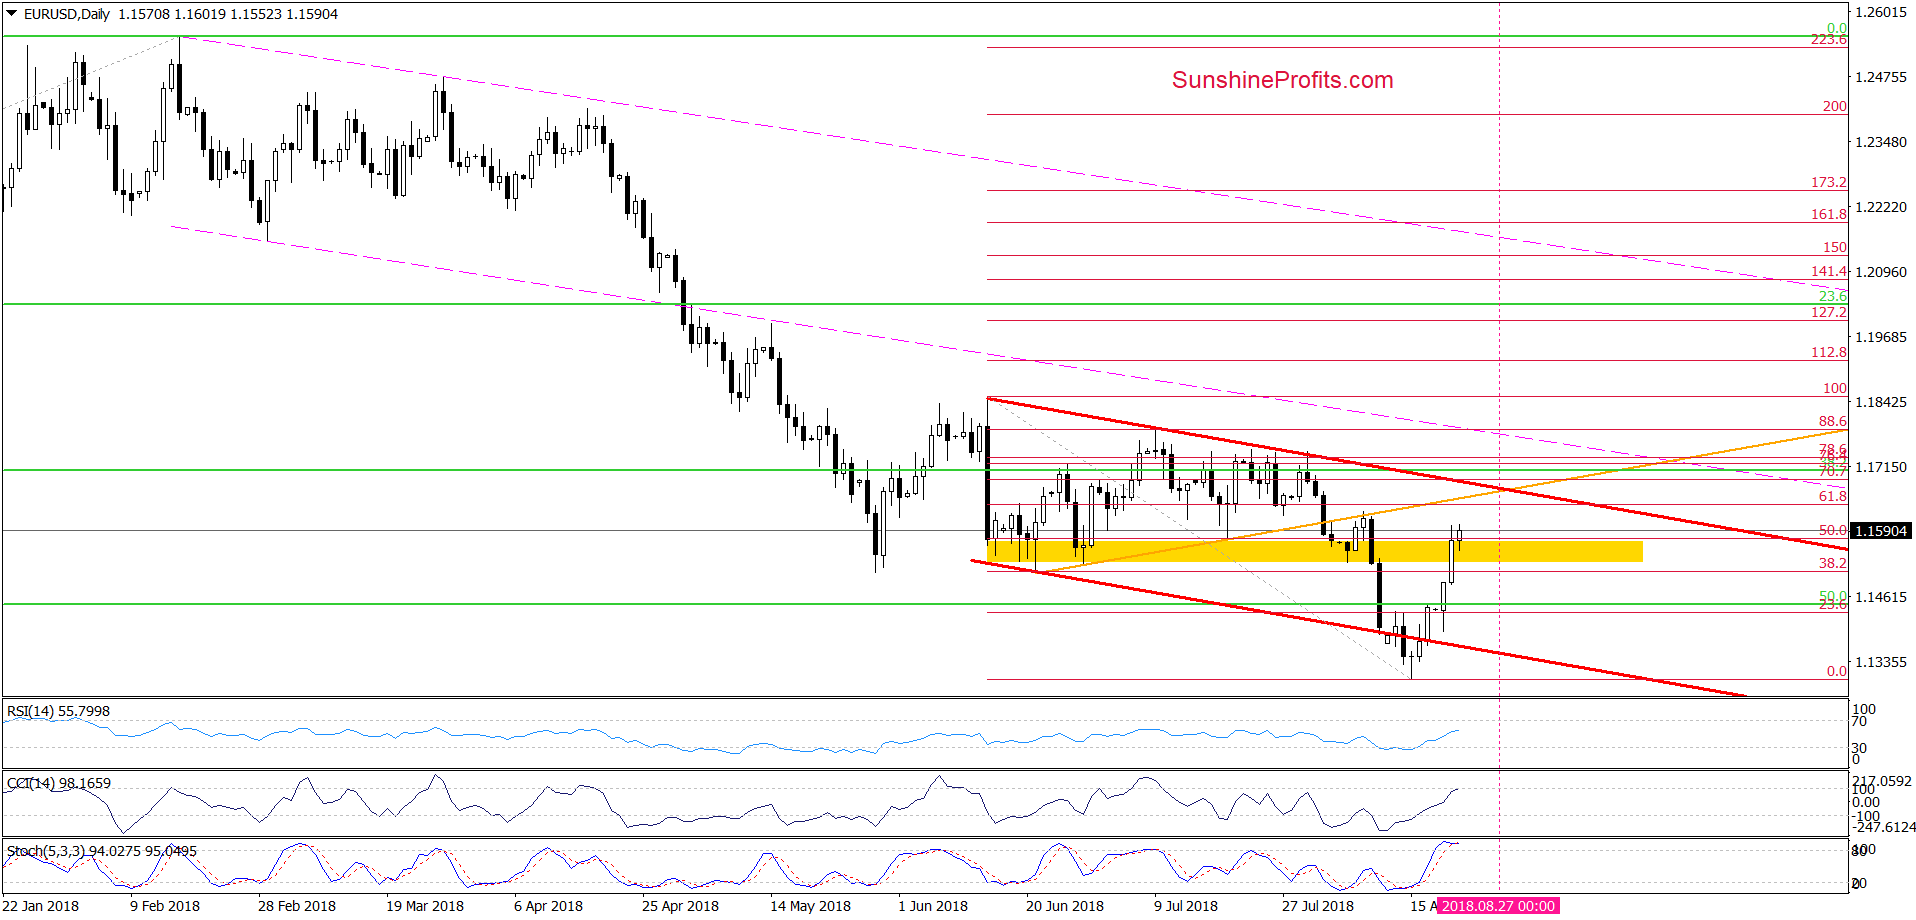
Looking at the very short-term changes, we see that EUR/USD extended gains after our yesterday’s alert was posted, which resulted in a breakout above the yellow resistance zone based on June lows.
Although the exchange rate pulled back at the end of the day, currency bulls didn’t give up and triggered another upswing, breaking above this area once again and showing further strength earlier today.
Taking all the above into account, it seems to us that the pair will test not only the 61.8% Fibonacci retracement and the previously-broken orange line (which serve as the nearest resistances), but also the upper border of the red declining trend channel in the following days.
(…)
So, when can we expect a reversal?
Basing on the triangle apex reversal technique, we think that we could see a change of the current direction at the beginning of next week. Why then?
Let's go back to the EUR/USD chart for a moment. As you saw on the daily chart, the upper border of the red declining trend channel creates a quite sizable triangle with the orange rising line based on the June lows.
The intersection of its lines will take place on Monday or Tuesday (we marked it with a pink horizontal line), which increases the probability that we’ll likely see a reversal – especially if EUR/USD and the USD Index reach the above-mentioned targets.
It’s Tuesday, so the reversal is quite likely to be seen today. This means that a quick move back above the neck level of the reverse head-and-shoulders pattern should also follow shortly. This in turn will cancel any bearish implications that the above might have at this time.
All in all, the long-term and short-term factors suggest that the one-day move below the neck level of the reverse head-and-shoulders formation should not be trusted – at least not yet. We will be ready to close the current position and take profits off the table if there are more severe signs of a downturn in the USD Index. At this time, however, it seems that exiting the positions now might be exiting it at the local top and right before the next big downswing.
Important Analyses
Before summarizing, we would like to emphasize that we have recently posted several analyses that are very important and that one should keep in mind, especially in the next several weeks. If you haven’t had the chance of reading them previously, we encourage you to do so today:
- Dear Gold Investor - Letters from 2013 - Analogy to 2013, which should make it easier to trade the upcoming sizable upswing (if enough factors point to it, that is) and to enter the market close to the final bottom.
- Gold to Soar Above $6,000 - discussion of gold’s long-term upside target of $6,000.
- Preparing for THE Bottom in Gold: Part 6 – What to Buy - extremely important analysis of the portfolio structure for the next huge, multi-year rally in the precious metals.
- Gold’s Downside Target, Upcoming Rebound, and Miners’ Buy Plan - details regarding the shape of the following price moves, a buying plan for mining stocks, and a brief discussion of the final price targets for the current decline.
- Key Factors for Gold & Silver Investors - discussion of key, long-term factors that support the bearish outlook for PMs. We are often asked what makes us so bearish – this article is a reply to this question.
We will also be posting another issue of the “Preparing for THE Bottom” series shortly (likely next week). The title will be “Buy-and-hold on Steroids”. Stay tuned.
Summing up, the long-term, and short-term factors suggest that the one-day move below the neck level of the reverse head-and-shoulders formation in the USD Index should not be trusted – at least not yet. Consequently, at this time the outlook for the precious metals market remains very bearish and it appears that another big slide is likely just ahead. Based on what we can infer from the 2013 decline, it is the time that we should pay extra attention to the PMs as their decline is likely not close to being over since no meaningful support has been reached in the case of gold and mining stocks.
As always, we’ll keep you – our subscribers – informed.
To summarize:
Trading capital (supplementary part of the portfolio; our opinion): Full short positions (250% of the full position) in gold, silver and mining stocks are justified from the risk/reward perspective with the following stop-loss orders and exit profit-take price levels:
- Gold: profit-take exit price: $1,062; stop-loss: $1,231; initial target price for the DGLD ETN: $82.96; stop-loss for the DGLD ETN $52.37
- Silver: profit-take exit price: $12.72; stop-loss: $15.56; initial target price for the DSLV ETN: $46.97; stop-loss for the DSLV ETN $28.87
- Mining stocks (price levels for the GDX ETF): profit-take exit price: $13.12; stop-loss: $20.81; initial target price for the DUST ETF: $80.97; stop-loss for the DUST ETF $30.87
Note: the above is a specific preparation for a possible sudden price drop, it does not reflect the most likely outcome. You will find a more detailed explanation in our August 1 Alert. In case one wants to bet on junior mining stocks’ prices (we do not suggest doing so – we think senior mining stocks are more predictable in the case of short-term trades – if one wants to do it anyway, we provide the details), here are the stop-loss details and target prices:
- GDXJ ETF: profit-take exit price: $17.52; stop-loss: $30.72
- JDST ETF: initial target price: $154.97 stop-loss: $62.78
Long-term capital (core part of the portfolio; our opinion): No positions (in other words: cash)
Insurance capital (core part of the portfolio; our opinion): Full position
Important Details for New Subscribers
Whether you already subscribed or not, we encourage you to find out how to make the most of our alerts and read our replies to the most common alert-and-gold-trading-related-questions.
Please note that the in the trading section we describe the situation for the day that the alert is posted. In other words, it we are writing about a speculative position, it means that it is up-to-date on the day it was posted. We are also featuring the initial target prices, so that you can decide whether keeping a position on a given day is something that is in tune with your approach (some moves are too small for medium-term traders and some might appear too big for day-traders).
Plus, you might want to read why our stop-loss orders are usually relatively far from the current price.
Please note that a full position doesn’t mean using all of the capital for a given trade. You will find details on our thoughts on gold portfolio structuring in the Key Insights section on our website.
As a reminder – “initial target price” means exactly that – an “initial” one, it’s not a price level at which we suggest closing positions. If this becomes the case (like it did in the previous trade) we will refer to these levels as levels of exit orders (exactly as we’ve done previously). Stop-loss levels, however, are naturally not “initial”, but something that, in our opinion, might be entered as an order.
Since it is impossible to synchronize target prices and stop-loss levels for all the ETFs and ETNs with the main markets that we provide these levels for (gold, silver and mining stocks – the GDX ETF), the stop-loss levels and target prices for other ETNs and ETF (among other: UGLD, DGLD, USLV, DSLV, NUGT, DUST, JNUG, JDST) are provided as supplementary, and not as “final”. This means that if a stop-loss or a target level is reached for any of the “additional instruments” (DGLD for instance), but not for the “main instrument” (gold in this case), we will view positions in both gold and DGLD as still open and the stop-loss for DGLD would have to be moved lower. On the other hand, if gold moves to a stop-loss level but DGLD doesn’t, then we will view both positions (in gold and DGLD) as closed. In other words, since it’s not possible to be 100% certain that each related instrument moves to a given level when the underlying instrument does, we can’t provide levels that would be binding. The levels that we do provide are our best estimate of the levels that will correspond to the levels in the underlying assets, but it will be the underlying assets that one will need to focus on regarding the signs pointing to closing a given position or keeping it open. We might adjust the levels in the “additional instruments” without adjusting the levels in the “main instruments”, which will simply mean that we have improved our estimation of these levels, not that we changed our outlook on the markets. We are already working on a tool that would update these levels on a daily basis for the most popular ETFs, ETNs and individual mining stocks.
Our preferred ways to invest in and to trade gold along with the reasoning can be found in the how to buy gold section. Additionally, our preferred ETFs and ETNs can be found in our Gold & Silver ETF Ranking.
As a reminder, Gold & Silver Trading Alerts are posted before or on each trading day (we usually post them before the opening bell, but we don't promise doing that each day). If there's anything urgent, we will send you an additional small alert before posting the main one.
=====
Latest Free Trading Alerts:
The World Gold Council has apparently speeded up its publishing. They have issued a few interesting pieces recently. In this edition of the Gold News Monitor, we discuss them.
WGC’s Gold Outlook for H2 2018
=====
Hand-picked precious-metals-related links:
PRECIOUS-Gold climbs as dollar dips after U.S.-Mexico trade deal
Gold bulls seen waiting a bit longer for the great short squeeze
Venezuela to Sell Gold Ingots to Pensioners as Inflation Soars
Perth Mint Gold and Silver Bullion Sales Rebound in July
=====
In other news:
World stocks hit six-month high as NAFTA deal eases trade war fears
US-Mexico trade agreement sends markets to record highs
Theresa May Says a No-Deal Brexit 'Wouldn't Be the End of the World.' The Pound Says Otherwise.
Pound Slips as May Comments Fuel Concerns About No-Deal Brexit
Friedman On Inflation, Hanke on Hyperinflation
US will lack fiscal space to respond when next recession comes
Bank of Israel unlikely to raise rates, not clear when it might: Reuters poll
China central bank raises yuan mid-point by the most in nearly 15 months, spurs dollar buying
German Banks Are Piling Into Cheap Debt
Italy Bond Yields Spike as Rome's Budget Clash Stirs Echoes of EU Debt Crisis
Oil rises to seven-week highs on signs of tighter supply
=====
Thank you.
Sincerely,
Przemyslaw Radomski, CFA
Founder, Editor-in-chief, Gold & Silver Fund Manager
Gold & Silver Trading Alerts
Forex Trading Alerts
Oil Investment Updates
Oil Trading Alerts

